Development of Modal Share Targets for Ottawa's Transportation Master Plan
←
→
Page content transcription
If your browser does not render page correctly, please read the page content below
Development of Modal Share Targets for Ottawa’s
         Transportation Master Plan

          Dr. Mona Abouhenidy, P.Eng., City of Ottawa

  David Kriger, P.Eng., MCIP, iTRANS Consulting Inc., Ottawa

 Don Stephens, P.Eng., McCormick Rankin Corporation, Ottawa
                   (formerly with the City of Ottawa)

                     Paper prepared for presentation
     at the Best Practices in Urban Transportation Planning Session
                  of the 2004 Annual Conference of the
                  Transportation Association of Canada
                          Québec City, Québec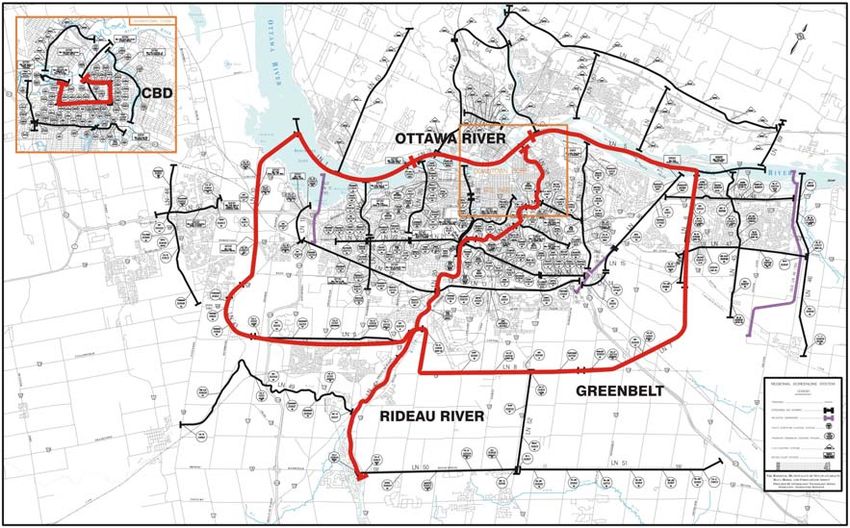
Abouhenidy, Kriger and Stephens – Development of Modal Share Targets for Ottawa’s Transportation Master Plan
Annual Conference of the Transportation Association of Canada                                      September 2004

ABSTRACT

The City of Ottawa updated its Transportation Master Plan (TMP) in 2003. The new
TMP plans for the management and reduction the long-term demand for single-occupant
vehicle trips through a combination of investment in rapid transit infrastructure and the
promotion of TDM and other complementary measures. These plans respond to a
series of modal share targets that were developed as part of the TMP. In contrast to the
traditional method of developing the target shares at screenlines, a new process was
introduced. This process took into account the entire trip from origin to destination, as
well as the trip purpose. The resultant targets thus allowed TMP actions and policies to
be related directly to the intended travel ‘market,’ as opposed to an arbitrary point on the
transportation network.

This paper describes the new process for developing modal share targets. The paper
includes a review of the different steps and how the results were applied to the Ottawa
TMP, and a comparison with the previous process. It concludes with a review of the
benefits to the development of transportation policies and plans, and possible next steps
to elaborate further the process.

1. INTRODUCTION

1.1      Context

Similar to many urban centres in Canada, the City of Ottawa is experiencing continued
and accelerated growth. Over the next two decades, population and employment are
expected to increase by 50%, to 1,192,000 residents and 750,000 jobs by 2021.
Suburban communities are projected to accommodate about 75% of the new residents
and about 50% of the new jobs. As a result, the overall demand for travel will grow by
about 60%, with peak directional demands diffused throughout the City.

In 2003, the City of Ottawa adopted a new Transportation Master Plan (TMP). The TMP
was prepared within the broader context of the “Ottawa 20/20” initiatives, a two-year
process to form a comprehensive blueprint for the future of Ottawa.

Traditionally, the transportation system had been developed with an emphasis on
mobility - to provide transportation facilities to accommodate expected travel demand. In
contrast, the City is planning a system that emphasizes accessibility - to increase the
range of options open to people who need to travel within the city. The City is striving to
minimize the future need for new and widened roads. Therefore, the TMP sets an
ambitious transit modal split objective of 30% in the PM peak hour, a rate nearly double
the current level of 17%. This target is based in large part upon a proposed
comprehensive expansion of the City’s bus and rail rapid transit networks. It is
complemented by the promotion of TDM and other complementary measures that are
aimed at reducing the single occupant vehicle (SOV) trip.

This direction is compatible with the City’s desire to protect and improve the
environment, reduce the amount of land used for new road infrastructure and decrease
air pollution and Greenhouse gas emissions from private automobile use.

                                                       1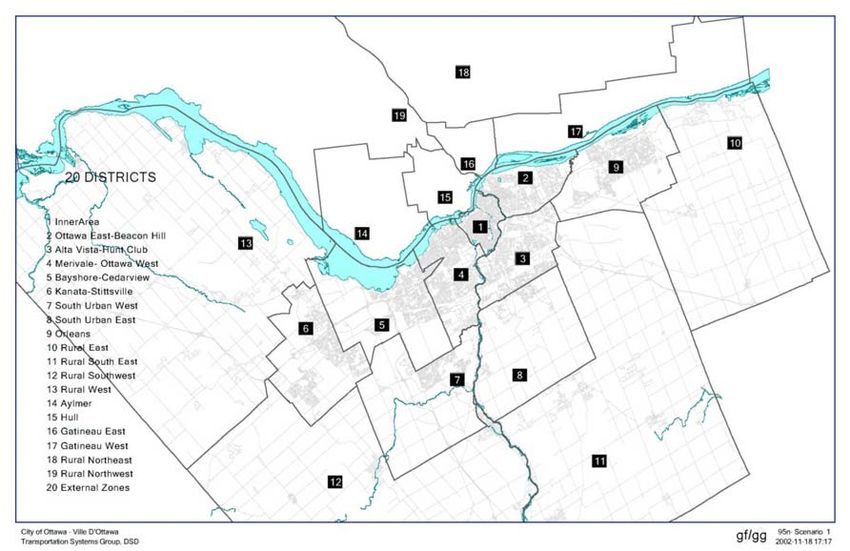
Abouhenidy, Kriger and Stephens – Development of Modal Share Targets for Ottawa’s Transportation Master Plan
Annual Conference of the Transportation Association of Canada                                      September 2004

1.2       Purpose of This Paper

This paper describes the process that was used to develop modal share targets for
Ottawa’s new TMP. Historically, transportation plans in Ottawa and other Canadian
cities expressed transit targets at screenlines across key corridors.1 These were based
upon travel demand model forecasts of auto and transit trips, which were then factored
to identify desired transit targets. The resultant auto trips were used to identify forecast
deficiencies in road capacity (i.e., the requirements for new road infrastructure). The
previous transportation plan, the (former) Region of Ottawa-Carleton’s 1997 TMP,
developed its targets this way.2

However, the use of screenlines as the basis for the targets is problematic, for several
reasons. The most important of these is that it is difficult to tie a link-based target (i.e.,
which the screenline factors represent) to actual travel patterns (purposes or
origins/destinations). As a result, the impact of proposed actions or policy measures on
specific segments of the travel ‘market’ cannot be measured directly against the targets
set along key travel corridors.

Accordingly, the 2003 TMP introduced a new process for identifying targets and
deficiencies, based upon trip purpose. An analysis of Ottawa’s origin-destination survey
found that transit modal split for the home-work commute could be categorized
according to the density of employment (jobs / km2) and the proximity of the workplace to
the existing rapid transit network. Different transit targets (representing the impact on
2021 demand of the expanded rapid transit network coupled with workplace measures
such as reduced parking supply and TDM programmes) then were developed for each
category. Similar transit targets were developed for non-work trip purposes. In addition,
for the first time, explicit ridesharing, walking and cycling targets were identified.

The new process required interventions at different points within the City’s TRANS
EMME/2 forecasting model, according to a transparent process.3 The model outputs
were again expressed at screenlines, but this time they could be used as-is to identify
road deficiencies. Overall, the new process resulted in more holistic transit target that
could be tied directly to TMP policies and actions, thus fostering a greater understanding
of the potential ‘market’ for them. In addition, the new process also made possible the
inclusion of specific targets for other (non-SOV) modes.

The remainder of this paper is structured as follows. Section 2 provides a context, by
describing the process of developing the TMP. Section 3 reviews the traditional method
of developing target modal shares. Section 4 explains why a new method was needed;
the new method, and its application to the TMP, are described in Section 5. Section 6

1
      Screenlines are imaginary lines that cut across roads, transit facilities, bicycle paths and
      footpaths, at which the total numbers of vehicles and persons, by type, can be counted.
      From these counts, which in Ottawa are typically conducted for a 12-hour period, modal
      shares during different times of the day are determined.
2
      The Region of Ottawa-Carleton and its 11 constituent municipalities, including the former City
      of Ottawa, were amalgamated to form the ‘new’ City of Ottawa in January 2001.
3
      TRANS is an intergovernmental committee that oversees transportation model development
      and travel surveys for the National Capital Region. It is comprised of the Cities of Ottawa and
      Gatineau (Québec), the Ministries of Transportation of Ontario and Québec, the two transit
      operators (OC Transpo and the Société de transport de l’Outaouais [STO]) and the National
      Capital Commission.

                                                       2
Abouhenidy, Kriger and Stephens – Development of Modal Share Targets for Ottawa’s Transportation Master Plan
Annual Conference of the Transportation Association of Canada September 2004
assesses the new method, identifies possible refinements for the future and concludes
the paper with a review of possible applications to the development of long-range
transportation plans elsewhere.
It should be noted that although this paper focuses on the process of developing modal
share (i.e., demand) targets, the underlying research also examined supply-side factors,
which are not discussed in this paper. These factors were applied to the analysis of
capacity deficiencies at the screenlines. The factors accounted for heavy trucks and
buses, light trucks, passenger-car equivalency factors, transportation system
management factors and level of service standards. In addition, the individual lane
capacities of different road types were reviewed. Many of these capacities were
increased in light of actual observed throughput.
2. CURRENT AND ANTICIPATED CONDITIONS
Key points to note are:
• Rapid growth is projected for the City of Ottawa. As noted, the City’s
population is set to increase by 50% to 2021, to 1,192,000 persons. Employment
is projected to grow even faster, to 750,000 jobs by 2021. The number of
households (dwelling units) also is expected to increase faster than the
population, to 502,000 by 2021.
• More people in more households will be working. The rate of jobs per person
increases, by 17% in Ottawa as a whole. By 2021, the average number of jobs
per dwelling unit (1.5) will exceed the 1997 Regional target of 1.1 – 1.3 jobs per
unit.
• Most of the growth will take place in three urban communities (Kanata-
Stittsville, Orléans and Barrhaven-Riverside South / Leitrim). As shown in Figure
1, the three urban communities are located outside the Greenbelt that surrounds
the inner suburbs. (The figure divides the City of Ottawa [and the adjoining City
of Gatineau] into 20 analytical zones.4) Three-quarters of the growth in
population, over half the new dwelling units (58%) and just over half the new jobs
(52%) are expected to be located in the three urban communities.
The rapid growth in population and jobs translates into two key implications for travel:
1. There will a substantial increase in travel during the PM peak hour. Total
person-trips are projected to increase roughly according to growth in dwelling units
(81%). Over half the projected increases in PM peak hour travel will start or end in
the three urban communities.
2. Peak travel demand will spread; notably, with more trips taking place in the off-
peak (inbound) direction and more suburb-to-suburb travel. In particular, the three
urban communities will have 30% of the City’s jobs in 2021, almost as many as the
Inner Area’s 33% (although the Inner Area will continue to have the City’s dominant
4
The 20 districts are aggregations of the TRANS EMME/2 transportation model’s 258 zone
system (see Section 5.2.2 below).
3Abouhenidy, Kriger and Stephens – Development of Modal Share Targets for Ottawa’s Transportation Master Plan
Annual Conference of the Transportation Association of Canada September 2004
concentration of jobs). By 2021, almost as many people will live in the three urban
communities as inside the Greenbelt, with 44% of the population (compared with
47% inside the Greenbelt).
Figure 1. City of Ottawa Analytical Districts
Finally, a review of recent trends provided some insight into the potential markets for
non-SOV modes:
• Growth in Peak Vehicular Traffic. Observed traffic counts at four groups of
screenlines5 (shown in Figure 2) indicate that between 1989 and 2001, AM and
PM peak hour and peak period volumes have increased in (at least) the peak
directions. The overall annual increases have been of the order of 1% or less.
By comparison, PM peak hour traffic on the same screenlines is projected to
increase by a minimum of 1.5% per year between 2001 and 2021. Traffic
volumes are expected to grow faster in the future than they have in recent years.
• Vehicle Occupancy Trends. The same screenline data indicate that average
auto occupancy ( number of people in individual vehicles)continues to fall over
time, for both peak periods. For example, in 1989, at the Central Business
District screenline, the auto occupancy was 1.46 persons per vehicles during the
PM peak hour outbound (i.e., the peak direction, travelling away from the
downtown). In 2001, the average at this screenline was 1.38 persons per
vehicle. Taken together with the aforementioned growth in traffic, the results
means that more vehicles are carrying fewer people.
5
The screenlines were: Ottawa River, Rideau River, a cordon around the Central Area (Central
Business District) and a cordon around the Greenbelt.
4Abouhenidy, Kriger and Stephens – Development of Modal Share Targets for Ottawa’s Transportation Master Plan
Annual Conference of the Transportation Association of Canada September 2004
Figure 2. Screenlines Used in Trends Analysis
• Peak Spreading Trends. An important indicator of congestion is how peak hour
travel has spread into the adjoining times. The peak spreading phenomenon
occurs when peak hour drivers divert their trips to the ‘shoulders’ of the peak
(before or after), thereby avoiding the peak. Since the peak hour represents 40%
of the 2½ peak period, a peak hour ratio (the ratio of peak hour- to peak period-
vehicle volumes) approaching 40% means that sustained congested conditions
would occur. (i.e., 100% of the peak period traffic divided by 2½ hours = 40% of
the traffic in each hour). This also indicates the extent to which individuals are
able and prepared to adjust their travel times to avoid the severe congestion that
would otherwise result. Finally, it is an efficiency indicator of the proportion of the
day that the full capacity of the transportation system can be utilized.
The evidence indicates that peak spreading is occurring - slowly - in Ottawa.
Table 1 compares the aggregate screenline PM peak hour factors in the peak
(outbound) direction for 1989 and 2001 for vehicles. The data indicate that peak
spreading is occurring, although at a relatively slow rate (with annual changes
generally of 0.5% per year or less).
Screenline Period (peak direction) 1989 2001
Ottawa River PM outbound 46% 44%
Rideau River PM outbound 45% 43%
Central Business District PM outbound 46% 45%
Greenbelt PM outbound 46% 44%
Table 1. Screenline Peak Spreading (vehicles) – 1989-2001*
* Source: Screenline data provided by the City of Ottawa.
5Abouhenidy, Kriger and Stephens – Development of Modal Share Targets for Ottawa’s Transportation Master Plan
Annual Conference of the Transportation Association of Canada September 2004
The data suggest that the achievement of the ‘40%’ threshold appears to be
some years away – at current trends, this would occur after 2021. Ottawa’s
congestion is not as pervasive, say, as that of Toronto; but the situation cannot
be ignored. At the same time, however, there are currently sharp 15-minute
peaks, which like will continue to exist even as the peak flattens across the 2½
hour peak period (to speak nothing of non-recurrent congestion that is caused by
incidents, which also impact peaking).
Another reason the situation cannot be ignored is suggested by the following
indicator: The peak hour ratio for person-trips by all modes across the National
Capital Region is approaching this threshold: dropping from 43% in 1986 to 41%
in 1995.6 This suggests that the demand for travel – by all modes – is largely
pervasive throughout the peak period.
• Markets for Different Modes. Current data indicate that the longer the trip, the
more likely it is to be made by auto. An analysis of the distribution of 1995
TRANS Origin-Destination survey by mode and by purpose yielded several
important findings. The analysis reflected PM peak period conditions, but its
trends generally were considered applicable to the PM peak hour. The findings
included:
• Shorter trips are more conducive to alternatives to the auto. The
analysis indicated that almost half of trips up to 1 km. in length were
made on foot (47%) and bicycle, as were about one-third (34%) of trips
between 1 and 2 km. long. Cycling captured at most 3% of trips, at
distances up to 5 km.
On a daily basis, trips by auto hadthe highest average distance, at 9.7
km., with transit trips slightly shorter at 9.5 km. Cycling trips averaged 4.2
km. in length, and walking trips had an average distance of 1.4 km.
• Walking and cycling shares were highest for the home-school commute.
This reflected both the proximity of many schools to students’ homes, and
the lack of an alternative for many students (notably, because they are
too young to drive).
• Transit shares are highest at moderate to longer distance trips; notably,
almost one-quarter (24%) of all trips between 15 and 20 km. In this
range, transit captured almost 30% of the home-work commute and two-
third (67%) of the home-school commute.
• The highest auto shares over all distances generally were for the home-
shopping, home-other and non-home-based trips, as well as for the
home-work commute over 2 km. This reflects in part the convenience of
the auto for shopping, for ‘other’ purposes such as medical appointments
6
Source: TRANS Committee, 1995 NCR OD Survey, Highlights of Demographic and Travel
Patterns, May 1997; Exhibit 3.18 (Distribution of Trips by Time of Day), p. 28.
6Abouhenidy, Kriger and Stephens – Development of Modal Share Targets for Ottawa’s Transportation Master Plan
Annual Conference of the Transportation Association of Canada September 2004
and for such non-home-based trips such as a job-related meeting outside
the normal workplace.
Other City tabulations from the same data indicate that:
• The large majority of daily cycling trips were less than 5 km. long, except
for the home-work trip, for which half (50%) were greater than 5 km.
• Virtually all daily walking trips were within 5 km., with upwards of 2/3
being within 2 km.
These tabulations help to identify appropriate markets for alternatives to driving
alone and, it follows, appropriate targets for these alternatives. For example,
although mixed used development may promote the localization of the home-
based trip to the dentist (a trip in which the auto could be left at home), the reality
is that many trips are linked to other purposes over longer distances, which may
mandate the use of the auto.
3. TRADITIONAL METHOD OF DEVELOPING TARGET SHARES
As noted, earlier TMPs applied target transit modal splits to strategic screenlines (i.e., to
the forecast volumes at these screenlines). Thus, transit targets were expressed in the
(former) Region of Ottawa-Carleton’s Official Plans at individual screenlines: for
example, the 1997 regional TMP cites a transit target of 30% of PM peak hour outbound
(northbound) trips across the Ottawa River screenline by 2021.
The screenline reference has been used for several years, locally and in cities around
the world: Screenlines provide a readily identifiable marker to monitor progress towards
the achievement of the targets. Annual screenline classification and occupancy (C&O)
counts can be compared, over time, with the targeted volumes.
The primary purpose of any transportation analysis undertaken as part of a master
planning exercise is to identify the future transportation system requirements necessary
to accommodate the growth in travel associated with the increase in population and
employment opportunities for the study area over a finite planning period. In the 1997
regional TMP, as with previous plans, the transportation analysis included the
application of the TRANS EMME/2 transportation model. The TRANS transportation
model is jointly maintained and updated by area planning agencies that have a history of
collaboration on transportation modeling and joint data collection efforts in the National
Capital Region. The TRANS model is a traditional four stage planning model (trip
generation, trip distribution, mode split and trip assignment) and future travel forecasts
are predominately influenced by the location and scale of future land use projections for
the region.
The TRANS model was used to provide a baseline forecast of travel (auto and transit)
based on an understanding of key growth assumptions associated with future urban
development patterns. However the travel forecast used as a basis for the 1997
Regional Master Plan included adjustments to the baseline forecast of the travel model,
particularly for the private auto travel. These adjustments to the demand model results
were conducted outside the model and were undertaken to account for several changes
7Abouhenidy, Kriger and Stephens – Development of Modal Share Targets for Ottawa’s Transportation Master Plan
Annual Conference of the Transportation Association of Canada September 2004
in travel behaviour. Primary changes in travel behaviour not considered to be
adequately reflected by the modelling framework were:
• Increased walking and cycling trips resulting from intensified land use patterns
and expansion of the cycling network (the TRANS model predicts travel based
predominately on travel characteristics associated with auto and transit
demands).
• Reduced overall PM peak hour travel demand resulting from the application of
transportation demand management (TDM) measures.
• Increased utilization of transit due to increased marketing efforts, improved
intermodal connections and other indirect efforts.
The approach used to include these changes in travel behaviour noted above has been
in the past referred to as a screenline approach. This approach and methodology
included detailing the travel demand (person trip travel) across each of the strategic
screenlines based on the results obtained from the planning model. A comprehensive
analysis of the demand (walking, cycle, transit and private auto) across each of the
strategic screenlines was then undertaken to determine and assess the impact of the
changes in travel behaviour noted above and consequently the level of adjustment to the
travel demand. These post-modelling adjustments were carried out on a spreadsheet to
ensure the various adjustments were documented in a systematic manner. The
adjustments to travel demand were carried out on a screenline by screenline basis with
the net result being a reduced level of auto travel demand across each of the strategic
travel corridors. The remaining steps in the transportation analysis were then to develop
the necessary infrastructure improvements to accommodate the associated level of auto
travel demand within each of the travel corridors.
Infrastructure requirements were consequently identified to service the adjusted auto
demand along key travel corridors.
4. WHY IS A NEW APPROACH NEEDED?
The screenline basis for modal share targets reflected an era in which the main levers
available to planning agencies to manage travel demand was through construction,
either of new roads or of transit services (e.g., the Transitway). Thus, achievement of
the target related directly to the supply of transportation at that screenline.
Today, the paucity of resources for transportation investments means that other ways
are needed to reduce or manage the number of drive-alone auto trips; notably,
measures that rely upon influencing driver behaviour at the origin or destination end of a
trip (e.g., through a work place ridesharing programme). It is recognized that these
measures may be applicable only to certain segments, or must vary among different
segments, of the travel market.
As a result, it is now recognized that a more encompassing approach is to develop
modal share targets that apply to the trip itself; i.e., to the origin- or destination-end of a
trip. The targets can vary by origin or destination, by mode or by trip purpose. A notable
example (detailed below) is the development of transit targets for the afternoon work-to-
8Abouhenidy, Kriger and Stephens – Development of Modal Share Targets for Ottawa’s Transportation Master Plan
Annual Conference of the Transportation Association of Canada September 2004
home, with different targets applied according to different densities of employment
concentrations. These targets are applied to the model-generated origin-destination trip
tables (matrix), which then are re-assigned to the road and transit networks in the model.
In this way, the strategic screenlines express the impacts of a target, rather than the
target itself. The O-D based targets also can be translated more meaningfully into
policies and actions that the public can understand directly: e.g., the transit share of
employees at low density suburban workplaces will be increased to n % by reducing the
supply of parking, subsidization of employer-supplied transit passes, etc.7 In other
words, the targets can be related directly to the actions and policies that would be used
to implement them; something that cannot be done through the existing, screenline-
based reference. The screenline reference continues to serve as a monitoring point,
against changes in the observed C&O counts over time. The screenlines also identify
the arterial road capacity that is required to serve the travelling public.
In sum, the basis for establishing targets was broadened to a trip-based approach, which
replaced the screenline-based approach that was used in previous TMPs. The
screenlines are retained as reference points, to illustrate the manifestation of the trip-
based targets and to identify future capacity requirements for infrastructure.
The new, trip-based approach is elaborated below.
5. DERIVATION OF FACTORS AND TARGETS
5.1 Approach
The approach was based upon the selection of factors for which target shares were to
be developed. These factors – all intended to be alternatives to the SOV - comprised:
• Transit
• Trip elimination (including telecommuting as well as trip avoidance)
• Time shifting (a deliberate shifting of trips from the peak hour to the peak
shoulders)
• Walking
• Cycling
• Ridesharing
These factors also had been considered in the (former) Region of Ottawa-Carleton’s
1997 TMP, with the key difference being that a single combined target for TDM and trip
elimination was assumed in lieu of explicit targets for trip elimination, time shifting,
walking, cycling and ridesharing.
In addition to providing an explicit application of targets for each individual factor, the
breakdown used in the 2003 TMP allows the development of targets for specific trip
lengths (i.e., origin-destination pairs) and by trip purpose (i.e., differentiating between
7
This is a hypothetical example, used here for illustration only. The derivation of policies and
actions is (and properly should be) conducted separately from and subsequent to this
analysis, and is beyond the scope of this analysis.
9Abouhenidy, Kriger and Stephens – Development of Modal Share Targets for Ottawa’s Transportation Master Plan
Annual Conference of the Transportation Association of Canada September 2004
work and non-work trips). The distinction by trip length takes into account the distances
over which alternatives to the SOV trip were competitive, as derived from Table 2 above.
The breakdown by work and non-work purposes reflects the fact that alternatives to
driving alone are more attractive for the regular work commute whereas reasonable
alternatives to auto travel tend to be significantly less attractive for non-work trips.
Accordingly, the following discussion is presented along these lines. The discussion
begins with the development of transit targets, since transit is the primary alternative to
the SOV trip. Transit targets for the work (commute) trip are described first, followed by
the non-work transit targets. Finally, the development of the targets for the other factors
is described.
As noted, these factors all represent alternatives to driving alone. It is important to note
that they complement each other: they must work in tandem in order to achieve the
desired result of reducing the number of automobiles on the roads. Distinguishing them
in this analysis provided a more complete, and necessary, understanding of their
dynamics.
5.2 Derivation of Transit Targets
5.2.1 Proportion of Work Trips
The City’s base 2021 forecasts projected that 33% of PM peak hour trips were for the
work-to-home commute, known as “home-based-work” (HBW) trips in the EMME/2
model. The comparative proportion of HBW trips in the 1995 TRANS Origin-Destination
Survey was 32%, indicating that the proportion is projected to be stable over time.
The proportion of work trips is actually larger, since linked trips also occur; i.e., HBW
trips describe only the direct work-to-home trip. Many commutes also have an
intermediate stop between work and home (for example, to shop, for personal business
[banking, doctor’s appointment, etc.] and so on). Each leg is modelled as a separate trip
purpose, and cannot easily be combined to show the linkages. For example, an
intermediate stop at a store would be recorded as non-home-based or NHB trip (work-to-
store), then home-based-shopping (store-to-home).
The 1995 TRANS Origin-Destination Survey indicated that about half the PM peak hour
NHB trips were part of the home-to-work chain. The City’s base 2021 forecast projected
that NHB trips represented 27% of the PM peak hour trips, yielding a total proportion of
47% (33% + ½ * 27%) of trips related to the work-to-home commute. These trips – i.e.,
the combination of HBW and half the NHB trips – are defined as “work” trips. The
remaining 53% represent “non-work” trips.
5.2.2 Categorization of HBW Transit Modal Splits by Employment Zone
The next step was to identify transit targets from the work-based origin; that is, reflecting
the most likely end of the trip at which commuters could be influenced to use transit.
Previous work demonstrated that proximity of the workplace to the Transitway (i.e., to
rapid transit) is a significant indicator of transit use: i.e., commuters wanted to be able to
take a bus within steps of their work place.8
8
Source: TRANS EMME/2 Model Development Study, TRANS Committee, 1992.
10Abouhenidy, Kriger and Stephens – Development of Modal Share Targets for Ottawa’s Transportation Master Plan
Annual Conference of the Transportation Association of Canada September 2004
Next, a review of the observed (surveyed) 1995 trip origins and the forecast (2021) trip
origins indicated that the transit modal split varied according to the density of
employment (jobs / km2). Five categories were developed:
1. 0 to 2,500 jobs / km2 (low density; in primarily residential areas).
2. 2,500 to 5,000 jobs / km2 (medium density; mainly mature industrial and
business parks).
3. 5,000 to 20,000 jobs / km2 (high density, such as new town centres, shopping
centres and business parks).
4. 20,000+ jobs / km2 (single use special generators such as hospitals, outside the
Central Business District [CBD]).
5. 20,000+ jobs / km2 (the Central Business District).
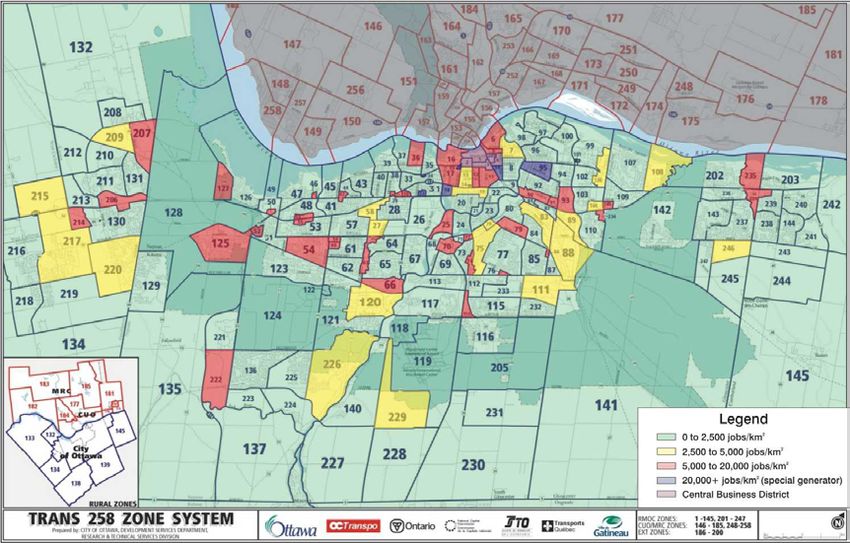
Figure 3 graphically illustrates the various employment densities that were assumed to
be achievable throughout the City by 2021. The figure is based upon the TRANS
EMME/2 model’s 258 zone system.9 However, it should be noted that densities were
calculated only according to the actual area occupied by the employment development
(i.e., if only 30% of a zone’s area contained office buildings, then the zone’s density was
based upon that area alone).
Figure 3. 2021 Employment Densities by Traffic Zone
Table 2 summarizes the observed 1995 transit modal splits (PM peak hour trips
originating) from all traffic zones in the City of Ottawa. The table summarizes the transit
splits for all trips (all trip purposes combined) and for HBW trips, assigning each zone by
9
The TRANS model covers the entire National Capital Region, including the City of Gatineau,
Québec. However, this analysis considered only the 192 zones that are in the City of Ottawa.
11Abouhenidy, Kriger and Stephens – Development of Modal Share Targets for Ottawa’s Transportation Master Plan
Annual Conference of the Transportation Association of Canada September 2004
five categories of employment density and whether or not the zone’s employment
“massing” is oriented to rapid transit (i.e., is “within a 400 metre walking distance of a
station, as designated by “on RT [rapid transit]).
Categories of Zones by
1995 Total Trips 1995 HBW Trips
Employment Density
Off RT On RT Off RT On RT
1. Low density 5% 9% 10% 16%
2. Medium density 7% 10% 13% 23%
3. High density 13% 18% 18% 29%
4. Special generator 13% 32% 0% 24%
5. Central Business District N/A 38% N/A 52%
Total, all City of Ottawa
17% 23%
zones
Table 2. Transit Modal Splits by Employment Density – 1995
Source: 1995 TRANS O-D Survey
Figure 4 plots these modal splits, along with those projected for the 2021 base
conditions (i.e., forecast travel behaviour, without factors or targets being applied). For
both the observed 1995 and forecast 2021 conditions, the figure demonstrates a general
increase in transit modal splits:
• From low density (category 1) to CBD (category 5).
• From “off” rapid transit to “on” rapid transit.
• From 1995 to 2021 (with the RTES network in place).
• For work trips (work-to-home) versus all trips.
Aggregate Transit Modal Splits by Zone Type
80% 2021 HBW (On)
70% 2021 HBW (Off)
60%
2021 Total (On)
% Transit
50%
40% 2021 Total (Off)
30% 1995 HBW (On)
20%
10% 1995 HBW (Off)
0% 1995 Total (On)
1 2 3 4 5
1995 Total (Off)
Zone Type
Figure 4. Trends in Transit Modal Splits by Employment Density
– 1995 Observed and 2021 Base Forecast
12Abouhenidy, Kriger and Stephens – Development of Modal Share Targets for Ottawa’s Transportation Master Plan
Annual Conference of the Transportation Association of Canada September 2004
5.2.3 Development of “Work” and “Non-Work” Transit Targets
Application of “ambitious but realistic” transit targets to all 2021 “work” trips (HBW plus
half the NHB trips) resulted in the “work” trip transit modal splits for the different
categories that are summarized in Table 3.10 The table lists the base transit modal splits
and the modal splits that were achieved with the targets (i.e., what was actually achieved
over individual zones when the City applied the average targets to its forecasting model).
The consultant and the City worked together to derive the average targets, using the
aforementioned 1995 and 2021 bases as a guide. It should be noted that the transit
modal splits for any given origin-destination pair were limited to an assumed practical
maximum of 85%.
2021 “Work”
Categories of Zones 2021 base
trips achieved
by Employment “Work” trips
with target
Density
Off RT On RT Off RT On RT
1. Low density 16% 16% 28% 33%
2. Medium density 16% 16% 32% 39%
3. High density 27% 29% 37% 47%
4. Special generator 45% 62% 57% 68%
5. CBD N/A 75% N/A 77%
Table 3. 2021 “Work” Transit Modal Splits by Employment Density
Source: City of Ottawa, TRANS model forecasts
A similar process was applied to the non-work trips. The resultant base transit modal
splits and the splits achieved with the targets are summarized in Table 4. Overall, the
application of the targets yielded a transit modal split of 28% during the PM peak hour in
2021.
2021 “Non-
2021 base
Categories of Zones work” trips
“Non-work”
by Employment achieved with
trips
Density target
Off RT On RT Off RT On RT
1. Low density 13% 12% 15% 25%
2. Medium density 12% 11% 15% 25%
3. High density 22% 16% 15% 24%
4. Special generator 12% 30% 15% 25%
5. CBD N/A 12% N/A 24%
Table 4. 2021 “Non-Work” Transit Modal Splits by Employment Density
Source: City of Ottawa, TRANS model forecasts
10
The targets were derived through several iterative refinements. The targets were “ambitious”
since they correspond with the ambitious overall target of effectively doubling the current 17%
transit share to 30%; and they are “realistic” in that the targets could be differentiated
according to the different work trip market segments (i.e., the employment density categories
and the proximity to rapid transit).
13Abouhenidy, Kriger and Stephens – Development of Modal Share Targets for Ottawa’s Transportation Master Plan
Annual Conference of the Transportation Association of Canada September 2004
5.3 Non-Transit Targets
Table 5 summarizes the values and targets for the factors that were used in this
analysis. It includes a description of how the factors were applied, the selected factor
values, a discussion of their derivation and background information and data. For
comparison, the table also describes how (and if) the factor was used in the 1997
Region of Ottawa-Carleton TMP.
As noted, the 1997 TMP used a single factor to account for such TDM initiatives as
ridesharing, flexible working hours and so on. However, the term “TDM” has been used
in the literature to represent different measures, depending upon the perspective. As a
result, the impact on travel varies. Also, although several measures frequently are
brought together as part of a TDM package, the individual impacts of each constituent
measure often cannot be isolated.
Given these variances, and given the definitional problems with the available
information, for the purposes of this analysis it was agreed to identify and isolate specific
“non-transit” factors: the broader term gets around definitional issues that are
associated with TDM. This also allowed greater precision in estimating the impacts, to
account for origin-destination, purpose, mode and trip length. Accordingly, as
summarized in Table 6, factors were estimated for trip elimination, walking, cycling,
ridesharing and time shifting.
5.4 Accounting for Changes in Economic Conditions
It is important to note another adjustment that was made to the base horizon year
forecasts. The TRANS model was calibrated according to 1995 socio-economic
conditions. City staff determined that the forecasts of PM peak hour travel may be
under-estimated, for three reasons:
• The TRANS model was calibrated to 1995 travel conditions, which reflected
recessionary economic conditions. (This is partially supported by an observed dip in
peak hour traffic volumes despite significant population growth during the same
period across the four strategic screenlines in 1994, 1995 and 1996 [i.e., compared
with previous years]; however, this trend was not pervasive.)
• The ratio of jobs-per-person (for the age groups 20-64 years) is expected to grow by
about16% between 1996 and 2021 (from 0.77 to 0.89). This suggests a
commensurate increase in work-related travel. However, the base forecasts did not
account for these increases (i.e., this must be considered exogenously to the model
structure).
• Related to the jobs-per-person ratio, the labour force participation rate also is
projected to increase. However, the base forecasts do not account for these
increases (again, this must be considered exogenously to the model structure).
14Abouhenidy, Kriger and Stephens – Development of Modal Share Targets for Ottawa’s Transportation Master Plan
Annual Conference of the Transportation Association of Canada September 2004
Factor Description / Target Equivalent in 1997 Region of
Ottawa-Carleton TMP
TDM Not used. Targets for specific TDM components used Single target (4%) applied to all
instead (time shifting, walking, cycling and PPV screenlines. Target included trip
[ridesharing]). elimination and TDM (combined).
Trip • Represents trips eliminated through teleworking or Not used explicitly. Included with
elimination home-based work. TDM target.
• Target: 8% (represents increase of 3% over 5%
existing [estimate]).
• Assumed to apply equally to all modes for work-
based trips.
• Source: Available data are sparse (meaning
forecasting is difficult), but observations from the
Census of Canada “worked at home” data, opinion
surveys, and telecommuting data from local
industries and from the US Census provide some
indication.
• Note: available definitions of what constitutes ‘trip
elimination’ are ambiguous.
Time • Represents peak hour auto driver trips shifted to the Not used.
shifting peak shoulders, through outreach (education /
awareness) programmes and additional promotion
of flexible work hours. This is over and above the
current trend to peak spreading.
• Target: 1% (assumed; no conclusive data
regarding a specific rate).
• Applies to all O-Ds and all trip purposes.
Walking • Represents measures to encourage walking (e.g., Walking considered in the 1997
more sidewalks, suitable lighting, etc.), as well as TMP, but no region-wide target
auto disincentives (e.g., parking measures). specified.
• Target: 50% reduction in auto driver trips for
distances equivalent to the average walking trip –
i.e., ≤ 1.5 km. in 1995 (see Table 2).
• Applies to all trip purposes.
Cycling • Represents measures to encourage bicycling (e.g., Cycling considered in the 1997
more bicycle paths, safe delineation of bicycle lanes TMP, but no region-wide target
on roads, etc.). specified.
• Target: 10% reduction in auto driver trips for
distances equivalent to the average cycling trip –
i.e., ≤ 4.5 km. in 1995 (see Table 2).
• Applies to all trip purposes.
Ridesharing • Represents measures at the work place and other Single target (1.27 persons per
supportive measures to encourage ridesharing, vehicle) applied to all
over and above transit, walking, cycling and related screenlines, based upon
measures. observed screenline count data.
• Target: 1.5% reduction in auto driver trips, for all
trip lengths (all O-Ds).
• Derived from the 3% observed maximum attained
at medium-density, single employer sites in Ottawa;
discounted by half to allow for the likely smaller
participation at low-density, multi-employer sites.
• Applies to all work sites, i.e. to all work-to-home
trips.
Table 5. List of Non-Transit Factors
15Abouhenidy, Kriger and Stephens – Development of Modal Share Targets for Ottawa’s Transportation Master Plan
Annual Conference of the Transportation Association of Canada September 2004
The implication is that the forecast demands could represent the lower end of the range,
assuming that the projected population and employment materialize.
Accordingly, a correction factor of +12% (three-quarters of the expected 16% increase in
the jobs-per-person ratio11) was applied to better reflect the activity of employed persons
in the work force and to ensure, in turn, that trip generation rates could be applied to the
planning horizon. There was a corresponding increase of 12% in the number of work
trips.
6. DISCUSSION AND CONCLUSIONS
Several points can be made concerning the new approach:
• The new approach, with its focus on the trip (origin-destination and purpose),
provides an explicit and direct link between the analysis of future demand and
the resultant actions, plans and policies in the TMP.
• It thus makes more apparent the existing link between the forecasting process
(the technical input to the TMP) and the content of the TMP (the public output of
the TMP). In turn, this can only benefit the public and political debate that is an
integral part in the development and adaptation of a transportation master plan
and, it follows, further help residents and businesses understand the importance
of ‘doing their part’ to achieve the TMP’s goals (e.g., to use transit more often, to
walk, cycle or rideshare more often, etc.).
• The new approach also allows the tailoring of TMP actions, policies and plans to
specific ‘markets,’ expressed both in terms of trip distance and purpose (work
and non-work). This is an important consideration in maximizing the cost-
efficiency of proposed actions, policies and plans. The explicit treatment of work
trips by employment density provides a direct linkage to land use policy and to
future site development decisions and policies within the framework of the City’s
Official Plan (of which the TMP is part).
• Finally, the new approach, with its inclusion of several alternatives to the SOV
trip, provides a framework for considering systematically and explicitly both ‘hard’
capital-intensive solutions (road and transit infrastructure) and ‘soft’ inexpensive
solutions (such as walking, cycling, telecommuting, etc.).
• The reader may find the transit work and non-work targets to be ambitious.
However, it is important to note that:
• the targets were aimed at achieving the 30% overall share that City
Council had already designated as an objective;
• the process (the subject of this paper) is independent of the overall
targets, in any event; and
11
That is, the full 16% value was not applied, because some home-to-work trips occur outside the
PM peak hour.
16Abouhenidy, Kriger and Stephens – Development of Modal Share Targets for Ottawa’s Transportation Master Plan
Annual Conference of the Transportation Association of Canada September 2004
• using the old screenline method would have resulted in the development
of non-transparent factors to achieve the 30% overall share.
In conclusion, the new process described in this paper for developing modal share
targets provides a more holistic, multi-modal and systematic framework for responding to
today’s transportation planning needs. It makes the best use of available tools (notably,
the travel demand forecasting model), with selected interventions. By using existing
observations (O-D survey) to differentiate existing and potential markets, especially
through the categorization of work trip modal shares by employment density, the new
process provides improved input to the public and political deliberation of a city’s
transportation master plan.
Further refinements to the approach are both possible and desirable. Potential
improvements include:
• The incorporation of more up-to-date data for a future TMP would be helpful, to
bring the available information up-to-date, fill in gaps and provide a more
complete understanding of how travellers will behave in certain situations. A new
TRANS origin-destination survey is proposed for 2005. Better data on
experiences elsewhere regarding telecommuting, trip shifting, ridesharing,
walking and cycling rates also would provide further insight; as would before-and-
after observations of modal shifts for these non-transit alternatives to the SOV
trip as the TMP is implemented over time. These data would provide improved
estimates of the individual and complementary impacts of specific measures.
• These data also could be used to calibrate new multi-modal models, expanding
the existing auto driver, auto passenger and transit logit modal split model (i.e., in
order to estimate the shares of the other modes directly within the model).
• In the meantime, further analysis of existing data sources (the 1995 TRANS OD
survey, traffic count trends and demographic and socio-economic trends) would
greatly improve the basic understanding of different travel market segments.
7. ACKNOWLEDGEMENTS
The work described in this paper is based upon the report Strategic Analysis of Travel
Demand, prepared for the City of Ottawa in July 2003 by Delcan Corporation and
iTRANS Consulting Inc. Mona Abouhenidy, PhD., served as the City of Ottawa’s project
manager, and David Kriger of iTRANS served as the consultant project manager.
Appreciation must be expressed to those who contributed to or commented on the
aforementioned report: Mohammed Tayyaran, PhD., of the City of Ottawa; the City’s
consultant advisors, David (Harry) Beere and Geoff Noxon; and, Jason Jardine and
Brendan Reid of Delcan Corporation.
The views expressed in this paper are those of the authors, and do not necessarily
reflect those of the City of Ottawa or its consultants.
17You can also read