Transport Modelling Report for UFTI - Creative people together transforming our world
←
→
Page content transcription
If your browser does not render page correctly, please read the page content below
Sensitivity: General

    Transport Modelling Report for UFTI

    Prepared for Urban Form and Transport Initiative

    Prepared by Beca Limited

    22 June 2020

                               Creative people together transforming our world
| TTSM modelling for UFTI |

Contents

Executive Summary ................................................................................................ 1
1    Introduction ........................................................................................................ 4
     1.1    Modelling System ............................................................................................................................ 4
     1.2    Modelling Approach ......................................................................................................................... 5

2    Tranche 1 Modelling .......................................................................................... 6
     2.1    Inputs/Assumptions ......................................................................................................................... 6
     2.2    Tranche 1 Workshop ....................................................................................................................... 6

3    Tranche 2 Modelling .......................................................................................... 7
     3.1    Model Inputs .................................................................................................................................... 7
     3.2    Model Assumptions ....................................................................................................................... 18
     3.3    Other Model Processes ................................................................................................................. 18
     3.4    Model Results ................................................................................................................................ 21

4    Tranche 3 Modelling ........................................................................................ 33
     4.1    Model Inputs .................................................................................................................................. 33
     4.2    Model Results ................................................................................................................................ 43
     4.3    Scenario Tests ............................................................................................................................... 51
     4.4    Tranche 3 Summary ...................................................................................................................... 55

Appendices

Appendix A – Tranche 1 - UFTI-30 year modelling results
Appendix B – Tranche 2 Round 1 Modelling
Appendix C – PT Mode Share - Tranche 2 Round 2
Appendix D – Daily PT - Tranche 2 Round 2
Appendix E – LOS Plots - Tranche 2 Round 2
Appendix F – Sensitivity Test Results – Tranche 3
Appendix G – Harini Future Proof Option by BBO
Appendix H – PT Mode Share – Tranche 3
Appendix I – Daily PT Plots – Tranche 3
Appendix J – LOS Plots – Tranche 3
Appendix K – PT Mode Share (Scenario Tests) – Tranche 3
Appendix L – Other Model Outputs (Scenario Tests) – Tranche 3

                                                                                           Transport Modelling for UFTI | 3821668-86155425-17 | 22 June 2020 | i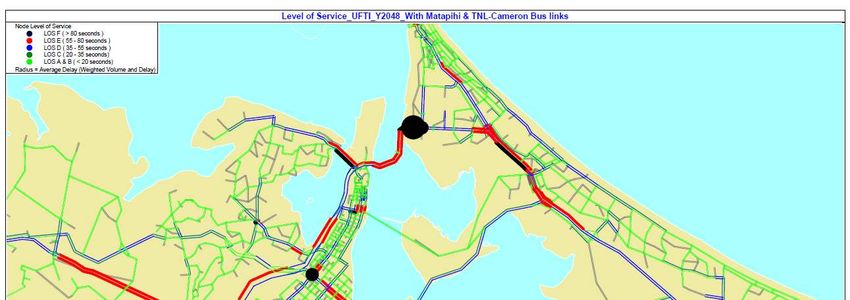
Revision History
 Revision Nº              Prepared By                                      Description                                                            Date
 1.0                      Subramanyam Uppuluri                             First Draft for comment                                                8 May 2020

 2.0                      Subramanyam Uppuluri                             Tranche 3 Draft for comment                                            18 June 2020

 3.0                      Subramanyam Uppuluri                             Final                                                                  22 June 2020

Document Acceptance
 Action                   Name                                             Signed                                                                 Date
 Prepared by              Subramanyam Uppuluri                                                                                                    22 June 2020
 Reviewed by              Nyan Aung Lin                                                                                                           22 June 2020
 Approved by              Andrew Murray                                                                                                           22 June 2020
 on behalf of             Beca Limited

© Beca 2020 (unless Beca has expressly agreed otherwise with the Client in writing).

This report has been prepared by Beca on the specific instructions of our Client. It is solely for our Client’s use for the purpose for which it is intended in accordance
with the agreed scope of work. Any use or reliance by any person contrary to the above, to which Beca has not given its prior written consent, is at that person's own
risk.

                                                                                                         TTSM modelling for UFTI | 3821668-86155425-17 | 22 June 2020 | ii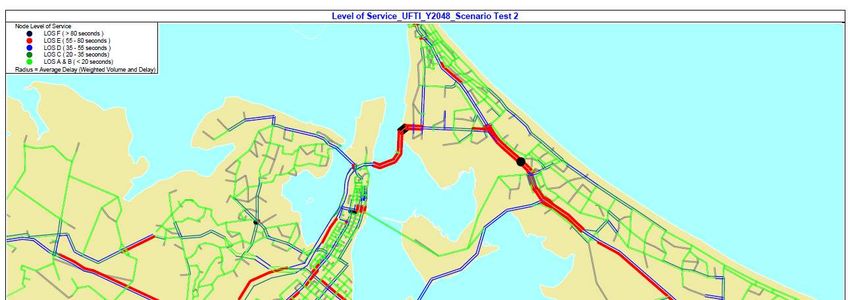
| Executive Summary |
Executive Summary
This report documents the transport modelling undertaken to inform the Urban Form and Transport Initiative
(UFTI) Programme Business Case (PBC). The modelling was overseen by the UFTI Modelling Oversight
Group and implemented by a technical modelling team comprising the model owners, operators and
independent reviewers.
Modelling was undertaken for all scenarios in the regional Tauranga Transport Strategic Model (TTSM) and
the Tauranga Cycle Model (TCM). The modelling evolved through a number of iterations as assumptions
and inputs were refined by both the UFTI team (in terms of scenario inputs and assumptions) and the
modelling team (in regard to specific technical operation of the model). In addition to an independent review
of the modelling approach, this work also included an independent audit of the model inputs and workings.
This report is intended as a factual record of the modelling undertaken, rather than the detailed interpretation
of the results and comparative analysis of preferred options, which is undertaken by the UFTI team.
The study involves comparative analysis of the likely transport system outcomes for a series of alternative
land use and transport scenarios. The long-range nature of this work meant that the analysis and outcomes
were focussed at strategic-level outputs, rather than detailed local results. It is noted that such a long-term
nature of testing inherently comes with uncertainties especially model inputs and behavioural parameters.
Therefore, the focus of the longer-term modelling was more on the relative performance of the scenarios
than on absolute predictions.
The modelling scenarios specified by UFTI for initial (Tranche 1 and 2) modelling are:
● Year 2048
– This is a 30-year scenario with a 270,000 population and reflects settlement patterns already agreed
between the study partners
● Year 2070+
– This involves modelling of the following four long-term (i.e. 50-70 years) land use scenarios with
different spatial allocations of a 400,000 population:
Rail Enabled Growth
Connected Urban Villages
Two Urban Centres
Dispersed Growth
Subsequently, Tranche 3 modelling was undertaken for the following UFTI emerging preferred scenarios:
● Year 2048
– This scenario is similar to Tranche 2 modelling, but with updated land use and public transport
services
● Year 2070+
– This involves modelling of the emerging-preferred Scenario 5 (i.e. 50-70 years) land use scenario with
spatial allocations of a 400,000 population. Most of the transport network assumptions are from
Tranche 2 Connected Urban Village scenario, but with updated public transport services and changes
to support the new land use pattern.
A common set of future transport network assumptions were used as the starting point for each scenario,
from which UFTI specified additional interventions specific to each scenario. These assumptions and inputs
to the modelling were refined in each Tranche. The final Tranche 3 inputs and assumptions are provided in
Section 4.1.
The key modelling outputs are summarised below:
Transport modelling for UFTI | 3821668-86155425-17 | | 22 June 2020 | 1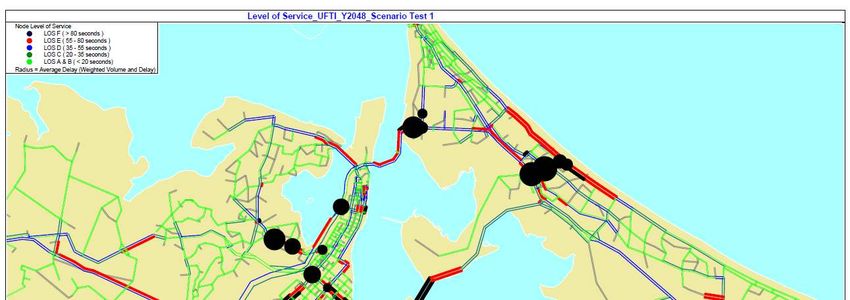
| Executive Summary |

●   Regional Trip Summary: the report provides the AM peak regional trip summaries for cycle, PT and car.
    In Tranche 3, cycle and PT trips increased significantly in 2048 and 2070+ (compared to 2018), however
    cars are still the predominant mode (Figure 4-10). For 2070+; PT trips in Scenario 5 were slightly higher
    (~2.5%) than the previous CUV scenario in Tranche 2 due to the presence of the rail network.
●   Sector to Sector Mechanised Mode Shares: Mechanised PT mode share is provided using a 33-sector
    system. Tranche 3 PT mode share (by origin sector) are provided in Table 4-6, and origin sector to CBD
    sector mode share are provided in Table 4-7.
●   Daily PT Plots: Tranche 3 daily PT plots are provided in Appendix H. In the 2070+ scenario, Cameron
    Road (north of 15th Avenue intersection) is predicted to have some 14,000 daily PT trips (1,700 daily PT
    trips in the year 2018).
●   Total Network Vehicle Statistics: This includes key statistics such as vehicle kilometres travelled (VKT)
    and vehicle hours travelled (VHT). Tranche 3 vehicle statistics are provided in Table 4-8 and Table 4-9.
    For 2070+, VKT and VHT growth in Scenario 5 are 38% and 50%, respectively, compared to 2048. This
    is higher than previous CUV scenarios (33% and 47%).
●   Accessibility to Employment by Car and PT: This measure calculates the percentage of jobs that are
    accessible by traffic and PT within certain travel times. In this study, a 30-minute travel time threshold
    was used for traffic and 45-minute threshold for PT. In Tranche 3 (Table 4-10), car accessibility increases
    from 2018 to 2048, then reduces in 2070+. PT accessibility is significantly improved from 2018 to 2048
    (22% to 47%) and it further improves in 2070+ (58%).
●   Vehicle Emissions: NZ Transport Agency’s VEPM version 6 (released in July 2019) was adopted for this
    study. Tranche 3 emission statistics are provided in Table 4-11 and Table 4-12. Some 60% reduction in
    CO2 is predicted between 2018 and 2048, which is mainly attributed to reduced rates due to changes in
    vehicle fleet composition between the two years.
●   Vehicle Crash Costs: Total crash costs increased in future years due to increase in travel; however,
    crash cost per person reduced. Crash costs were calculated at a region-wide high level and it does not
    capture location specific safely improvements. Tranche 3 scenario crash costs are provided in Figure
    4-12.
●   Vehicle Levels of Service (LOS): LOS plots are useful to understand the locations and severity of traffic
    congestion in the network. LOS plots are for general traffic performance and they do not represent
    performance on priority lanes (e.g. bus, freight or HOV). Tranche 3 LOS plots are provided in Figure
    4-13, Figure 4-14 and Appendix I.
Other general findings and recommendations from the modelling are summarised below:

Land Use:
● The location of long-term growth impacts transport outcomes, including public transport mode share,
  congestion, uptake of cycling, travel costs, vehicle crash costs and emissions
● New development close to the central employment and service areas, such as Matapihi, Mt Maunganui
  and Otumotei are predicted to have higher cycling uptake and reduced vehicle travel
● Areas from the centre have high PT mode share potential, where high-quality and reliable services are
  provided
● The location of employment impacts travel outcomes, particularly in terms of the amount of travel and
  travel costs. There can be a trade-off between centralising employment to enhance employment density
  and viability of public transport, against dispersing employment and services to more remote centres to
  reduce the need for travel from those areas
Transport Interventions:

●   In the shorter-term (2048), the proposed bus-links to Matapihi and 15th Avenue offer significant
    opportunities for attractive and reliable PT services. The Matapihi corridor is attractive due to its direct
    access to the city centre, and it being more direct than the car mode. The TNL-15th Avenue Link utilizes

                                                                  Transport modelling for UFTI | 3821668-86155425-17 | | 22 June 2020 | 2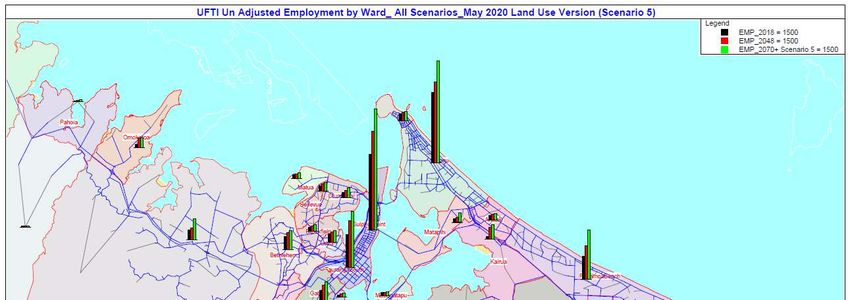
| Executive Summary |

    exclusive corridor; however, its function is highly inter-related with the service patterns for the whole
    northern corridor.
●   Rail can significantly contribute to PT patronage, especially from semi-fringe city areas such as Te Puna,
    Bethlehem and Te Puke. The inner-city patronage was found to be more dependent on parallel (and
    potentially competing) bus services, such as on Chapel Street. The rail patronage is however dependent
    on high-density land use around stations, as well as cycling, bus and park-and-ride access to the wider
    catchments of each station
●   The 2048 scenarios have peak-period congestion on most commuter routes, but with only a limited
    number of locations with more extreme congestion (LoS F). Additional interventions were tested that had
    the potential to address those locations. However, the increased road capacity in some corridors (such
    as Hewletts Road), in turn induced more traffic to the corridor, which generated new congestion spots. A
    demand-management response of applying a toll on the existing Harbour Bridge was found to be
    successful in mitigating that induced demand. Although an important part of that scenario, the tolling of
    the existing road for demand management purposes would likely require a change in the current
    legislation to achieve
●   The longer-term (2070+) models showed more significant locations of road congestion. The tests allowed
    relative comparison of the different scenarios; however, it was not attempted to provide sufficient road
    capacity to address the locations of high congestion
●   A scenario that included the forecast growth but without the identified transport system upgrades showed
    very poor transport outcomes, with significant congestion, very high travel costs and limited travel options
●   Although the PT mode share (mechanised) appears relatively modest when measured across all
    movements in the modelled sub-region, it is predicted to have high modal shares for key movements and
    corridors. For example, Te Tumu to the CBD was predicted to have morning peak shares of some 60%

Policy Interventions:
●   Policy interventions, such as extended and increased central-area parking were found to be critical to
    increasing mode share

Other Outcomes:

● Vehicle emissions were found to be influenced by the amount of travel (VKT), the speed of travel and the
  vehicle fleet composition in the forecast years. The different scenarios showed differences based on the
  mode share and length of travel. The assumed future fleet composition was however influential,
  suggesting lower rates in future years than current day, even with significant growth in people and total
  vehicle travel
● Total vehicle crash costs were found to be a function of the amount of travel and the type of road and
  speed travelled on. This gave mixed outcomes with outer areas having more travel but often on safer
  roads such as motorways.
● PT Accessibility to employment opportunities is predicted to significantly improve over the current 2018
  base. It also various by land use scenario, increasing where growth is located within close proximity to
  the major centres

                                                                 Transport modelling for UFTI | 3821668-86155425-17 | | 22 June 2020 | 3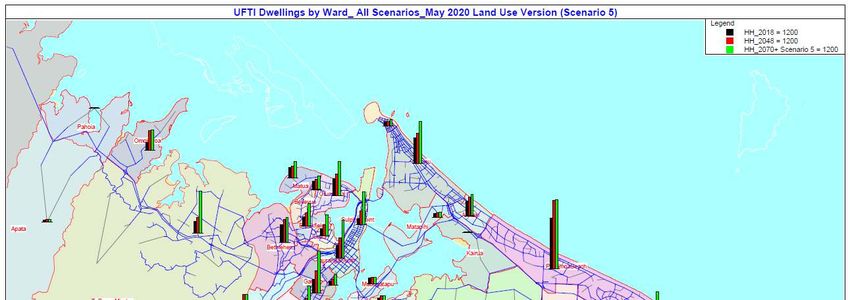
| Introduction |
1 Introduction
The Urban Form and Transport Initiative (UFTI) has engaged Beca to provide transport modelling services to
support the UFTI Programme Business Case (PBC). This is an investigation of alternative long-term land
use and transport scenarios therefore it is focused on strategic-level outcomes and measures, rather than
detailed local issues.
The UFTI modelling scenarios for initial (Tranche 1 and 2) modelling are:
● Year 2048
– This is a 30-year scenario with a 270,000 population and reflects settlement patterns already agreed
between the study partners
● Year 2070+
– This involves modelling of the following four long-term (i.e. 50-70 years) land use scenarios with
different spatial allocations of a 400,000 population:
Rail Enabled Growth
Connected Urban Villages
Two Urban Centres
Dispersed Growth
Subsequently Tranche 3 modelling was undertaken for the following UFTI preferred scenarios:
● Year 2048
– This scenario is similar to Tranche 2 modelling, but with updated land use and Programme 8.4 PT
plan
● Year 2070+
– This involves modelling of the preferred Scenario 5 (i.e. 50-70 years) land use scenario with spatial
allocations of a 400,000 population. Most of the network assumptions were retained from Tranche 2
Connected Urban Village scenario, but with updated public transport services and changes to support
the new land use pattern.
Modelling was undertaken for all scenarios in the regional Tauranga Transport Strategic Model (TTSM). The
study has evolved through a number of iterations as assumptions and inputs were refined.
1.1 Modelling System
The transport modelling system for the Western Bay sub-region contains three linked models as described
below and shown graphically in Figure 1-1.
TTSM: The strategic demand model that predicts car, truck and PT travel directly from land use
inputs
TTHM: An operational traffic model that represents the road network in more detail than in the
strategic model
TCM: The sub-regional cycle model that estimates cycle demands from the strategic model travel
patterns and from assumed cycle interventions
These models are linked but can be operated independently with fixed inputs. The TTSM was the primary
tool used for this study due to its direct response to alternative land use scenarios.
Transport modelling for UFTI | 3821668-86155425-17 | | 22 June 2020 | 4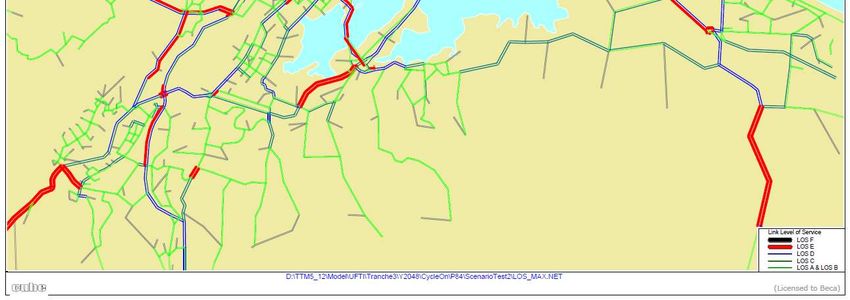
| Introduction |

Figure 1-1:Tauranga Transport Models

1.2 Modelling Approach
The UFTI modelling work was directed by a Modelling Oversight Group1 and undertaken across three
tranches, as outlined below:
a. Tranche 1 – Confirming Land Use and Initial Scenario Tests
b. Tranche 2 - Various Interventions (General Vehicle and PT). Tranche 2 was undertaken in two
   rounds. Round 1 modelling provides initial results of the 2048 and all 2070+ scenarios. Round 2
   modelling was undertaken with the refined inputs from Round 1 and additional modelling processes for
   detailed model outcomes.
c. Tranche 3 – Preferred Scenario Testing and Documentation. Tranche 3 was undertaken for 2048 and
   the preferred network for 2070+ Scenario 5 with the refined inputs and additional modelling processes for
   detailed model outcomes.

The key land use inputs and transport assumptions were provided by the UFTI team and with detailed
technical issues agreed by the technical modelling team. The modelling team included the model owners,
those operating the models and independent peer reviewers (strategic and detailed model audit).

The UFTI team requested analysis of a potential 400,000 population scenario for the sub-region. Given the
uncertainty in long-term growth rates, a specific forecast year for this scenario was not identified. It was
therefore referred to as the 2070+ year scenario.
The modelling team have noted the uncertainties inherent in such long-range predictions. Such long-range
forecasts are rare and result in large uncertainties/risk in the predictions. The key uncertainties include:
●     Accuracy of the land use inputs
●     Accuracy of the form of assumed new transport interventions
●     Uncertainty in status of continuation of policies related to operation of the network and in land use
      planning
●     Uncertainty in the continuation of current travel behaviour into the future, as reflected through trip making,
      length and mode choice perceptions and responses
●     Uncertainty around continuation of existing modes and technologies

1
    Model Oversight Group includes TCC, WBOP, NZTA, BOPRC.

                                                                    Transport modelling for UFTI | 3821668-86155425-17 | | 22 June 2020 | 5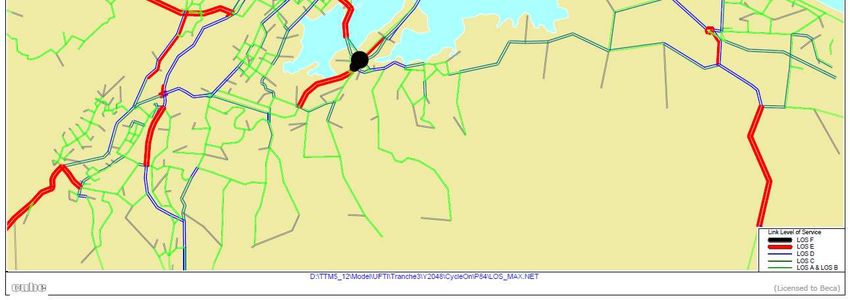
| Tranche 1 Modelling |

Due to these noted uncertainties the study has focused on the relative performance and key trends of the
scenarios, rather than specific absolute outcomes.

The key inputs and outcomes were presented to the UFTI team through various workshops for each
Tranche, which helped further refine the inputs for the refined testing. This report describes the inputs,
assumptions and analysis of results from the Tranche 1, 2 and 3 modelling.

2        Tranche 1 Modelling
Although most of the modelling was undertaken in Tranche 2 and Tranche 3, a brief summary of the Tranche
1 modelling is included for completeness.

2.1 Inputs/Assumptions
2.1.1 Network

For Tranche 1, it was agreed the use of the Programme 8.1 (P8.1) traffic and PT network plan for the model
year 2048. Programme 8.1 network assumptions are documented in “TTSM Programme 8.1 Draft Initial
Findings” document prepared by Beca in July 2019.

During the Programme 8.1 study, 2031and 2063 future year PT services and frequencies were developed.
For the UFTI 2048 scenario, the PT services were assumed to be the same as in the previous 2031
Programme 8.1, but with a frequency halfway between the 2031 and 2063 frequencies.

2.1.2 Assumptions

Other model assumptions include:
● ‘Standard’, rather than scenario-specific estimates of new cycle trips with common diverted car and PT
  trip feedback from TCM;
● No toll was assumed in 2048 on Takitimu Drive and Tauranga Eastern Link (TEL) as the toll will have
  expired2;
● Residential employment adjustments for Tauriko and Te Tumu residential areas to maintain the required
  population to employment ratio for reasonable residential trip generation rate; and
● Employment adjustments in Tauriko, Rangiuru and Wairakei/TeTumu industrial areas to maintain the
  industrial trip rate of ~180/ha/day.

2.2 Tranche 1 Workshop
The Tranche 1 workshop was held on 9th April 2020. The purpose was to present the Tranche 1 modelling
outcomes and define the scope for Tranche 2 based on the inputs from the various stakeholders.

The high-level modelling results are documented in a file note “Tranche 1 – High Level Modelling Summary”,
prepared by Beca in April 2020. This file note is provided in Appendix A.

2
    https://sunlive.co.nz/news/208218-another-20-years-to-repay-tauranga-toll-road.html

                                                                 Transport modelling for UFTI | 3821668-86155425-17 | | 22 June 2020 | 6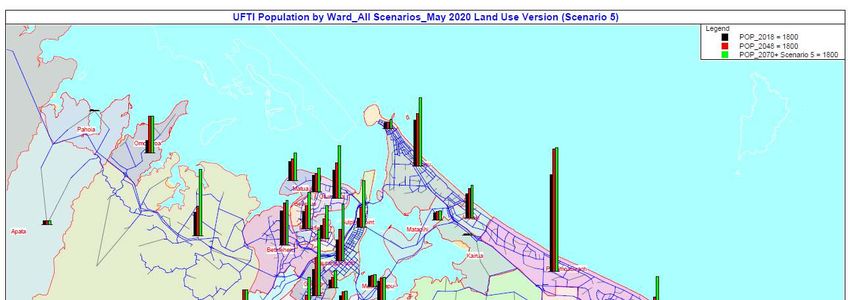
3         Tranche 2 Modelling
Tranche 2 was undertaken in two rounds. Round 1 modelling provided initial results of the 2048 and 2070+
scenarios (refer to Appendix B). Round 2 modelling was undertaken with the refined inputs from Round 1
and additional modelling processes for the detailed model reporting. The Round 2 scenarios are:
● Year 2048
  – 2048 with links – with Matapihi bus bridge and TNL/23rd Avenue/Cameron Road bus only connection.
  – 2048 without links.
● Year 2070+
  – Rail Enable Growth (REG)
  – Connected Urban Villages (CUV)
  – Two Urban Centres (TUC)
  – Dispersed Growth (DG)

3.1 Model Inputs
3.1.1 Land Use

All land use inputs were provided by WBOP/TCC/UFTI which are summarised below:

● TCC land use update in March 2020 for population and dwellings
● WBOP land use update in March 2020 for population and dwellings
● Employment projections from Market Economics Ltd in April 2020. Previously Market Economics provided
  two versions of employment; Relaxed and Conservative, for the Round 1 modelling. The April version is
  the updated version for the Round 2 modelling

The methodology used in allocating the population and dwellings to TTSM zones are discussed below:

●    Dwellings were allocated based on a map provided by UFTI for each scenario which indicated number of
     dwellings at the required locations, and names of townships. The dwellings allocation to TCC/WBOP
     areas are provided in Table 3-1 for all 2070+ scenarios.
●    Numbers from each scenario map were cross-checked to the numbers provided in the scenario table.
●    For 2048: TCC provided land use at a meshblock level which were converted to the TTSM zone system.
●    For 2070+: Dwellings were allocated with priority given to the centre of the indicated location on the map,
     up to 45 dwellings per hectare and any overflow allocated to adjacent zones based on the distance i.e.
     allocating to zones closer to the location centre as first priority.
●    A factor of 2.1 people per dwelling was used for estimating the additional population for the 2070+
     modelled scenarios.
Table 3-1: 2070+ Network Scenarios Dwellings Allocations

    TCC/WBOP Areas                              REG             CUV                    TUC                       DG
    Bayfair                                    5,000            5,000                     --                      --
    Cameron Rd                                 4,000            5,000                 5,000                    2,375
    CBD                                        5,000            5,000                 5,000                    2,375
    Domain Road                                4,000            4,250                     --                      --
    East - Domain                                 --              --                      --                   1,950
    East - Paengaroa                           5,000              --                      --                   4,875
    East - Rangiuru                               --              --                      --                   4,875
    East – Te Puke                             15,000             --                 24,000                    7,800

                                                                  Transport modelling for UFTI | 3821668-86155425-17 | 22 June 2020| 7
TCC/WBOP Areas REG CUV TUC DG
Greerton Racecourse -- 4,250 -- --
Keenan 500 500 500 500
Matapihi Papakainga -- 9,500 -- --
Matua/Cherrywood 5,000 -- -- --
Mount Maunganui -- 5,000 -- --
Non-Matapihi Papakainga -- 1,500 -- --
North - Athenree -- -- -- 967
North - Katikati -- -- -- 1,933
North - Pahoia -- -- -- 2,900
North - TePuna -- -- -- 8,700
Omanu -- -- -- 2,375
Otumoetai -- -- 5,000 --
Papakainga 1,500 -- 1,500 1,500
Te Puna 15,000 -- -- --
Te Puke -- 10,000 -- --
TeTumu 2,000 2,000 2,000 2,000
Wairakei/Te Tumu -- 5,000 -- --
West - Belk -- -- 9,500 --
West - Joyce -- -- 4,750 --
West - Merrick -- -- 4,750 --
West/South - Belk -- -- -- 5,800
West/South - Joyce -- -- -- 1,934
West/South - Merrick -- -- -- 2,416
West/South - Neewood -- -- -- 1,934
West/South - Pukemapu -- -- -- 2,416
Wider Otumoetai -- 5,000 -- 2,375
Total 62,000 62,000 62,000 62,000
Table 3-2 summarises the land use data before employment adjustment.
Table 3-2: Land Use Information – Tranche 2 before employment adjustment
Model Scenarios Population Dwellings Employment
2018 183,200 66,300 94,800
2048 257,800 100,600 132,100
2070+ REG 388,000 162,600 165,100
2070+ CUV 388,000 162,600 167,200
2070+ TUC 388,000 162,600 168,400
2070+ DG 388,000 162,600 161,800
Growth 2018 – 2048 (%) 41% 52% 39%
Growth 2048 – 2070+ (%) 51% 62% 23% – 28%
Transport modelling for UFTI | 3821668-86155425-17 | 22 June 2020| 83.1.2 Programme 8.3 PT Services
The UFTI team provided the Programme 8.3 PT routes with frequencies for the 2048 (with links and without
links) and 2070+ network scenarios. Table 3-3 and Table 3-4 show the PT services and headways coded in
the model for each scenario.
Table 3-3: P8.3 PT Services and Headways, Excluding Contracted School Services (minutes) – Year 2048
Inbound Services Outbound Services
Route
Route Name 2048 with links 2048 without links 2048 with links 2048 without links
No
AM IP PM AM IP PM AM IP PM AM IP PM
Mt Maunganui_SalisburyWharf
Ferry 15 15 15 15 15 15 15 15 15 15 15 15
_TaurangaStrand
Omokoroa_Papamoa_via_Bayfair_
T1 7.5 15 7.5 7.5 15 7.5
CambridgeRdStation_23rdAveExt
Omokoroa_ElizabethSt via 7.5 15 7.5 7.5 15 7.5
T1A
Bethlehem &15thAve
Papamoa_ElizabethSt via TeMaunga 7.5 15 7.5 7.5 15 7.5
T1B
& 15thAve
Tauriko-MT Maunganui via Cameron 7.5 7.5 7.5 7.5 7.5 7.5 7.5 7.5 7.5 7.5 7.5 7.5
T2
Rd
T3 ToiOhomai_Bayfair via Cameron Rd 7.5 7.5 7.5 7.5 7.5 7.5 7.5 7.5 7.5 7.5 7.5 7.5
Crosstown_Bethlehem_
T4 7.5 7.5 7.5 7.5 7.5 7.5 7.5 7.5 7.5 7.5 7.5 7.5
Tauriko_TeMaunga_MtMaunganui
T5 TeTumu_Bayfair 15 15 15 15 15 15 15 15 15 15 15 15
T6 GoldLine_Papamoa_MtMaunganui 15 15 15 15 15 15 15 15 15 15 15 15
T7 Matua_Pyes Pa 15 15 15 15 15 15 15 15 15 15 15 15
T8a Bellevue Circuit Anti_Clockwise 10 10 10 10 10 10 10 10 10 10 10 10
T8b Bellevue Circuit Clockwise 10 10 10 10 10 10 10 10 10 10 10 10
T9a Bethlehem Circuit Clockwise 10 10 7.5 10 10 7.5 10 10 7.5 10 10 7.5
T9b Bethlehem Circuit Anti_Clockwise 7.5 10 10 7.5 10 10 7.5 10 10 7.5 10 10
KeenanRd_TaurangaCity_FraserSt
T10 7.5 10.5 7.5 7.5 10.5 7.5 10 10.5 10 10 10.5 10
via OtumoetaiRd
TaurikoCrossing_TaurangaCity via
T11 20 20 20 20 20 20 20 20 20 20 20 20
Tom Muir Drive
WelcomeBay_TaurangaCity via
T12a 15 15 15 15 15 15 15 15 15 15 15 15
Balintoy Park
WelcomeBay_TaurangaCity via
T12b 15 15 15 15 15 15 15 15 15 15 15 15
Selwyn Ridge
T13a TePuke_Bayfair_Maketu branch 30 60 30 30 60 30 30 60 30 30 60 30
T13b TePuke_Bayfair_Paengaroa branch 30 60 30 30 60 30 30 60 30 30 60 30
TaurikoCrossing_TaurangaCity via
T14 10 7.5 10 10 7.5 10 7.5 7.5 7.5 7.5 7.5 7.5
Ohauiti
L1 Katikati_Omokoroa 15 30 15 15 30 15 15 30 15 15 30 15
L2 Waihi Beach_Omokoroa 60 60 60 60 60 60 60 60 60 60 60 60
L3 Te Puna West 15 30 15 15 30 15 15 30 15 15 30 15
L4 Te Puna North 15 30 15 15 30 15 15 30 15 15 30 15
Te Puna West_Bethlehem
L5 15 30 15 15 30 15 15 30 15 15 30 15
Interchange via Borrell Rd
L6 Te Puke Town Circuit 15 30 15 15 30 15 15 30 15 15 30 15
L7 Rangiuru_Papamoa 15 30 15 15 30 15 15 30 15 15 30 15
X1 Omokoroa_TaurangaCity_via_TNL 15 15 15 15
X2 Tauriko West_TaurangaCity 15 15 15 15 15 15 15 15
Transport modelling for UFTI | 3821668-86155425-17 | 22 June 2020| 9Inbound Services Outbound Services
Route
Route Name 2048 with links 2048 without links 2048 with links 2048 without links
No
AM IP PM AM IP PM AM IP PM AM IP PM
X3 The Lakes_TaurangaCity 15 15 15 15 15 15 15 15
X4 Te Tumu_TaurangaCity express 15 15 15 15 15 15 15 15
Emerald Shores_TaurangaCity
X5 15 15 15 15 15 15 15 15
express
X6 Grenada St_TaurangaCity express 15 15 15 15 15 15 15 15
X7 Maranui St_TaurangaCity express 15 15 15 15 15 15 15 15
Table 3-4: P8.3 PT Services and Headways, Excluding Contracted School Services (minutes) – Year 2070+
Inbound Services Outbound Services
Route No Route Name
AM IP PM AM IP PM
MtMaunganui_SalisburyWharf
Ferry01 10 10 10 10 10 10
_TaurangaStrand
Ferry02 Omokoroa_TaurangaStrand 10 10 10 10 10 10
Apatapa_Omokoroa_Tauranga CBD
Train 30 30 30 30 30 30
_Paengaroa
Omokoroa_Papamoa_via_Bayfair_
T1 10 10 10 10 10 10
CambridgeRdStation_23rdAveExt
T2 Tauriko-MT Maunganui via Cameron Rd 6 6 6 6 6 6
T3 ToiOhomai_Bayfair via Cameron Rd 6 6 6 6 6 6
Crosstown_Bethlehem_Tauriko_
T4 5 7.5 5 5 7.5 5
TeMaunga_MtMaunganui
T5 TeTumu_Bayfair 10 10 10 10 10 10
T6 GoldLine_Papamoa_MtMaunganui 10 10 10 10 10 10
T7 Matua_Pyes Pa 10 10 10 10 10 10
T8a Bellevue Circuit Anti_Clockwise 10 10 10 10 10 10
T8b Bellevue Circuit Clockwise 10 10 10 10 10 10
T9a Bethlehem Circuit Clockwise 10 10 10 10 10 10
T9b Bethlehem Circuit Anti_Clockwise 10 10 10 10 10 10
KeenanRd_TaurangaCity_FraserSt via
T10 6 6 6 6 6 6
OtumoetaiRd
TaurikoCrossing_TaurangaCity via Tom
T11 15 15 15 15 15 15
Muir Drive
WelcomeBay_TaurangaCity via Balintoy
T12a 12 12 12 12 12 12
Park
WelcomeBay_TaurangaCity via Selwyn
T12b 12 12 12 12 12 12
Ridge
T13a TePuke_Bayfair_Maketu branch 20 30 20 20 30 20
T13b TePuke_Bayfair_Paengaroa branch 20 30 20 20 30 20
TaurikoCrossing_TaurangaCity via
T14 5 5 5 5 5 5
Ohauiti
L1 Katikati_Omokoroa 10 20 10 10 20 10
L2 Waihi Beach_Omokoroa 60 60 60 60 60 60
L3 Te Puna West 10 20 10 10 20 10
L4 Te Puna North 10 20 10 10 20 10
Te Puna West_Bethlehem Interchange
L5 10 20 10 10 20 10
via Borrell Rd
L6 Te Puke Town Circuit 10 20 10 10 20 10
Transport modelling for UFTI | 3821668-86155425-17 | 22 June 2020| 10L7 Rangiuru_Papamoa 10 20 10 10 20 10
X2 Tauriko West_TaurangaCity 10 10 10 10
X3 The Lakes_TaurangaCity 10 10 10 10
X4 Te Tumu_TaurangaCity express 10 10 10 10
X5 Emerald Shores_TaurangaCity express 10 10 10 10
X6 Grenada St_TaurangaCity express 10 10 10 10
X7 Maranui St_TaurangaCity express 10 10 10 10
3.1.3 Rail/Ferry Services Assumptions
The UFTI team provided the Rail and Ferry PT service routes and frequencies for the REG and CUV
scenarios.
In the REG scenario, rail services are operated between Apata and Paengaroa via Tauranga CBD in both
directions following the existing freight corridor shown in Figure 3-1.
In the REG and CUV scenarios, one ferry service is operated between Mount Maunganui and Tauranga
CBD. An additional ferry service is operated between Omokoroa and Tauranga CBD in CUV scenario. The
ferry services coded in TTSM are shown in Figure 3-2.
For rail modelling, the following model parameters were adopted:
● Dwell Time - 40 seconds per station (i.e. 0.67 minutes).
● Running Speed – 70 km/hr.
● A travel time perception factor of 0.70 was assumed to represent the reliability and quality effects.
● Headway was assumed to be 30 minutes for all peaks.
For the Ferry modelling, the following model parameters were adopted:
● Running Speed – 40 km/hr.
● A travel time perception factor of 0.70 was assumed to represent the reliability and quality effects.
● The headway is assumed to be 30 minutes for all peaks.
In the Round 2 modelling, it was noticed that Rail and Ferry distances in the model were approximately 23%
higher than the actual distances. This issue was rectified with support from the software provider (CUBE)
and the actual distances were reflected in the Tranches 3 modelling.
With consideration of differences between the actual and modelled distances, the Round 2 modelling
showed average rail speed as 50km/hr (including dwell times at stations).
Transport modelling for UFTI | 3821668-86155425-17 | 22 June 2020| 11Figure 3-1:Rail Services
Figure 3-2:Ferry Services
Station Quality
Station quality influences PT usage such that higher quality stations attract more patronage. There are three
levels of station quality in the model, namely Normal, Medium and High. These represent the physical quality
of the stations in the model with different levels of wait perception factors, transfer penalties and transfer
perception factors. Typically, all bus stops are classified as Normal quality. Locations of the Medium and
Transport modelling for UFTI | 3821668-86155425-17 | 22 June 2020| 12High-quality stations are shown in Table 3-5. In addition, stations are further classified by planned and
unplanned transfers for Medium and High-quality stations, based on the timing of the services at these
stations.
Table 3-5: Proposed Public Transport Station Quality
Station Name Station Quality
Tauranga CBD High, unplanned
Welcome Bay High, unplanned
Barkes Corner High, unplanned
Bayfair High, unplanned
Park and Ride Stations High, unplanned
Rail Stations High, planned
Ferry Stations High, planned
3.1.4 Network Improvements
The 2048 scenario uses the Programme 8.1 traffic network. The 2070+ scenarios also use the P 8.1 network
plus the additional intervention specified in the UFTI network plans. They are summarised in Table 3-6 and
Table 3-7.
Table 3-6 : Road Network Assumptions – Tranche 2
No Projects REG CUV TUC DG
1 Te Tumu to Domain Road via Te Okuroa Drive Buslane Y Y Y Y
2 Domain Road to Bayfair Buslane Y
3 Te Puke Highway to Domain Interchange Buslane Y Y Y
4 Tauranga West Bus Loop Y Y Y
5 Matapihi Bridge Y Y
6 Pyes Pa Road Y
7 Welcome Bay Road HOV lane Y Y
Traffic Traffic + Traffic Traffic +
8 New Link Connection between Te Puke and PEI
Lane Bus Lane Lane Bus Lane
General
9 TNL to/from 15th Avenue HOV only HOV only HOV only
traffic
10 Ring Route from Oropi to Kaitemako Road Y Y
11 Kaituna Link Y Y Y
12 Four lane expressway from SH29/Belk to TNL Minden IC Y
Table 3-7 : Road Network Assumptions (Intersections) – Tranche 2
No Projects REG CUV TUC DG
1 Oropi Road Interchange Y Y Y
2 Poike Road Interchange Y Y Y
3 Totara Street/ Hewlett’s Road Y Y Y Y
4 Matapihi Road local widening & intersection improvements Y Y Y
5 Te Puke Highway/Bell Road & Bell Road/Parton Road Y
Intersection upgrades along Te Puke Highway (including
6
Town Centre) Y Y Y
Transport modelling for UFTI | 3821668-86155425-17 | 22 June 2020| 13No Projects REG CUV TUC DG
7 SH2/SH33 intersections 7
Y Y Y Y
8 Intersection upgrades at the eastern entry points Y Y
9 Tauriko/Upper Belk Road Intersection Y
10 Te Puna local intersections Y Y Y Y
In the above Table 3-7, Items 1-3 intersections improvements are as specified by UFTI and Items 4-10 (local
intersection upgrades) are assumed upgrades in response to large delays.
The Round 2 network plans are provided in Figure 3-3 to Figure 3-8.
Figure 3-3: Transport Network Plan for Year 2048 with links
7
Remove the intersection control (supernode) at these intesections
Transport modelling for UFTI | 3821668-86155425-17 | 22 June 2020| 14Figure 3-4: Transport Network Plan for Year 2048 without links
Figure 3-5: Transport Network Plan for Year 2070+ Rail Enabled Growth
Transport modelling for UFTI | 3821668-86155425-17 | 22 June 2020| 15Figure 3-6: Transport Network Plan for Year 2070+ Connected Urban Villages
Figure 3-7: Transport Network Plan for Year 2070+ Two Urban Centres
Transport modelling for UFTI | 3821668-86155425-17 | 22 June 2020| 16Figure 3-8: Transport Network Plan for Year 2070+ Dispersed Growth
3.1.5 Parking Cost
TTSM uses the following parking cost and structure in the base year (2018):
● Daily parking cost of $12 for Inner CBD and $8 for Outer CBD (note parking cost considers the price of
parking and other costs like distance to final destination, rerouting etc).
● Two paid parking zones: Inner CBD includes Spring, Durham, Devonport and Elizabeth Streets and Outer
CBD includes Brown Street to 2nd Avenue.
● Assumption of 65% of trips at parking zones that will pay parking fee.
The updated TTSM parking price/structure for the 2048 scenario as provided by the UFTI team:
● Daily parking cost of $30 for Inner CBD and $20 for Outer CBD.
● Two paid parking zones: Inner CBD includes Brown Street to 3rd Avenue, Outer CBD includes the whole
Te Papa Peninsular.
● The proportion of trips using paid parking is increased to 85% for the inner CBD zones while retaining
65% for the outer CBD zones. The increase in parking price reflects the policy around limited or priced
parking within private developments along the Te Papa Peninsular.
The 2070+ scenarios use the same parking prices as in 2048.
3.1.6 Public Transport Zonal Fare
TTSM uses the following adults and students’ fares:
● For Tauranga public bus services, the flat fare of $3.06/trip for adults and $1.80/trip for students
● For Regional bus services (Te Puke, Katikati and Omokoroa), the initial boarding fare of $2.60/trip, and
distance fare of $0.15/km for adults. For students, the initial boarding fare of $1.60/trip, and distance fare
of $0.09/km.
Transport modelling for UFTI | 3821668-86155425-17 | 22 June 2020| 17● For School bus services, the flat fare of $1.80/trip.
For the UFTI study, the revised PT fare system as follows:
● A simple three-zone fare system (WBOP_West, Tauranga, WBOP_East):
– Within one zone, adult fare of $3.06/trip and $1.80/trip for students
– For two zones, adult fare of $4.59/trip and $2.70/trip for students
– For three zones, adult fare of $6.12/trip and $3.60/trip for students
● For School bus services, the flat fare of $1.80/trip.
● For Ferry services, the flat fare of $4.59/trip.
3.2 Model Assumptions
3.2.1 Port Traffic Growth
The port/freight model enhancement study recommended a growth of 3% per annum for the port bound HCV
traffic. For 2070+ scenarios, the port traffic growth was capped at year 2070.
3.2.2 Toll
No toll is assumed for Takitimu Drive and Tauranga Eastern Link in the 2048 and 2070+ scenarios as tolls
will expire by 2041 and 2044, respectively.
3.3 Other Model Processes
3.3.1 Employment adjustment
Market Economics Ltd provided new employment projections for 2070+ scenarios to be used in Round 2
modelling. As described in Section 2.1.2, employment numbers were adjusted for greenfield/industrial
zones to achieve target trip generation rates.
The population, dwellings and employment distribution plots are provided in Figure 3-9 to Figure 3-11.
These maps show land use at a typical ‘ward’ level for simplicity – the models themselves use a more fine-
grained spatial system.
Transport modelling for UFTI | 3821668-86155425-17 | 22 June 2020| 18Figure 3-9: Population Distribution by Wards
Figure 3-10: Dwellings Distribution by Wards
Figure 3-11: Employment Distribution by Wards
Transport modelling for UFTI | 3821668-86155425-17 | 22 June 2020| 193.3.2 Cycle Model Feedback
The Tauranga Cycle Model (TCM) estimates new cycle trips based on the traffic and PT demands from the
strategic model (TTSM) and from assumed cycle network interventions. The new cycle trips predicted are
then assumed to be diverted from the initial estimates of the other modes. These ‘diverted’ car and PT trips
are provided back to the TTSM to model the effects of reduced car and PT demands (as the results of mode
shift to cycle).
In Tranche 2 Round 2 modelling, the TCM and its feedback process were run specifically on each scenario
(where Tranche 2 Round 1 used a common estimate of cycle trips for all scenarios). Cycling is generally
more likely for shorter trip lengths than car or PT trips and the cycle trips are expected to increase in
scenarios where population and job area closely located. Table 3-8 provides the diverted Car and PT trip
totals for each scenario, which reflect the estimate of new cycle trips.
Table 3-8: Diverted Car and PT Trips from TCM
AM Peak (1-hr) PM Peak (1-hr)
Scenarios
Car PT Car PT
2018 298 27 191 5
2048 1,310 323 1,050 156
2070+ REG 2,377 671 1,912 365
2070+ CUV 2,026 467 1,625 226
2070+ TUC 2,091 535 1,625 265
2070+ DG 2,167 510 1,707 262
3.3.3 Revised PT adjustment process
TTSM model is a car-based trips model with the added PT modelling functionality. The current TTSM’s PT
model includes prediction of PT trips and an adjustment process to car matrices based on changes in PT
Transport modelling for UFTI | 3821668-86155425-17 | 22 June 2020| 20mode share between base and future years. Change in PT mode share is calculated using a simple ratio (PT
to car ratio) method. This method generally works well for low PT mode share scenarios but tends to
overpredict PT usage in 2070+ scenarios where PT mode share is higher.
These processes were thus updated to a person-based calculation and the calculation of Car and PT trips
for future year is provided below:
,
1 ℎ
, , ℎ
! ℎ" , , , /$"" "%
The above process was also applied to Home Based Education (HBE) trips.
For the Home Base Shopping (HBS), Home Base Others (HBO) and Non-Home Base Others (NHBO) trips,
the existing expansion process was used, but car trips were adjusted to account for changes in car mode
share between the base and future year before applying the expansion process.
3.3.4 Cost Damping
As travel costs are expected to increase significantly in 2070+ scenarios, a cost damping process was
introduced in the TTSM demand module to achieve a good level of model convergence. This was needed to
help achieve faster convergence to an equilibrium between demand and supply within the model.
3.3.5 Sensitivity Test
The calibration of the base year (2018) model to observed public transport usage involved the identification
of various cost functions and model parameters. It was found that an additional penalty was required for
short bus journeys to match the observed behaviour, and this penalty is carried forward to future year
models as is standard practice. In addition, a mode-specific constant (MSC) (-10 minutes to Car) was
needed in the base year calibration for the HBW model to get the mode split (between Car and PT) right.
Sensitivity tests on the calibration penalties to PT were undertaken to explore the impact of these penalties
on model outcomes. The tests involved reducing the penalty by half for all Round 2 scenarios, and the
results are discussed later in this report.
3.4 Model Results
Tranche 2 Round 2 modelling results were presented on 30th April 2020 to the stakeholder group. The
following section will discuss key modelling results and detailed plots and figures are provided in the
Appendices. Key Results include:
● Changes in regional morning peak trips by mode
● Changes in PT mode share
● PT Sensitivity Tests
● Changes in total vehicle travel statistics
● Changes in accessibility to employment
● Changes in vehicle emissions
● Changes in vehicle crash costs
● Maps of road network levels of service
3.4.1 Regional Trip Summary
AM peak regional trip totals for different modes are provided in Figure 3-12.
Transport modelling for UFTI | 3821668-86155425-17 | 22 June 2020| 21Figure 3-12: Regional AM Peak Trips
From the figure above, the cycle and PT trips were significantly increased, but cars are still the largest mode
in future years. For 2070+ scenarios, PT trips are highest in the REG and CUV scenarios.
3.4.2 Sector to Sector Mechanised Mode Share
A 33-sector system was used to understand the mechanised (car & PT) mode shares.
Figure 3-13 shows the sector map and Table 3-9 summarises the mechanised mode shares from each
sector origin. Note that these mode shares are for the origin sector to all destination sectors. Mode share for
specific sector to sector movements could be a lot higher. For example, in 2048 with links scenario, Te Tumu
to the CBD sector 16 has a mode share of ~45% while mode share for Te Tumu as an origin is ~6% overall.
Table 3-10 shows the AM peak mechanised PT mode share to CBD sector 16.
Sector to sector mechanised mode shares are provided in Appendix C.
Figure 3-13: 33 Sector Map
Transport modelling for UFTI | 3821668-86155425-17 | 22 June 2020| 22Table 3-9: AM Mechanised PT Mode Share by Sector Origin
Transport modelling for UFTI | 3821668-86155425-17 | 22 June 2020| 23Sector Name 2018 2048 with links 2048 without links 2070+REG 2070+CUV 2070+TUC 2070+DG
1 Katikati 0% 1% 1% 1% 1% 1% 1%
2 Apata 2% 4% 4% 8% 5% 5% 3%
3 Omokoroa 1% 6% 6% 11% 7% 6% 5%
4 Plummer’s Point 0% 8% 9% 8% 7% 7% 5%
5 Te Puna 0% 8% 8% 16% 7% 7% 7%
6 Bethlehem 5% 9% 9% 10% 10% 9% 9%
7 Otumoetai 3% 7% 7% 9% 8% 8% 7%
8 Brookfield 4% 9% 8% 10% 9% 9% 8%
9 Cambridge Rd 4% 10% 9% 11% 10% 10% 9%
10 Whakamarama 0% 7% 7% 6% 6% 6% 6%
11 Tauriko 1% 6% 6% 7% 7% 6% 7%
12 Pyes Pa 4% 11% 11% 12% 12% 12% 12%
13 Omanawa 0% 2% 2% 3% 3% 3% 3%
14 Greerton 3% 8% 8% 9% 11% 9% 9%
15 Tauranga South 2% 5% 5% 6% 6% 6% 5%
16 CBD Sulphur Point 1% 2% 2% 3% 3% 3% 2%
17 Poike 5% 9% 9% 9% 9% 8% 9%
18 Hairini 6% 10% 11% 13% 12% 12% 11%
19 Ohauiti 0% 0% 0% 0% 0% 0% 0%
20 Welcome Bay 4% 10% 9% 11% 10% 10% 8%
21 Waitao 0% 0% 0% 0% 0% 0% 0%
22 Matapihi 0% 12% 0% 0% 31% 12% 0%
23 Hewlett’s 0% 1% 1% 1% 2% 1% 1%
24 Omanu 2% 6% 6% 6% 6% 6% 5%
25 Mount 1% 3% 3% 3% 4% 3% 3%
26 Arataki 2% 7% 7% 8% 9% 7% 7%
27 Kairua 2% 12% 11% 12% 13% 13% 9%
28 Papamoa 4% 10% 9% 10% 10% 10% 10%
29 Wairakei 3% 6% 6% 7% 6% 7% 6%
30 Te Tumu 0% 6% 6% 7% 7% 7% 7%
31 Papamoa Hills 1% 7% 7% 6% 1% 2% 6%
32 Paengaroa 0% 1% 1% 3% 1% 1% 2%
33 Te Puke 0% 1% 1% 6% 2% 2% 2%
Total 2% 6% 6% 7% 7% 5% 5%
Table 3-10: AM Mechanised PT Mode Share to the CBD (Sector 16)
Transport modelling for UFTI | 3821668-86155425-17 | 22 June 2020| 24Sector Name 2018 2048 with links 2048 without links 2070+REG 2070+CUV 2070+TUC 2070+DG
1 Katikati 1% 2% 4% 6% 4% 2% 2%
2 Apata 3% 5% 8% 43% 11% 4% 3%
3 Omokoroa 3% 24% 32% 46% 27% 24% 25%
4 Plummer’s Point 0% 28% 35% 34% 24% 26% 20%
5 Te Puna 1% 22% 27% 48% 18% 20% 24%
6 Bethlehem 4% 19% 21% 20% 19% 18% 18%
7 Otumoetai 4% 19% 19% 22% 19% 20% 15%
8 Brookfield 5% 21% 21% 22% 21% 21% 19%
9 Cambridge Rd 1% 16% 15% 16% 15% 15% 15%
10 Whakamarama 0% 23% 28% 22% 20% 20% 22%
11 Tauriko 1% 18% 18% 18% 18% 20% 20%
12 Pyes Pa 4% 32% 32% 31% 32% 33% 32%
13 Omanawa 0% 8% 8% 9% 9% 14% 12%
14 Greerton 5% 22% 22% 22% 27% 24% 21%
15 Tauranga South 1% 5% 5% 5% 5% 5% 4%
16 CBD Sulphur Point 0% 0% 0% 0% 0% 0% 0%
17 Poike 8% 30% 30% 33% 32% 30% 31%
18 Hairini 5% 26% 28% 28% 28% 28% 26%
19 Ohauiti 0% 0% 0% 0% 0% 0% 0%
20 Welcome Bay 2% 26% 26% 25% 25% 24% 19%
21 Waitao 0% 0% 0% 0% 0% 0% 0%
22 Matapihi 0% 41% 0% 0% 72% 38% 0%
23 Hewlett’s 1% 4% 4% 4% 4% 4% 4%
24 Omanu 7% 30% 26% 25% 30% 28% 24%
25 Mount 5% 22% 22% 21% 28% 21% 20%
26 Arataki 5% 31% 28% 33% 38% 31% 27%
27 Kairua 0% 40% 34% 35% 41% 38% 21%
28 Papamoa 5% 44% 38% 43% 50% 42% 36%
29 Wairakei 4% 45% 38% 43% 53% 48% 37%
30 Te Tumu 0% 45% 36% 44% 61% 54% 41%
31 Papamoa Hills 0% 27% 22% 22% 0% 0% 16%
32 Paengaroa 0% 3% 2% 13% 3% 3% 7%
33 Te Puke 2% 10% 7% 58% 31% 30% 17%
Total 2% 14% 14% 16% 16% 13% 12%
3.4.3 Daily PT Plots
Daily PT plots were prepared for all modelling scenarios and provided in Appendix D. The key inferences
are discussed below:
● Daily PT trips on Cameron Road (north of 15th Avenue intersection) ranged between 9,700 to 15,100
across different network scenarios.
● Daily PT trips on Matapihi bridge connection was 3,500 in 2048 with links, 9,300 in CUV and 4,600 in
TUC network scenarios.
● Maximum daily rail passengers was achieved between Te Puna and Otumoetai stations, and this is
around 7,500.
Transport modelling for UFTI | 3821668-86155425-17 | 22 June 2020| 253.4.4 PT Sensitivity Test
As mentioned in Section 3.3.5, sensitivity tests on calibration penalties to PT were undertaken to explore
their impact on the model outcomes. The tests involved reducing the penalty by half for all the Round 2
scenarios, and the results are provided in Table 3-11.
Table 3-11: PT Sensitivity Test Results
Model Scenarios PT (Reference) PT (Sensitivity) % Change
2048_w Links 4,900 6,100 24%
2048_wo Links 4,800 6,000 25%
2070_REG 8,400 10,200 21%
2070_CUV 8,300 10,200 23%
2070_TUC 6,400 8,000 25%
2070_DG 6,200 7,700 24%
From the table, the sensitivity tests show increase in PT trips by 21%-25%.
3.4.5 Total Network Vehicle Statistics
Table 3-12 provides the total vehicle network statistics for the UFTI network scenarios. Table 3-13 shows
percentage change to earlier years.
Table 3-12: Network Statistics – Tranche 2 Round 2
Measures 2018 2048 with links 2048 without links 2070+REG 2070+CUV 2070+TUC 2070+DG
Population 183,200 257,800 257,800 388,000 388,000 388,000 388,000
Employment 96,900 143,200 143,200 177,500 180,500 182,900 174,200
Vehicle Kilometre Travelled (VKT) 6,782,100 10,426,800 10,430,600 14,060,100 13,830,100 14,377,700 14,193,100
Vehicle Hour Travelled (VHT) 118,200 173,700 173,700 254,700 254,500 260,300 254,600
Vehicle Trips 642,200 906,900 907,400 1,262,800 1,268,600 1,289,100 1,261,500
VKT/Person 37 40.4 40.5 36.2 35.6 37.1 36.6
Vehicle Trips/Person 3.5 3.5 3.5 3.3 3.3 3.3 3.3
Vehicle Trips/Employment 6.6 6.3 6.3 7.1 7 7 7.2
Table 3-13: Percentage (%) Change in Network Statistics – Tranche 2 Round 2
Change relative to 2018 Change relative to 2048 with links
Measures
2048 with links 2048 without links 2070+REG 2070+CUV 2070+TUC 2070+DG
Population 40.7% 40.7% 51.0% 51.0% 51.0% 51.0%
Employment 47.8% 47.8% 24.0% 26.0% 28.0% 22.0%
Vehicle Kilometre Travelled (VKT) 53.7% 53.8% 35.0% 33.0% 38.0% 36.0%
Vehicle Hour Travelled (VHT) 47.0% 47.0% 47.0% 47.0% 50.0% 47.0%
Vehicle Trips 41.2% 41.3% 39.0% 40.0% 42.0% 39.0%
VKT/Person 9.3% 9.3% -10.0% -12.0% -8.0% -10.0%
Vehicle Trips/Person 0.4% 0.4% -7.0% -7.0% -6.0% -8.0%
Vehicle Trips/ Employment -4.4% -4.4% 12.0% 11.0% 11.0% 14.0%
● Changes in VKT and VHT, when compared to 2018, are similar for 2048 with and without links scenarios.
● VKT growth is between Population and Employment growth for 2070+ scenarios. VHT growth is higher
than VKT increase which shows that congestion is worse in 2070+ scenarios.
● CUV scenario has the lowest VKT and VHT among 2070+ scenarios.
Transport modelling for UFTI | 3821668-86155425-17 | 22 June 2020| 26● Vehicle trip rate per person reduced in 2070+ network scenarios, possibly due to mode shift to PT/Cycle
and lower employment growth.
3.4.6 Accessibility to Jobs
This measure calculates how many jobs are accessible by traffic and PT within certain travel times. In this
study, a 30-minute travel time threshold was used for traffic and a 45-minute threshold for PT.
The traffic travel time includes a 5-minute walk time to represent travel time from the parking location to the
final destinations in the CBD. The PT travel time includes access time, wait/transfer time and in-vehicle time.
Table 3-14 provides the number of jobs accessible by car and PT.
Table 3-14: Accessibility to Job by PT and Traffic
No. of Accessible Jobs %age of Accessible Jobs
Scenarios Total Jobs
Traffic PT Traffic PT
2018 96,900 77,462 20,508 80% 21%
2048 with links 143,200 117,588 65,285 82% 46%
2048 without links 143,200 117,489 63,547 82% 44%
2070+ REG 177,500 115,970 89,908 65% 51%
2070+ CUV 180,500 118,690 90,392 66% 50%
2070+ TUC 182,900 121,531 69,252 66% 38%
2070+ DG 174,200 118,786 59,468 68% 34%
Key points from the table:
● Significant increase in PT accessibility over 2018 to 2048 and 2070+
● Car accessibility increases over 2018 to 2048, then reduces in 2070+
● 2048 with links scenario accessibility is 2% higher than 2048 without links scenario
● REG & CUV have similar PT accessibility, while TUC and DG are noticeably lower PT accessibility
3.4.7 Vehicle Emission
NZ Transport Agency’s VEPM version 6 (released in July 2019) was adopted for this study. Features of the
VEPM 6 model are outlined below:
● VEPM estimates vehicle tail-pipe emissions only i.e. does not include vehicle manufacture or energy
generation;
● VEPM provides rates in terms of grams per km of travel, depending on average vehicle speeds; and
● VEPM rates are based on assumed vehicle fleet composition in future years.
Vehicle emissions are estimated for each link in the strategic model (TTSM) by applying the VEPM rates to
car travel time and speed. The emissions are then summed across all links in the model. VEPM’s assumed
vehicle fleet distribution by VKT over time is provided in Figure 3-14.
Transport modelling for UFTI | 3821668-86155425-17 | 22 June 2020| 27Figure 3-14: Assumed Vehicle Fleet in VEPM 6
According to VEPM, while the light petrol vehicles (blue) are dominant in the year 2020, light hybrid/electric
vehicles will make most of the fleet in 2050. Figure 3-15 shows how the CO2 emissions might vary for
different speeds and different model years in light of these assumptions.
Figure 3-15: VEPM 6 CO2 Emission Rates
From the figure, CO2 emissions are high at lower speeds and gradually reduce as speed increases. CO2
emission rates are significantly lower in the year 2048 compared to 2018.
Modelled 2070+ emissions were calculated using 2050 rates from VEPM since 2050 is the furthest model
year in VEPM and is recommended as the rate to use for further model years.
Table 3-15 and Table 3-16 summarises the outcomes from the VEPM model and the overall vehicle traffic
statistics and percentage change in emission results relative to the earlier year.
Transport modelling for UFTI | 3821668-86155425-17 | 22 June 2020| 28Table 3-15: Summary of Emission Results and Vehicle Statistics
2048 with
Measures Units 2018 2048 without links 2070+REG 2070+CUV 2070+TUC 2070+DG
links
Carbon monoxide (CO) kg/day 14,690 1,267 1,267 1,539 1,523 1,572 1,548
Cardon dioxide (CO2) kg/day 1,307,783 549,469 549,626 677,476 667,701 692,707 682,399
Volatile organic compounds (VOC) kg/day 1,124 81 81 101 100 104 102
Nitrogen oxides (NOx) kg/day 3,715 833 834 907 896 926 913
Nitrogen dioxide (NO2) kg/day 777 175 175 173 171 176 174
PM2.5 E kg/day 150 6 6 7 7 8 7
PM10.0 BT kg/day 91 133 133 187 183 193 190
Fuel Consumption l/day 540,152 239,696 239,765 295,147 290,882 301,770 297,303
Population kg/day 183,200 257,800 257,800 388,000 388,000 388,000 388,000
CO2/person kg/day 7.1 2.1 2.1 1.7 1.7 1.8 1.8
Table 3-16: Percentage (%) Change of Emission Results and Vehicle Statistics
Change relative to 2018 Change relative to 2048 with links
Measures Units
2048 with links 2048 without links 2070+REG 2070+CUV 2070+TUC 2070+DG
Carbon monoxide (CO) kg/day -91% -91% 22% 20% 24% 22%
Cardon dioxide (CO2) kg/day -58% -58% 23% 22% 26% 24%
Volatile organic
kg/day -93% -93% 24% 23% 28% 25%
compounds (VOC)
Nitrogen oxides (NOx) kg/day -78% -78% 9% 8% 11% 10%
Nitrogen dioxide (NO2) kg/day -77% -77% -1% -3% 1% -1%
PM2.5 E kg/day -96% -96% 24% 22% 27% 25%
PM10.0 BT kg/day 46% 46% 41% 38% 45% 43%
Fuel Consumption l/day -56% -56% 23% 21% 26% 24%
Population kg/day 41% 41% 51% 51% 51% 51%
CO2/person kg/day -70% -70% -18% -19% -16% -17%
Key points from the above tables:
● Changes in the VEPM for 2048 with and without links scenarios are similar compared to 2018;
● CUV scenario saves CO2 of 10 tonnes/day compared to REG, 25 tonnes/day compared to TUC and 15
tonnes/day compared to DG network scenarios; and
● CO2 increase is between 22% to 26% which is lower than the VKT increase of 33% to 38% (refer Table
3-13) for 2070+ network scenarios.
3.4.8 Vehicle Crash Cost Estimates
Future crash costs were estimated using crash rates ($/km) from the past 5 years of crash data in Tauranga.
Crash rates vary by speed and road type, and thereby capture changes in the amount of travel (likely due to
mode shift, changes in trip length or shifts in traffic to higher grade roads.
Crash costs in future years were estimated for individual links in the TTSM using VKT and speeds, then
combined across the network to generate a network-wide crash cost. Hence it does not account for location
specific safety improvements.
Figure 3-16 shows total crash cost and crash cost per person for all scenarios.
Transport modelling for UFTI | 3821668-86155425-17 | 22 June 2020| 29Figure 3-16: Crash Cost
$300,000,000 $740
$720
$250,000,000
$700
$200,000,000 $680
Annual Crash Cost
Cost\Person
$660
$150,000,000
$640
$100,000,000 $620
$600
$50,000,000
$580
$- $560
2048 wo
2018 2048 w Links 2070+ RE 2070+ CUV 2070+ TUC 2070+ DG
Links
Annual Crash Cost $130,807,255 $188,092,357 $188,202,884 $245,936,128 $243,094,994 $258,852,926 $251,862,178
Cost/Person $714 $730 $730 $634 $627 $667 $649
From the above figure, total crash costs are very similar for the two 2048 scenarios. Crash costs are
somewhat different in 2070+ scenarios. CUV scenario has the lowest total annual crash cost and crash cost
per person among 2070+ scenarios.
3.4.9 Vehicle Level of Service
To assess the level of congestion (for general traffic), a process was developed using weighted average
delay (for intersections) and volume/capacity ratios (for links) to estimate the LOS for the whole network. The
LOS criteria adopted for the analysis are shown in Table 3-17.
Table 3-17 : LOS Criteria for Link and Intersection Types
LOS Intersection8 Rural9 (rolling) Rural (level) Freeway10 Freeway Arterial11 &
(Weighted Average (V/C) (V/C) (FFS80) Local
Delay, s) (V/C) (V/C) (V/C)
A < 10 < 0.04 < 0.05 < 0.26 < 0.30 < 0.26
B 10 - 20 0.04 - 0.15 0.05 - 0.17 0.26 - 0.40 0.30 - 0.48 0.26 - 0.43
C 20 - 35 0.15 – 0.30 0.17 – 0.33 0.40 – 0.60 0.48 – 0.70 0.43 – 0.62
D 35 - 55 0.30 – 0.46 0.33 – 0.58 0.60 – 0.85 0.70 – 0.90 0.62 – 0.82
E 55 - 80 0.46 – 0.90 0.58 – 1.00 0.85 – 1.00 0.90 – 1.00 0.82 – 1.00
F > 80 > 0.9 > 1.00 > 1.00 > 1.00 > 1.00
The Weighted Average Delay for intersections is the normal volume weighted delay plus an additional weight
factor (delay). This additional factor was included to place more weight on critical movements when
calculating the “representative average” condition at the intersections.
8
HCM2000 Chapter16- Signalised Intersection.
9
Austroad Part2- Roadway Capacity, 1988. Assumed 80% of sight distance length.
10
HCM2000 Chapter23- Basic Freeway Segment.
Technical paper “Performance Measures and Threshold Value for Northeast Ohio Areawide Coordinating
11
Agency’s (NOACA’s) Congestion Management Process, NOACA, August 2007”
Transport modelling for UFTI | 3821668-86155425-17 | 22 June 2020| 30You can also read