Social Network Analysis Methods for International Development
←
→
Page content transcription
If your browser does not render page correctly, please read the page content below
Research Brief
RTI Press                                                                                                                             ISSN 2378-7929

                                                                                                                                            May 2021

Social Network Analysis Methods for International Development
Eric M. Johnson and Robert Chew

                                                                     Key Research Needs
                                                                     • Incorporate social network analysis (SNA) into monitoring,
                                                                       evaluation, and learning processes. SNA can be conducted
                                                                       at various points of a project to inform program design,
                                                                       adaptive management, learning, and evaluation by
                                                                       considering network structure and network changes over
                                                                       time.
                                                                     • Demystify the use of SNA. Increased use of SNA tools and
                                                                       clear presentation in widely read publications are needed
                                                                       to bring the analytic approach into the mainstream of
                                                                       international development.
                                                                     • Build capacity to conduct SNA. The capacity to conduct
                                                                       and interpret SNA is lacking across actors in international
                                                                       development. Efforts by some organizations to build
                                                                       capacity in the community are well noted and should be
                                                                       built upon.
                                                                     • Build understanding of relationships between social
                                                                       networks and development outcomes. SNA will be useful
At their core, international development programs attempt to           only to the extent it helps users understand the relationship
catalyze new relationships and new ways of working among               between networks and development outcomes that matter.
program stakeholders. For example, youth development                 • Establish norms for data collection and identity protection.
programs may seek to connect educators to private sector               Data about individuals and their interactions with others
employers to make skills training more demand-driven,                  are inherently sensitive data. As a part of standard research
                                                                       ethics protocols, SNA practitioners must make carefully
increasing youth employability. Others may seek to steer at-risk
                                                                       considered decisions about how or if to anonymize data
youth toward positive role models and community services,
                                                                       when reporting it.
and away from gangs, to improve their safety and resiliency.
Reflecting this, an official at the United States Agency for
International Development (USAID), the world’s largest             network analysis (SNA) is a quantitative research method that
bilateral international development donor, recently stated,        programs can use to help address this critical knowledge gap.
“the design, implementation and evaluation of development          This policy brief advances the case for SNA in international
programs is intrinsically about people, institutions and the       development, outlines general approaches, and reviews two
relationships between them.”1 Many development programs,           recently conducted case studies that illustrate its potential.
however, lack a sophisticated understanding of these               Included is an agenda for future work and applications in
relationships and a way to measure change in them. Social          international development.

                                                                             RTI Press Publication No. RB-0026-2105. Research Triangle Park, NC: RTI Press.
                                                                                                       https://doi.org/10.3768/rtipress.2021.rb.0026.2105
SNA for International Development

Social Network Analysis                                                 The position and partitioning of nodes in the network maps
Social networks are “a set of players and patterns of exchange          visualizes the network structure, including central actors,
of information and/or goods among these players.”2 The                  isolated actors, bridging actors, and any sub-groupings or
intellectual home of network analysis is in sociology, where            cliques. See the Annex for more on the computing software
Durkheim emphasized the study of social relationship                    needed and approaches to network visualization.
patterns, and Granovetter advanced the importance of “weak
                                                                        SNA metrics are often grouped into two categories to
ties” (distant acquaintances) in relational phenomena, such as
                                                                        characterize networks by their level of (1) network closure
successfully acquiring leads for job opportunities.3 Later, in
                                                                        or cohesion, measured by levels of density, reciprocity,
political science, Putnam explained waning social capital in
                                                                        transitivity, degree centrality, and shortest path, and
United States by the breakdown of community networks, such
                                                                        (2) network heterogeneity, measured by modularity.
as bowling leagues and economic structures like labor unions.4
                                                                        Networks with higher levels of closure are associated with
Only recently, though, have researchers drawn on the methods
                                                                        higher familiarity, trust, and social capital, and more-
and empirical basis of SNA to elevate it to a mainstream
                                                                        efficient exchange of information, goods, or services. More-
analytic tool. The rapid growth in published papers and grant
                                                                        heterogeneous networks are considered more effective at
funding over the past 15 years demonstrates this uptake.5
                                                                        mobilizing resources, given that network exchanges often
SNA is a quantitative analysis tool used to identify and                require coordination of many skills and various inputs across
understand relationships between people or, in other words,             different types of actors.
social networks. It visually displays data so researchers can
                                                                        For SNA to be useful or effective, it should be methodologically
see behavioral relationships at the micro level (individual,
                                                                        well-aligned to answer clear research questions. In
institutional) and patterns at the macro or network level. SNA
                                                                        international development, it presents a potentially useful tool
has the flexibility to treat networks as both independent and
                                                                        for understanding a range of network relationships, including
dependent variables. For example, it can help answer how
                                                                        levels of collaboration and exchange; the existence of central
differences in individuals’ networks (independent variable)
                                                                        actors; excluded populations; and absent connections among
explain their risk for contracting COVID-196 or how racially
                                                                        individuals, organizations, or groups. Two recent applications
segregated schools affect a young person’s friendship networks
                                                                        of SNA to international development used SNA to understand
(dependent variable).7
                                                                        collaboration among different types of actors that programs
The data used in SNA can include secondary sources, such as             had been unable to assess adequately in the past.
social media data (connections, likes, shares, etc.); evidence of
collaboration, such as co-authoring a paper; or administrative          El Salvador: Research and Development Clusters
records such as school attendance, employment history, or               for Innovation-Led Economic Growth
club membership. Surveys can also collect primary data for              In 2018, a team from RTI International and Duke University
SNA, with respondents asked to answer questions about their             conducted SNA in El Salvador to assess network connections
relationships, exchanges, and affiliations. Surveys often ask           among university, private sector, and government
about the level of respondents’ connection to the others (i.e.,         collaborators in distinct economic sector clusters (energy,
frequency of communication); the nature of those exchanges              light manufacturing, information and communications
(information, goods and services, collaboration); and the value         technology [ICT], and agroindustry and food processing).
the respondent assigns to them.                                         These clusters had been formed as a part of a 5-year USAID
                                                                        program in El Salvador to advance economic growth through
SNA data are typically analyzed and interpreted in two ways.
                                                                        improved higher education performance. At the time in El
First, a set of network metrics can characterize the network
                                                                        Salvador, university faculty generally lacked knowledge of
and quantify its dimensions. Typical network measures
                                                                        industry trends, had few connections with employers, and,
include density, reciprocity, transitivity, centralization, and
                                                                        thus, were largely unaware of in-demand competencies
modularity. See Figure 1 for definitions and explanations of
                                                                        needed for student employment. Further, faculty engaged in
these metrics, among others. Second, researchers can also
                                                                        little research to develop applied solutions to the challenges
explore and interpret social networks visually. Various software
                                                                        of private industry. On the private sector side, Salvadoran
tools map the connections among network actors and produce
                                                                        employers reported difficulty in finding new hires with
social network graphs or “sociograms.” In these graphs, colors
                                                                        appropriate technical and soft skills and had difficulty sourcing
demark different kinds of actors, or nodes on the graph.
                                                                        innovation.8
The sizes of the nodes indicate the levels of connectedness.

RTI Press: Research Brief                                           2             RTI Press Publication No. RB-0026-2105. Research Triangle Park, NC: RTI Press.
                                                                                                            https://doi.org/10.3768/rtipress.2021.rb.0026.2105
SNA for International Development
Figure 1. Common social network analysis measures
Network metric Explanation
Network Size Network size refers to the number of nodes in the network.
In this example there are two nodes. They are different
colors to represent people from different groups of interest,
A B
like gender. The size of the node is typically related to how
many connections it has.
Edges Edges are connections among nodes. Edges can be directed,
meaning we care if the connection goes both ways (i.e., is A B A B
reciprocal), or undirected, where we only seek to understand
if there is any connection between A and B. Directed Undirected
Density Density indicates how close a graph is to being fully
connected. 0 = no connections at all; 1 = all possible A C
connections among nodes are made. In this example
the solid lines represent connections and the dotted B
lines potential connections that are not realized. In this
directed network there are 6 possible connections, with
4 connections made, or a density of 66%.
Reciprocity Reciprocity is the fraction of all possible connections in
which nodes are mutually connected. Using the same A C
example as above, we see one reciprocal connection out of
the three connected nodes, or 33%. B
Transitivity Transitivity is the proportion of all possible triads connected
A B
within a graph. Among the nodes A, B, C, D, there are four
possible triads that can be formed. In this example, we see
one connected triad with solid lines, or 25% transitivity.
C D
Shortest Path Shortest path is the path that represents the shortest
distance between a given pair of nodes. To summarize B
how isolated a node is, we can take the average of a node’s A C
shortest paths to all other nodes in a network. For example,
the average shortest path for A is 1.33 as it takes 1 edge D
to get to nodes B and D and two edges (in red) to get
to node C, an average distance of 1.33 edges.
Degree Degree centralization is a measure of how much
Centralization “influential” nodes impact network structure. 1 = star B B B
shaped network with all connections flowing through
one node. 0 = fully connected graph or a graph with no A A A
connections, respectively seen in the second examples C D C D C D
here.
High Degree Centrality Low Degree Centrality
Modularity Modularity is a measure of partitioning between groups
in a network. Scores above 0 indicate more within-group
ties than between group ties. Lower scores indicate greater
mixing across groups. Scores of 0 indicate a mixing expected
in a random graph. High Modularity Low Modularity
RTI Press: Research Brief 3 RTI Press Publication No. RB-0026-2105. Research Triangle Park, NC: RTI Press.
https://doi.org/10.3768/rtipress.2021.rb.0026.2105SNA for International Development
To catalyze mutually beneficial relationships and overcome and projected future collaborations. For example, the
these challenges, the USAID program promoted a cluster network density in light manufacturing on the collaboration
approach that brought academic, private, and government measure went from 7% (past collaboration), to 14% (current
actors together to develop new curricula, collaborate in collaboration), to 22% (future collaboration). Reciprocity and
research and development, and provide new career pathways average shortest path displayed similar patterns. Network
for students. Each cluster included anchor and affiliate heterogeneity decreased slightly when comparing collaboration
universities, industry associations and affiliated businesses, and before and after the program. The increase in modularity,
relevant government counterparts. These cluster members met combined with an increase in density, suggests that the
regularly across a 5-year period and accessed grant funding program especially helped grow within sector collaboration,
and technical support. Ultimately, collaborations led to 30 though overall connections across sectors also grew over the
new industry-aligned academic degree programs. Cluster course of the program.
collaborators also conducted twenty-six applied research and
With these data, we created network maps to visualize changes
development programs promoting technology transfer from
in these networks over time, as seen in Figure 2. The colors
universities to industry.
represent different clusters, with the light manufacturing
Although the program outputs were impressive, program sector used in Table 1 in blue. Visually, we observe in the light
stakeholders wanted to know the structure and strength of manufacturing graph the increasing density of connections,
the cluster networks and whether the collaborations might be and the presence of several star-shaped cliques where
sustained. One month after program closure, we sent an online important nodes act to connect others in the network, as seen
survey to 120 participants in the program’s four economic in the average shortest path score.
clusters. The survey presented respondents with a list of names
from their cluster. For each name, respondents indicated Table 1. Network scores for cluster connections in the light
their level of collaboration with that individual, if any. If manufacturing sector
collaboration was of a certain level, the respondent answered
further questions about that individual. Receiving 80 responses Prior Current Future
Collaborations Collaborations Collaborations
(66% response rate), our research team used these data to
assess (1) the importance of reported connections, (2) the level Density 7% 14% 22%
of prior collaborations, (3) the state of current collaborations,
Reciprocity 10% 16% 12%
and (4) anticipated future collaborations.
Average
For each network, we produced several network measures shortest path 2.2 1.8 1.6
(see Table 1 for the light manufacturing cluster, as an
Modularity 0.37 0.43 0.28
example). Network closure increased as respondents recalled
past collaboration, reported on current collaborations,
Figure 2. Network maps for prior, current, and future cluster collaborations in El Salvador
Did you collaborate with this person prior Have you collaborated with this person Do you anticipate future collaborations with
to the program? within the cluster (e.g., on joint research, this person?
curriculum reform)? Lines weighted by certainty ("Definite," "I hope so").
Sector
Agro-industry and Food Processing Energy ICT Light Manufacturing
RTI Press: Research Brief 4 RTI Press Publication No. RB-0026-2105. Research Triangle Park, NC: RTI Press.
https://doi.org/10.3768/rtipress.2021.rb.0026.2105SNA for International Development
These increasing levels of network closure imply stronger city. Each respondent answered a set of questions about the
communication channels, more-efficient collaboration, 30-person roster: how frequently they communicated with
and improved ability to prioritize collective action.9 These each person, what level of collaboration they had on aging and
networks also show moderate levels of heterogeneity, measured elderly policy issues, and how much they trusted the person.
by modularity. Overall, these data indicate networks in
Table 2 lists the network data for the question on frequency of
El Salvador that have moderate organizational capacity and
communication, and Figure 3 displays the network maps for
appear to be improving over time. The expectation is that these
these cities across the three questions.
social networks will sustainably support the USAID program
goals of improving the flow of information from the academic
to the private sector, promoting technology transfer, and Table 2. Network metrics for aging and elderly policy
networks in Indonesia
creating pathways for student internships and employment.
Jakarta Yogyakarta Denpasar
Indonesia: Knowledge System Connections for
Density 39% 17% 9%
Better Evidence-Based Policy
Since 2012, RTI has directed a program in Indonesia called the Reciprocity 50% 32% 20%
Knowledge Sector Initiative (KSI), funded by the Australian Transitivity 48% 17% 14%
Department of Foreign Affairs and Trade. KSI seeks to improve
Indonesian public policy by strengthening systems that Degree Centralization 0.71 0.86 0.5
encourage the use of research and evidence in policy making.10 Modularity -0.01 -0.01 -0.01
To do this, KSI works to strengthen and connect four parts of
Average Distance 0.87 1.16 1.11
the evidence-to-policy system:
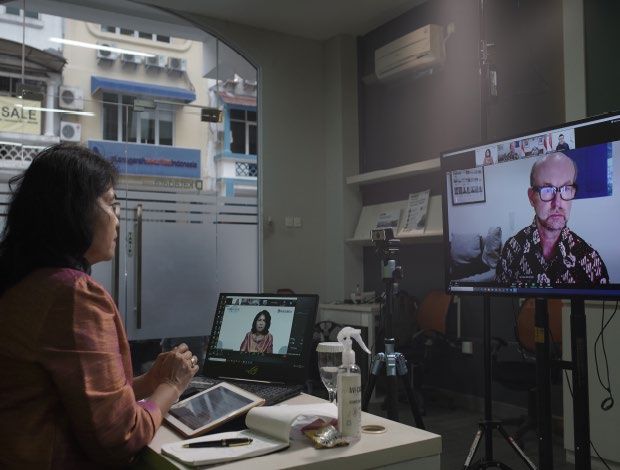
• Knowledge enablers: regulatory authorities, public and private These networks, particularly that of Jakarta, show moderate
funding bodies levels of closure or cohesion (healthy levels of density,
• Knowledge producers: universities, research centers, think reciprocity, and transitivity; low distance between nodes; and
tanks high degree centrality). They also show high heterogeneity
• Knowledge intermediaries: civil society, media (i.e., low modularity), as seen visually in the between-group
or multicolor nodal connections. This level of network
• Knowledge users: policy makers, parliamentarians, closure and network heterogeneity is associated with strong
government ministries policy network organizational capacity and could lead to
KSI operates through policy working groups that combine efficient and effective policy formation.9 This SNA further
knowledge enablers, producers, intermediaries, and users reveals differences among locations and across the network
in a particular policy area to build a body of knowledge, connection questions.
promote its use, and develop policy based upon it. Indonesian
stakeholders and the Australian funders of KSI have an interest Social Network Analysis and International
in understanding the strength of these networks and their Development: Key Recommendations
changes over time. Within the international development field, the use of SNA
to improve program design, program implementation, and
To contribute to that understanding, RTI researchers program evaluation and learning is quite limited. USAID’s
conducted SNA in 2020 in an area KSI has prioritized: aging Learning Laboratory and the World Bank’s Independent
and elderly policy. Improving aging and elderly policy, Evaluation Group have both called for the increased use
particularly the development of “Aging-Friendly Cities” of SNA,1,12 and some recent projects have embraced these
in rapidly urbanizing environments, is a World Health methods.13 Note that the examples in this brief were both
Organization initiative active in Indonesia.11 To conduct SNA conducted in relatively high-resource environments (urban
in this area, we worked with an Indonesian research institute, areas of Indonesia and El Salvador) and among well-
SurveyMeter, to develop a list of 65 individuals (researchers, educated, survey-savvy respondents. Other SNA tools, such
policy makers, journalists, and government funders of as Net-Mapping and Collaboration Mapping, can be used in
research) active in aging and elderly policy networks for lower resource environments, in situations where the network
each of three cities: Jakarta, Yogyakarta, and Denpasar (Bali is not known, or where the network is not as bounded as those
region). To make the name rosters more manageable for in the case examples presented here.
survey respondents, the team randomly selected 30 names per
RTI Press: Research Brief 5 RTI Press Publication No. RB-0026-2105. Research Triangle Park, NC: RTI Press.
https://doi.org/10.3768/rtipress.2021.rb.0026.2105SNA for International Development
Figure 3. Networks maps for aging and elderly policy networks in Indonesia
Level of Communication Level of Collaboration Level of Trust
In the last 24 months, how often did you In the last 24 months, I collaborated I have a good level of trust in this
communicate with the following people (worked together) with this person on person’s work on aging issues.
professionally on aging issues? aging issues.
RTI Press: Research Brief 6 RTI Press Publication No. RB-0026-2105. Research Triangle Park, NC: RTI Press.
https://doi.org/10.3768/rtipress.2021.rb.0026.2105SNA for International Development
The field of international development needs new tools and could be within project teams or among other actors with
approaches for understanding the complex relational dynamics the system, such as universities and research institutes. At
within which it operates and changes in the networks it seeks the same time, donors, who will ultimately fund and approve
to affect. The field can apply SNA in many contexts, such as the use of these methods, need SNA capacity too. We should
global health (disease spread), economic growth (market build on efforts by some organizations to build capacity in
relationships), and governance (policy networks). With the community, including available SNA 101 courses.14,15
the right approaches and improved capacity, international • Establish norms for data collection and identity protection. Data
development projects can conduct SNA more often to improve about individuals and their interactions with others are
understanding of programs and to improve outcomes. inherently sensitive. In standard research ethics protocols,
From experiences with SNA, including the cases presented such as human subject reviews, SNA practitioners must
here, we recommend the following steps for integrating SNA make decisions about how or whether to anonymize data
into international development. We present it as an agenda for when reporting it, especially in sociograms that can make
SNA application in international development: individuals visible. For many maps, indication of group
or organizational affiliation is sufficient, and respondents’
• Routinely incorporate SNA into in monitoring, evaluation, and names are not needed. In other cases, especially SNAs that
learning processes. A project can conduct SNA at various
seek to understand personalized networks, identifying
points (i.e., baseline, middle, end) to inform program network nodes by name may be unavoidable. In these
design, adaptive management, learning, and evaluation by cases, researchers should obtain explicit consent to disclose
considering network structure and network change over identity in advance.
time. Mixing primary and secondary data and quantitative
and qualitative data will augment understanding of SNA • Build understanding of relationships between social networks and
network data and visualizations. Whenever possible, SNA development outcomes. SNA will be useful only to the extent
should be combined with other complementary analyses, it helps users understand the relationship between networks
such as political economy analysis. For example, SNA and development outcomes that matter. Knowledge of
can add detail and texture to common political economy interventions that work to improve networks is essential for
analyses of actors or groups with the most resources, or meaningful use of SNA in the international development
through whom resources are brokered. SNA can also field.
uncover actors or groups that are relatively isolated from Ultimately, researchers must thoughtfully consider and tailor
political-economic networks. SNA to fit the country and program environment. To be sure,
• Demystify the use of SNA among program participants, donors, and there will be skeptics of these methods and concerns around
practitioners. Increased use of SNA tools and corresponding the cost of the analysis, computing sophistication needed,
reports and publications should help bring the analytic ability of local teams to conduct SNAs, and relevance of the
approach into the mainstream. Concerted attempts to speak data to program design and evaluation. It is likely, however,
in plain language and display data in clear ways will help that SNA can be done within reasonable costs, using open
in these efforts. Toward this end, the Annex answers some access software; combined with other ongoing analyses, such
frequently asked questions. as political economy analyses or more-routine monitoring and
• Build capacity to conduct SNA. Many actors in international evaluation; and simplified for use by project teams by focusing
development lack the capacity to conduct and interpret SNA. on the most important metrics or visuals.
At the stakeholder level in partner countries, international
development researchers and practitioners should work to
build stakeholder capacity to conduct and use SNA—this
RTI Press: Research Brief 7 RTI Press Publication No. RB-0026-2105. Research Triangle Park, NC: RTI Press.
https://doi.org/10.3768/rtipress.2021.rb.0026.2105SNA for International Development
References
1. Baker M. Demystifying social network analysis in development: 11. Suriastini W, Buffardi AL, Fauzan J. What prompts policy change?
five key design considerations. 2019 Mar 26. In: USAID Learning Comparative analyses of efforts to create age-friendly cities in 14
Lab Blog [Internet]. Available from: https://usaidlearninglab.org/ cities in Indonesia. J Aging Soc Policy 2019;31(3):250–70. https://
lab-notes/demystifying-social-network-analysis-development- doi.org/10.1080/08959420.2019.1589889
five-key-design-considerations 12. Vaessen J, Hamaguchi K. Understanding the role of the World
2. Annen K. Social capital, inclusive networks, and economic Bank Group in a crowded institutional landscape. 2017 Nov
performance. J Econ Behav Organ 2003;50(4):449–63. https://doi. 14. In: World Bank Independent Evaluation Group Blog
org/10.1016/S0167-2681(02)00035-5 [Internet]. Available from: https://ieg.worldbankgroup.org/blog/
understanding-world-bank-groups-role
3. Granovetter MS. The strength of weak ties. Am J Sociol
1973;78(6):1360–80. https://doi.org/10.1086/225469 13. Pilliard-Hellwig R. Ma3an’s social network analysis: a wellspring
of CLA. 2020 Jun 30. In: USAID Learning Lab Blog [Internet].
4. Putnam RD. Bowling alone: America’s declining social capital. Available from: https://usaidlearninglab.org/lab-notes/
J Democracy 1995;6(1):65–78. https://doi.org/10.1353/ ma3an%E2%80%99s-social-network-analysis-wellspring-cla
jod.1995.0002
14. Valente TW, Palinkas LA, Czaja S, Chu KH, Brown CH.
5. Popelier L. A scoping review on the current and potential use Social network analysis for program implementation. PLoS
of social network analysis for evaluation purposes. Evaluation One 2015;10(6):e0131712. https://doi.org/10.1371/journal.
2018;24(3):325–52. https://doi.org/10.1177/1356389018782219 pone.0131712
6. Firth JA, Hellewell J, Klepac P, Kissler S, Kucharski AJ, Spurgin 15. Laesecke A, de García D. Visualizing what connects us: social
LG; CMMID COVID-19 Working Group. Using a real-world network analysis in M&E. 2017 Oct 17. [Internet]. Available from:
network to model localized COVID-19 control strategies. Nat https://www.irex.org/insight/visualizing-what-connects-us-social-
Med 2020;26(10):1616–22. https://doi.org/10.1038/s41591-020- network-analysis-me
1036-8
16. Kang U, Papadimitriou S, Sun J, Tong H. Centralities in large
7. Moody J. Race, school integration, and friendship segregation networks: algorithms and observations. 2011. In: Proceedings of
in America. Am J Sociol 2001;107(3):679–716. https://doi. SIAM International Conference on Data Mining. https://epubs.
org/10.1086/338954 siam.org/doi/abs/10.1137/1.9781611972818.11
8. Navarro RA, Barbarasa E, Thakkar A. Addressing workforce 17. Perry BL, Pescosolido BA, Borgatti SP. Egocentric
needs by disrupting traditional industry–higher education network analysis: foundations, methods, and models.
relations: the case of El Salvador. Ind High Educ 2019;33(6):391– Volume 44. Cambridge University Press; 2018. https://doi.
402. https://doi.org/10.1177/0950422219875886 org/10.1017/9781316443255
9. Sandström A, Carlsson L. The performance of policy networks: 18. Snijders TA, Baerveldt C. A multilevel network study of the effects
the relation between network structure and network performance. of delinquent behavior on friendship evolution. J Math Sociol
Policy Stud J 2008;36(4):497–524. https://doi.org/10.1111/j.1541- 2003;27(2–3):123–51. https://doi.org/10.1080/00222500305892
0072.2008.00281.x
10. Hertz JC, Brinkerhoff DW, Bush R, Karetji P. Knowledge systems:
evidence to policy concepts in practice. Research Triangle Park
(NC): RTI Press; 2020. https://doi.org/10.3768/rtipress.2020.
pb.0024.2006
RTI Press: Research Brief 8 RTI Press Publication No. RB-0026-2105. Research Triangle Park, NC: RTI Press.
https://doi.org/10.3768/rtipress.2021.rb.0026.2105SNA for International Development
Annex. Frequently Asked Questions Concerning Social Network Analysis
What software programs are popular for SNA? Is there a minimum sample size required for SNA?
Many standalone software programs for SNA have a graphical Data collection considerations are highly dependent on the type of
user interface and do not require programming experience. SNA analysis planned. The most popular SNA design is the whole
Some popular options of this type include Gephi and Ucinet. network or “network census” approach that assumes all members
Additionally, most statistical programming languages include of a population of interest are represented in your data. In practice,
packages, libraries, or modules for SNA. Currently, among open- defining the population and relevant network boundaries can be
source options, R and Python have particularly good SNA support. challenging, and the approach requires high response rates, unless
A popular choice for Microsoft Excel users is NodeXL, a feature-rich additional assumptions can be made about the missing data. Other
Excel add-in for SNA. SNA designs have different sample considerations that reflect
the types of data collected and research questions of interest. For
How computationally intensive is SNA? example, egocentric network analysis has the actor as the unit of
SNA tends to be more computationally intensive than traditional analysis and therefore has the same sample size considerations
statistical methods, as many of the core algorithms do no scale as traditional statistical analyses.17 Multiple network designs,
linearly with network size.16 For example, betweenness centrality which compare network metrics across many mutually exclusive
requires computing the shortest paths between all pairs of actors, networks (e.g., classrooms), have sample size considerations similar
which exhibits cubic growth with network size. Creating efficient to multilevel regression modeling,18 where both individual- and
network algorithms and ways of calculating SNA metrics in parallel group-level sample sizes are important. Conversations between
are active areas of research. However, for most network studies stakeholders and social network researchers can often help clarify
using survey responses, the networks are generally not large these requirements before data collection.
enough to create excessive computational burden. For example,
we analyzed the case studies presented in this paper using a Where can I take a class on SNA?
consumer-grade laptop. If researchers know they will be collecting The sociology departments of large universities typically offer SNA
a large amount of network data from administrative, bibliographic, classes. Faculty in schools of social sciences, medicine, business,
or social media records, additional computational resources or communication, or public health in dedicated centers, such as
careful choice of algorithms may be required to efficiently perform Duke University’s Network Analysis Center, may also offer such
SNA. classes. A good place to start is by looking at the course catalog
of your local university or a directory of graduate programs from
a professional society such as the International Network for Social
Network Analysis. If in-class instruction is not available in your
location, platforms such as Coursera or EdX offer several SNA
massive online open courses (MOOCs).
RTI Press: Research Brief 9 RTI Press Publication No. RB-0026-2105. Research Triangle Park, NC: RTI Press.
https://doi.org/10.3768/rtipress.2021.rb.0026.2105SNA for International Development
About the Authors
Eric M. Johnson, PhD, is the research director of the Governance and Youth
Economic Opportunities division.
Robert Chew, MS, is a research data scientist in the Center for Data Science at
RTI.
RTI Press Associate Editor
Barbara Biesecker
Acknowledgments
The authors acknowledge the collaboration of Jim Moody, Maria Cristina Ramos
Flor, and Joe Quinn of Duke University, and Reina Duran of RTI on the El Salvador
research, and Pingkan Umboh of Knowledge Sector Initiative, Wayan Suriastini
of SurveyMETER, and Olga Khavjou, Alan O’Connor, and Lena Leonchuk of RTI
on the Indonesia research. We thank Jana Hertz, Sarah Frazer, and Noah Flessel
for their reviews
Cover Photo: Dewi Fortuna Anwar of the Indonesia Institute of Sciences listens to Allaster
Cox, Charge d’Affaires of the Australian Embassy, during a KSI policy dialogue.
Photo credit: Leander Gemilang Aswendro.
RTI Press Research Briefs and Policy Briefs are scholarly essays on policy,
methods, or other topics relevant to RTI areas of research or technical focus.
RTI International, 3040 East Cornwallis Road, PO Box 12194
Research Triangle Park, NC 27709-2194 USA
+1.919.541.6000 rtipress@rti.org www.rti.org
© 2021 RTI International. RTI International is a trade name of Research Triangle
Institute. RTI and the RTI logo are U.S. registered trademarks of Research Triangle
Institute.
This work is distributed under the terms of a Creative Commons
Attribution-NonCommercial-NoDerivatives 4.0 license (CC BY-
NC-ND), a copy of which is available at https://creativecommons.org/licenses/
by-nc-nd/4.0/legalcode
www.rti.org/rtipress
RTI Press: Research Brief 10 RTI Press Publication No. RB-0026-2105. Research Triangle Park, NC: RTI Press.
https://doi.org/10.3768/rtipress.2021.rb.0026.2105You can also read