COVID-19 and Non-Pharmaceutical Interventions: Research ...
←
→
Page content transcription
If your browser does not render page correctly, please read the page content below
COVID-19 and Non-Pharmaceutical Interventions:
 The Greek Paradigm

 Amaryllis Mavragani1,* and Konstantinos Gillas2
 1
 Department of Computing Science and Mathematics, Faculty of Natural Sciences,
 University of Stirling, Stirling, FK9 4LA, Scotland, UK;
 Tel.: +44 (0) 7523782711. Email: amaryllis.mavragani1@stir.ac.uk
 2
 Department of Business Administration, University of Patras, Greece; gillask@upatras.gr

Abstract
Due to the COVID-19 pandemic originating in China in December 2019, apart from the grave
concerns on the exponentially increasing casualties, the affected countries are called to deal
with severe repercussions in all aspects of everyday life; from economic recession to national
and international movement restrictions. Several regions managed to handle the pandemic
more successfully than others in terms of life loss, while ongoing heated debates as to the
right course of action for battling COVID-19 have divided the academic community as well as
public opinion. To this direction, in this paper, an autoregressive COVID-19 prediction model
with heterogeneous explanatory variables is proposed for Greece, taking past COVID-19 data,
non-pharmaceutical interventions (NPIs), and Google query data as independent variables,
from the day of the first confirmed case -February 26th- to the day before the announcement
for the quarantine measures’ softening -April 24th. The analysis indicates that the early
measures taken by the Greek officials positively affected the flattening of the curve, with
Greece having recorded significantly decreased COVID-19 casualties compared to other
countries. In specific, the prediction model identifies not only the seven-day lag that is needed
in order for the measures’ results to actually show, that is, in sense, the optimal time-
intervention framework for managing the disease’s spread, but the appropriate point during
the disease spread where restrictive measures should be applied. Present results have
significant implications for effective policy making and in the designing of the NPIs, as the
second wave of COVID-19 is expected in fall 2020, and such multidisciplinary analyses are
crucial in order to understand the evolution of the Daily Deaths to Daily Cases ratio along with
its determinants as soon as possible, for the assessment of the respective domestic health
authorities’ policy interventions as well as for the timely health resources allocation.

Keywords: coronavirus; COVID-19; disease surveillance; internet behavior; non-
 pharmaceutical interventions; predictability analysis

 1
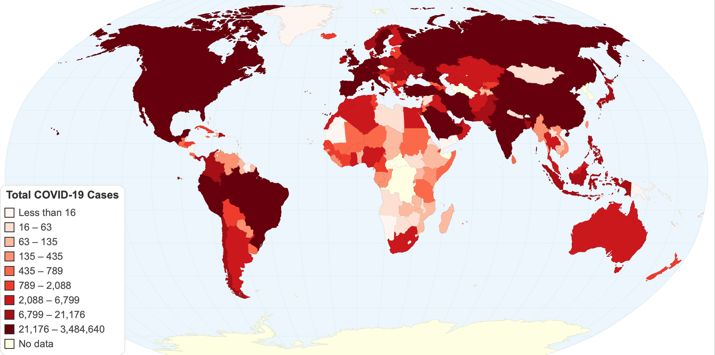
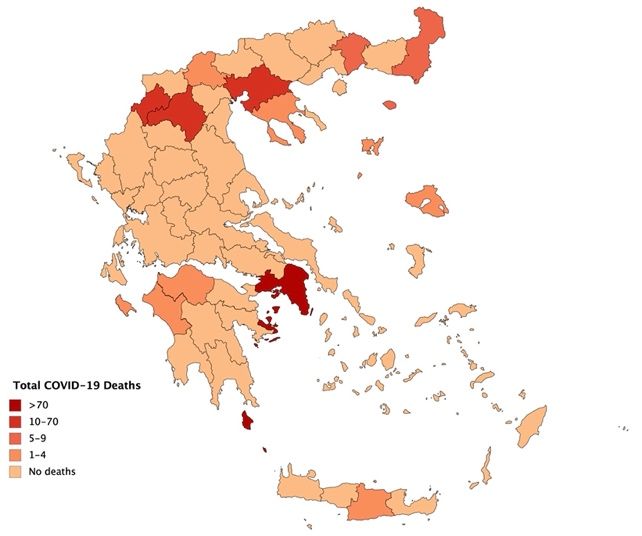
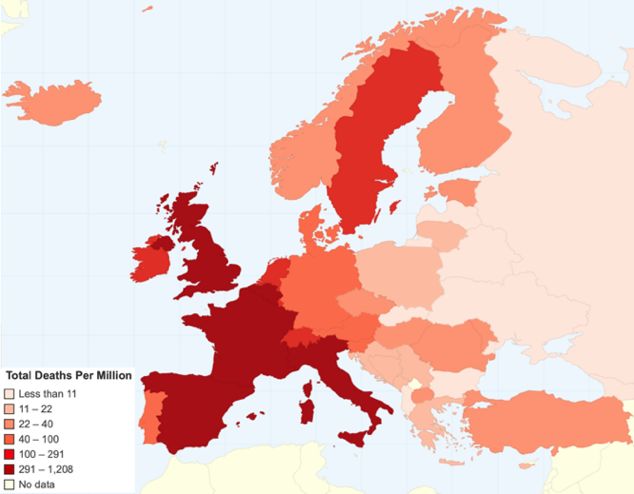
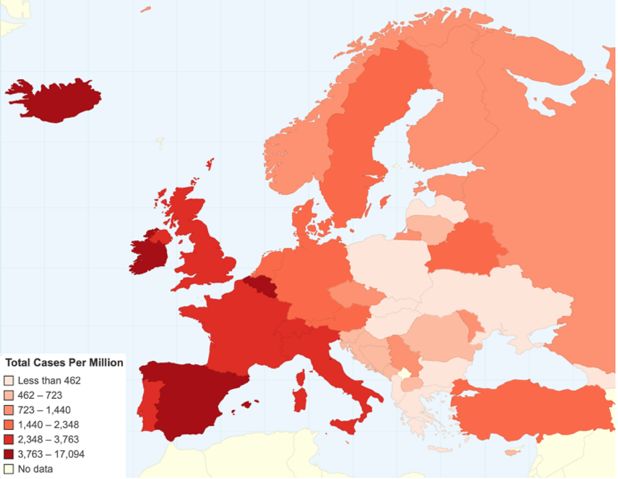
Introduction
In December 2019, a novel coronavirus that causes severe acute respiratory syndrome (SARS)
is detected in Wuhan, China.1-2 The coronavirus is of unknown origin, though there are
suggestions pointing to a wet market in said region as per the virus’ emergence.3 With WHO
declaring the new coronavirus disease -officially COVID-19 as of February 11th-4 a pandemic
on March 11th, 2020,5 and after most countries having been affected, the importance of taking
immediate action becomes evident.
 To this direction, flattening the curve and exploring novel approaches in dealing with
COVID-19 spreading is what has been the first priority over the past two months. Italy, being
the first negative example of the impact of said disease in Europe, alarmed the rest of the
countries to adopt certain non-pharmaceutical interventions (NPIs), including a chain of
preventive and movement restrictive measures in order to avoid the spreading of the virus.
However, certain regions decided on alternative routes (e.g. Sweden6), possibly aiming at
herd immunity and in minimizing the COVID-19’s social and economic impact.
 Heated ongoing discussions and debates are dividing the scientific community and the
public, as to which approach should be followed in order to combat COVID-197-8. Following
Italy’s disaster, where daily deaths first surpass 300 mid-March and keep these levels for all
but two days until the end of April and with a record of 919 on March 27th,9 it is evident that
COVID-19 is not that easy to handle as seemed at first.
 Several approaches are identified, mainly those of mass population testing, like South
Korea and Germany11, early closing of borders and movement restrictions like in Slovakia12-
 10
13
 , and few light measures, like Sweden6. Figure 1 depicts the cumulative cases and deaths,
and Figure 2 depicts the total cases and total deaths per million in Europe up to May 3rd, 2020.

 (a) (b)
 Figure 1. Cumulative worldwide COVID-19 (a) cases and (b) deaths.

 As countries have different populations and different approaches to testing in order
to identify cases, the best available measure for comparison is deaths per million. This
redaction is done only for the purposes of the comparison in this case, as several other factors
can affect the number of deaths, as, for example, the population density in certain regions,
the weather, the population age, geographical location, open borders, flights per day, or
diversity in terms of socioeconomic conditions.
 Table 1 consists of the days between the first confirmed case and the first confirmed
death, as well as deaths per million as of May 3rd, 2020, for the EU countries UK, Norway, and
Switzerland. Malta is not included in the list, as it has reported no deaths.

 2
(a) (b)
 Figure 2. Total COVID-19 (a) cases and (b) deaths per 1 million in Europe.

 Table 1. First case & death, and deaths per million for the examined Europe countries.
 Deaths Deaths
Country 1st case 1st death Country 1st case 1st death
 per million* per million*
Belgium** D1 D11 670 Slovenia D1 D11 45
Spain*** D1 D25 537 Romania D1 D26 40
Italy D1 D23 475 Finland***** D1 D25 40
UK D1 D7 414 Estonia D1 D28 40
France D1 D22 379 Norway D1 D16 39
Netherlands D1 D9 291 Hungary D1 D12 35
Sweden**** D1 D15 264 Czech Rep. D1 D22 23
Ireland D1 D12 260 Croatia D1 D24 19
Switzerland D1 D10 204 Poland D1 D9 18
Luxembourg D1 D12 147 Lithuania D1 D24 17
Portugal D1 D15 100 Greece D1 D16 14
Denmark D1 D17 82 Cyprus D1 D13 12
Germany D1 D42 81 Bulgaria D1 D5 10
Austria D1 D17 66 Latvia D1 D33 8
Slovenia D1 D27 45 Slovakia D1 D27 4
*As of May 3rd, 2020.
** For Belgium. The second confirmed case is taken into consideration, as the previous was a repatriated man
*** For Spain, the first death was a traveler from Nepal and was diagnosed post-mortem, so the 2nd death is taken into consideration.
****For Sweden, the second case is counted, as the first was an individually identified case on January 31st about an isolated case of a traveler returning from Wuhan.
*****For Finland, the second case is considered, as the first was a Wuhan traveler one month before.

 A very important question that should be addressed soon in order for the world to be
ready for the second COVID-19 wave next fall14-15, is that of identifying the appropriate course
of action in battling COVID-19. To this end, we investigate one of the most internationally
discussed EU cases, that of Greece16-19; a country that managed to successfully deal with the
first COVID-19 wave, as shown in Figure 2 and Table 1.
 What made the Greek case successful in dealing with the pandemic in terms of
casualties and in maintaining the state of its national health care system during the pandemic,
was that the Greek officials adopted NPIs at a very early stage; schools closed just one day
after WHO declared COVID-19 a pandemic on March 11th and while the country had recorded
less than 100 confirmed cases and no casualty -the first death was recorded the next day.
 While most approaches on exploring COVID-19 predictability focus on previously
confirmed COVID-19 case data, this approach also investigates the role of non-pharmaceutical
interventions (NPIs) along with query data from Google, in order to elaborate on the

 3
multidisciplinarity of combining various surveillance variables and methods. The rest of the
paper is structured as follows: Section 2 consists of the detailed description of the data
collection procedure and predictive analysis for the COVID-19 prediction model, while in
Sections 3 and 4, the results are presented and discussed, respectively.

Methods
COVID-19
Worldwide and Europe data on COVID-19 cases and deaths are retrieved from the
Worldometers platform20. Greek cases, deaths, and active data are retrieved from the same
platform, while data for the geographical distribution of cases and deaths in Greece are
retrieved from COVID-19’s page on the official governmental platform21. Maps were created
with Chartsbin and Mapcharts22-23. The selected timeframe is from February 26th to April 24th,
as these two dates mark important milestones; first confirmed case and end-of-quarantine
announcement, respectively.

Non-Pharmaceutical Interventions (NPIs)
Since no official COVID-19 cure exists, and as the vaccine is not yet available and could be
more than a year before it is ready for public distribution, NPIs, as, for example, house
quarantine or international flights restrictions are required in order to monitor and minimize
disease spreading. The timely adoption of such measures is what made the Greek case that
successful, and the statistical significance of the days of adoption are explored order to
elaborate on the importance of NPIs.
 Greek officials immediately acted on adopting preventive measures for the spread of
the disease, with the first NPI being announced along with WHO declaring COVID-19 a
pandemic on March 11th, and, effective as of March 12th, ordered the closing of all schools
and universities24. Retail shops, gyms, cafes, restaurants, etc., followed over the next days25-
26
 , while less than two weeks later, on March 23rd, strict movement measures took place,
including house quarantine, and special forms and SMS for all forms of movement27. On
March 12th and March 25th, two villages in the Kozani and one in the Xanthi Prefectures were
put under complete lockdown, respectively28-29, while the two major cities close by were also
put in special quarantine measures -but not complete lockdown- on March 31st .30-31 Said cities
exhibit increases COVID-19 cases and deaths compared to other Prefectures.

Google Trends
Several approaches in monitoring and analysis several epidemiological characteristics of the
virus have been recorded up to this point using Google Trends data.32-35 Google Trends is an
open online tool that provides information on the behavior towards selected topics and
keywords. Such infodemiology variables can accurately measure the users’ online search
patterns, and, in this case, assist with exploring the public’s perception and interest towards
COVID-19 over the examined period.
 In this paper and in line with the Google Trends Methodology Framework in
Infodemiology and Infoveillance36, normalized Google Trends data were retrieved on a
sequence of Google queries from February 26th, which is the date for recording of the first
confirmed COVID-19 case in the country, up to April 24th, which is the day before the
announcement of the softening of the quarantine measures.

 4
Google Trends is not case sensitive, but it does take into account accents, special
characters, and misspellings. Greek is a rather complicated language in terms of accents and
spelling, and the spelling of the word of coronavirus had not been definite. To that end, and
to ensure that the majority of coronavirus searches were included in the analysis, the
following procedure for the selection of the examined keywords was followed.
 At first, there existed four differently spelled terms to express coronavirus, i.e.,
“Κορωνοιός”, “Κορωναιός”, “Κορονοιός”, and “Κοροναιός”, with all terms including accents.
Each term was compared to itself without the accent in Google, and all cases exhibited non-
significant results for the terms with the accents. As the terms “Κορωναιός” and Κοροναιός”,
though used during the first days of the epidemic, were quickly “abandoned” by the experts,
media, and public, they exhibit significantly less interest, and thus not included in further
analysis. Therefore, the Greek terms “Κορωνοιος” and “Κορονοιος” were selected at this
stage and, in order to also include searches conducted in English, “Coronavirus (search term)”
was also added in the analysis, i.e., data for the “κορωνοιος+κορονοιος+coronavirus”
sequence of search terms were retrieved for the Google query data variable.

Predictability analysis
In this paper, a predictability analysis for COVID-19 Daily Deaths and Daily Cases ratio in
Greece is performed; the prediction model is based on an autoregressive model with
heterogeneous explanatory variables ( − ). This proposed model is constructed in
order to incorporate and study short-term and long-term effects of predictors that are crucial
for the assessment of the duration and the effectiveness of an intervention policy. In spite of
the simplicity of the model, we find that it successfully achieves to predict the COVID-19 Daily
Deaths and Daily Cases ratio.
 (#)
 In particular, let ! be the dependent variable constructed as the between Daily
Deaths and Daily Cases, %,! , with = 1, 2, 3 denoting the explanatory variables and =
1, … , , with being the respective number of observations. The dependent variable exhibits
a series of statistical properties that pose serious challenges to standard statistical models
(e.g. autoregressive fractionally integrated moving average models). For example, the
autocorrelations of the square and absolute values of Daily Deaths and Daily Cases ratio
display large-memory that last for long periods of time (e.g. weeks), while it is expected that
its determinants will influence it after a long period of a random time.
 Despite that the widely used models in the existing literature use infinite-dimension
restrictions to infinite variable lags in order to be able to obtain long memory, many
observations are lost because of the not time-effective build-up period for the fractional
difference operator.37 However, for cases as the one explored in our study, there is a limited
number of observations, as the statistical understanding is crucial to be developed over a
restricted short-term period. In sense, delays could be measured in number of casualties.
What is more, such models capture the so-called unifractal scaling behavior and not the
multiscaling behavior (i.e., when the data exhibits patterns which are repeated at different
time scales or scaling laws). Such scaling-type regularities can provide useful information for
modeling and forecasting a phenomenon.
 The model developed during the implementation of this study has a simple
autoregressive structure, yet with the feature of considering explanatory variables over
different interval sizes. The ( ) − model heterogeneous is given by:

 5
) + +
 (#) (#) (+) (#) (+) (#)
 !'( = + 7 % %,! + ( 9 ,( 7 (,(!,-),+ ; + / 9 ,( 7 /,(!,-),+ ;
 %*( -*. -*.
 + 1
 (+) (#) (#) (#) (#)
 + ) 9 ,( 7 ),(!,-),+ ; + 7 0 (!'(),0 + !,+ + !'(
 -*. 0*(

where is the constant term, ( ) denotes the data frequency (i.e., daily data frequency) and
 is the dummy variable that is equal to one (1) for the day that an event occurs (e.g. a
restriction imposed), and zero otherwise, while ( ) denotes longer aggregation periods. The
selection of ( ) is data driven. In this predictability analysis, we make use of longer
aggregation periods than one day, as we allow the ( ) to varies over a fixed number of lags.
 This data driven method allows us to find the optimal number of days passed for
assessing past events that may influence the dependent variable in the future. It allows us to
examine not only the effectiveness of the imposed measures via a strict statistical analysis,
but the optimal intervention framework so that such situations are predicted as well.
 In sense, explanatory variables viewed over different time horizons are considered,
which, in turn, permit for direct comparison among quantities defined over various time
horizons. This is of high significance, as it indicates how much time -in which case, days- policy
makers have at their disposal in order to determine the last time-point which will allow them
to act, how long such imposed measures should be in place, how the latter will be evaluated,
etc. In fact, the explanatory variables are multiperiod quantities that are normalized sums of
the one-period quantities (i.e., a simple average of the daily quantities).
 Table 2 consists of the description of the dependent and explanatory (independent)
variables used in this study.

 Table 2. Descriptions of the dependent and independent variables.
 Variable Description
 Ratio between Daily Deaths and Daily Cases
 ! Ratio between Deaths and Cases*
 " Ratio between Recovered and Active**
 # Google Trends
 Dummy for Restrictive measures
* Refers to total deaths and total cases
** Refers to total active and total recovered
Notes. In order to explore the relationship between the dependent and the independent variables and to avoid spurious
regression results with non-stationary times series, the Augmented Dickey-Fuller (ADF) test38-39 and the Phillips–Perron (PP)
test40 were used. In the case where the null hypothesis of non-stationarity (i.e., the series has a unit root) cannot be rejected,
the first differences of the series is constructed.

 Studying the interrelations of the dependent variables measured over different time
horizons, the dynamics of the different components of a system can be revealed. It is
expected that innervations or infections over longer time intervals have a stronger influence
on the Daily Deaths and Daily Cases ratio over shorter time intervals. Furthermore, the
interpretation of the proposed model is must simpler than an autoregressive model with non-
heterogenous explanatory variables taking a very large number of lags. As already mentioned,
standard models employed in the literature, while possibly effective in modelling the
evolution of a phenomenon that develops in an endogenous system, are not able to capture
exogenous effects that have took place a long time ago (e.g. weeks or months).

 6
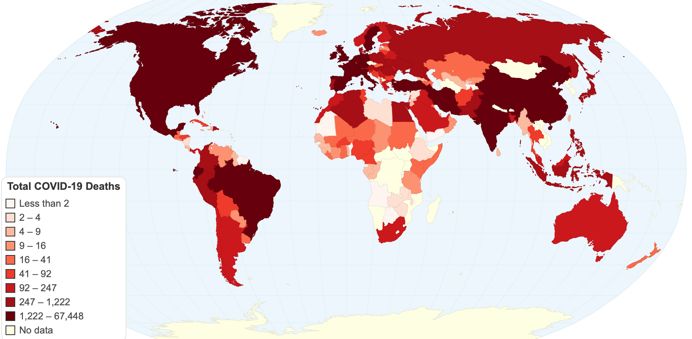
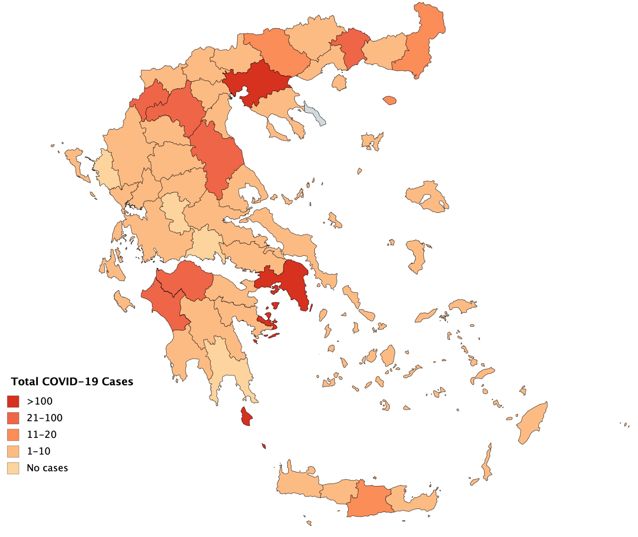
Results
Greece records its first confirmed case on February 26th, its first death on March 12th, and
imposes strict quarantine as of March 23rd. On April 25th, the Prime Minister, Kyriakos
Mitsotakis, in a public address to the Greek citizens, announces the softening of the
quarantine measures as of May 4th, with some retail shops restarting operation and schools
opening within the week. Special commuting forms and SMS are no longer required, and
citizens are allowed to freely move within their Prefecture.
 The geographical distribution of the COVID-19 (a) cases and (b) deaths is depicted in
Figure 3. Up to May 3rd (4pm) the country has recorded 2,620 cases, 143 deaths, while 1374
COVID-19 patients are recovered. Note that some COVID-19 cases are not included Fig4a, as
they do not have a geographical location (e.g., ship personnel or passengers). As is evident,
Greece, with approximately a population of 10.7 million (approx. 3.8 of which in Attica),
managed to well contain the disease spread.

 (a) (b)
 Figure 3. Cumulative COVID-19 (a) cases and (b) deaths in Greece as of May 3rd.

 Figure 3b shows that most of the Greek Prefectures have recorded no deaths, while
even the most affected regions (apart from Attica) only have very few casualties. This is also
evident by several mainland Prefectures having recorded no COVID-19 case, while most have
recorded fewer than a total of ten confirmed COVID-19 cases.
 Figure 4 depicts the cumulative and daily COVID-19 cases, deaths, active, and
recovered in Greece from February 26th and April 24th, 2020, as well as the change in the
(Deaths)/(Cases) and (Active/Recovered) ratios, i.e., the times series used for the independent
variables ( and / , respectively.
 Note that on April 21st, a spike of 156 is observed in the daily cases (Fig4c); this is an
outlier to the sample, as 150 of those cases were identified in a closed refugee and immigrant
structure (hotel), located in a non-urban environment. As this spike was observed in a closed
structure, it is not indicative of the spread in the community. Another spike in daily cases is
observed on April 23rd, referring to a private health structure in the Attica Prefecture.

 7
(a) (b)

 (c) (d)

 (e) (f)
 Figure 4. Cumulative (a) cases and deaths; (b) active cases and recovered; (c) daily cases;
 (d) daily deaths; (e) deaths to cases ratio; (f) active to recovered ratio.

 Figure 5 depicts the forecasts derived by the application of the (2) − model,
and Table 3 consists of the bootstrapped coefficient estimates and standard errors of the
model. The application of bootstrap methods to regression models helps approximate the
distribution of the coefficients and the distribution of the prediction errors. In this paper, we
apply a bootstrap technique resampling by residuals in order to take into account the
presence of influential observations (some ! very far away from the others); with the
bootstrap we use an empirical distribution derived by resampling to approximate an unknown
one [41].
 The proposed model exhibits remarkably good forecasting performance for the Daily
Deaths to Daily Cases ratio, with the latter being well predicted by the selected explanatory
variables. In sense, what our prediction model shows is the optimal time intervention
framework for the flattening of the curve, in which case it is measured by the COVID-19 Daily
Deaths to Daily Cases ratio.

 8
Figure 5. Official COVID-19 data vs. Forecasts

 Table 3. Heterogeneous autoregressive model with explanatory variables (2) − .
 Panel A. Regression estimates
 Variable Coefficient Std. Error t-statistic Prob.
 c 0.030732*** (0.009801) 3.135473 [0.0033]
 (%) -0.711290*** (0.198599) -3.581536 [0.0009]
 !,#

 *
 3.829134*** (0.536053) 7.143197 [0.0000]
 '( (%)
 7 # (,(#'))'*
 )+,

 *
 2.509127*** (0.736212) 3.408159 [0.0015]
 '( (%)
 7 # !,(#'))'*
 )+,

 *
 -0.003312* (0.001755) -1.887019 [0.0666]
 (%)
 7'( # -,(#'))'*
 )+,

 (%) -0.035046** (0.017100) -2.049438 [0.0472]
 #'*

 (%) 0.320404*** (0.101509) 3.156401 [0.0031]
 (#.()'(

 (%) 0.056718 (0.098270) 0.577167 [0.5671]
 (#.()'!

 Panel B. Model specification
 Adjusted R-squared 0.597701

 Akaike information criterion -3.329188
Notes. ***, **, and * denote statistical significance at 1%, 5% and 10%, respectively. Bootstrapped coefficient estimates and
standard errors via (2000 repetitions). The final optimal number of (w) and (k) are selected according to the Akaike
information criterion. The variance inflation factor (VIF) is used in order to deal with multicollinearity issues among the
regressors. Regressors with values of VIF higher than 5 are excluded from the estimation analysis.

 9
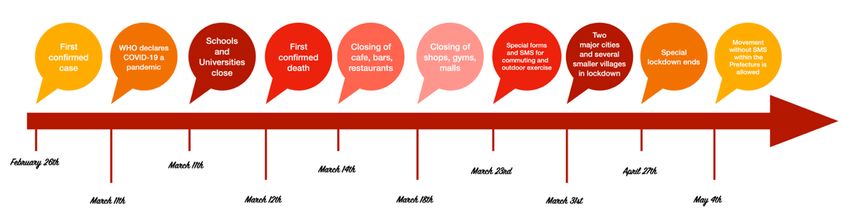
Discussion
Battling COVID-19 is the first priority in policy planning in the whole northern hemisphere at
the moment. To that end, modeling the predictability of COVID-19 in order to minimize the
spread is of great importance, at least until an effective treatment is found or a vaccine is
publicly administrated.
 In this paper, by using past COVID-19 data, an NPIs variable, and Google query data on
the coronavirus, the predictability of the Daily Deaths to Daily Cases ratio in Greece is
explored. On investigating the course of action in terms of NPIs of Greek officials in the COVID-
19 spreading, a seven-day lag after a set of restrictive measures take place is identified. This
study, apart from introducing a novel approach in the prediction of COVID-19, is a significant
addition to the literature in terms of providing the direction to the appropriate course of
action to minimize COVID-19 impact in terms of casualties and flattening the curve, as well as
identifying that point of the regional outbreak that such NPIs should take place, in order to
ensure and maximize their effectiveness.
 How did the Greek government successfully handle this epidemic? What were the key
milestones that they took into account in designing the operation? How were they distributed
in time? Figure 6 consists of a timeline with some of the most important COVID-19 points.

 Figure 6. Timeline of COVID-19 in Greece

 The Greek officials announced the closing down of all schools and universities with
having recorded just short of 100 cases, and only a day before the first official death was
recorded on March 12th; the first COVID-19 recovery was on March 13th. The next day all cafes
bars and restaurants were not allowed to seat customers, while four days later, all retail and
gyms were prohibited from allowing customers to enter their premises; retail switched to
online orders and distribution via express mail services.
 Ten days after the first death, the Prime Minister in his public address, informed the
Greek citizens that any outside activity is not permitted without certain special forms (or
SMS), while cities and villages where regional outbreaks were identified, were put under
lockdown (partial or complete). The success of the Greek case lies on the early application of
any restrictive measures, which were re-evaluated every day in order to adjust them to any
condition changes.
 Greece is one of the very few examples that can be studied in order to show and
validate what the real gain from applying such measures is, as it managed to do so at a very
early stage. Countries that did not manage to apply NPIs at their respective appropriate time-
point rather than later during the epidemic, did not minimize the spread to the point of not
having grave results. Given the easy and quick spread of the virus, it should be noted that even

 10
a 48-hour delay in applying NPIs could be very crucial. In this study, Slovakia is identified as
another successful example, and researchers from said region could apply the present
analysis, in order to further elaborate on current findings. However, Greece is a unique case,
as it is a very popular destination with many international airports that are busy throughout
the year, and it also had daily connections by sea with neighboring Italy during the first stage
of the epidemic.
 This is the first such approach, not only in terms of selection of region, but can also
assist with the assessment in policy interventions of the domestic health authorities for
regionally containing the disease and minimizing the spread. The prediction model identified
the optimal time-intervention framework in order to achieve the latter, with the NPI variable
being statistically significant for a seven-day lag. Therefore, countries that choose this course
of action, i.e., containing the virus, should approach the subject from a multidisciplinary point
of view, in order to manage (a) the softening of the measures during summer, as well as (b)
the second COVID-19 wave next fall. It is understandable that an entire country cannot shut
down when recording its first confirmed case, but what needs to be identified is this optimal
strategy between minimizing deaths and economic and social effects.
 This study has limitations. At first, a two-month period was examined with a limited
number of (daily) observations, which is, however, the case with all COVID-19 studies at this
point of the pandemic. In addition, the NPIs variable was based on observations and recording
of the events based on the authors’ experience of the events in the examined country during
the first wave of the pandemic. Finally, this prediction model takes into account four
explanatory variables, and future approaches should aim at including more -exogenous-
independent variables.
 In conclusion, in this paper a seven-day lag is identified as the optimal intervention
framework for the NPIs to come into effect, and this is what should be followed for successful
results towards minimizing COVID-19 spreading. In particular, policy makers should take into
account that NPIs that do not seem to have a positive effect on battling COVID-19 within a
week, should be revised. Predicting COVID-19 is not a one-factor variable model and calls for
multidisciplinary action. The present predictive analysis takes into account traditional health
data (i.e., COVID-19 reported cases and deaths), specific NPIs (e.g. schools closing,
lockdowns), as well as infodemiology metrics (Google query data).
 Our main target is to more effectively gain insight on the nature of NPIs and how the
latter can assist in halting the spread. This is expected to have various consequences in the
COVID-19 prediction modelling. Considering the fact that policy makers are required to make
important decisions during periods with chaotic conditions, it is vital to progress with a
statistical understanding of the COVID-19 time series behavior in accordance with its real
determinats. In sense, the approach should not be strictly medical in order to estimate robust
COVID-19 prediction models, rather than a combination of medical and non-medical
parameters from several research fields, that also take into account the citizens’ response to
the measures and the way that the latter are communicated and received by the public.

 11
References
1. World Health Organization. WHO Timeline – COVID-19. URL: https://www.who.int/news-
 room/detail/08-04-2020-who-timeline---covid-19
2. World Health Organization. Twitter account. URL:
 (https://twitter.com/WHO/status/1213523866703814656?s=20
3. World Health Organization. Pneumonia of unknown cause. URL:
 https://www.who.int/csr/don/05-january-2020-pneumonia-of-unkown-cause-
 china/en/
4. Naming the coronavirus disease (COVID-19) and the virus that causes it. URL:
 https://www.who.int/emergencies/diseases/novel-coronavirus-2019/technical-
 guidance/naming-the-coronavirus-disease-(covid-2019)-and-the-virus-that-causes-it
5. World Health Organization. WHO announces COVID-19 oubreak a pandemic.
 URL:http://www.euro.who.int/en/health-topics/health-emergencies/coronavirus-
 covid-19/news/news/2020/3/who-announces-covid-19-outbreak-a-pandemic.
6. Sweden’s gamble on coronavirus herd immunity couldn’t work in the US -and it may not
 work in Sweden. URL: https://www.businessinsider.com/sweden-coronavirus-strategy-
 explained-culture-of-trust-and-obedience-2020-4
7. Ferguson N, Laydon D, Nedjati-Gilani G, Imai N, Ainslie K, Baguelin M, et al. Impact of
 non-pharmaceutical interventions (NPIs) to reduce COVID- 19 mortality and healthcare
 demand. Imperial College London 2020 Mar 16.
8. Ioannidis John. A fiasco in the making? As the coronavirus pandemic takes hold, we are
 making decisions without reliable data. StatNews.
 https://www.statnews.com/2020/03/17/a-fiasco-in-the-making-as-the-coronavirus-
 pandemic-takes-hold-we-are-making-decisions-without-reliable-data/
9. COVID-19 in Italy. URL: https://www.worldometers.info/coronavirus/country/italy/
10. The Guardian. Test, trace, contain: how South Korea flattened its coronavirus curve. URL:
 https://www.theguardian.com/world/2020/apr/23/test-trace-contain-how-south-
 korea-flattened-its-coronavirus-curve
11. BBC News. Coronavirus: What can the UK learn from Germany on testing? URL:
 https://www.bbc.com/news/health-52234061
12. Measures to prevent the spread of COVID-19 in the Slovak Republic. URL:
 https://www.mfa.gr/missionsabroad/images/stories/missions/slovakia/2020/anakoinos
 i_slovakikou_ypourgeiou_eksoterikon__measures_to_prevent_the_spread_of_COVID.p
 df
13. Ministry of Foreign and European Affairs of the Slovak Republic. CORONAVIRUS DISEASE.
 URL: https://www.mzv.sk/web/en/covid-19
14. Osterholm MT et al. (April 30, 2020) COVID-19. The CIDRAP Viewpoint.
 https://www.cidrap.umn.edu/sites/default/files/public/downloads/cidrap-covid19-
 viewpoint-part1_0.pdf
15. The business insider. The coronavirus pandemic could last up to 2 years, according to US
 experts. They predict we may see a 2nd, larger wave of infections this fall. URL:
 https://www.businessinsider.com/coronavirus-pandemic-could-last-2-years-resurge-in-
 fall-2020-5
16. TIME. Greece Has an Elderly Population and a Fragile Economy. How Has It Escaped the
 Worst of the Coronavirus So Far? URL: https://time.com/5824836/greece-coronavirus/

 12
17. BBC News. Coronavirus: Greece and Croatia acted fast, now need to save summer. URL:
 https://www.bbc.com/news/amp/world-europe-52491204
18. CNN. Greece dodged Covid-19. Now it wants tourists. URL:
 https://edition.cnn.com/videos/world/2020/05/05/greece-coronavirus-nic-
 robertson.cnn
19. Guardian: Greece plans to issue Covid-19 immunity certificates for tourism.URL:
 https://www.tornosnews.gr/en/greek-news/39910-guardian-greece-plans-to-issue-
 covid-19-immunity-certificates-for-tourism.html
20. Worldometers. COVID-19 Coronavirus Pandemic. URL:
 https://www.worldometers.info/coronavirus/
21. Regional cumulative COVID-19 data on cases and deaths. URL: https://covid-
 19.gov.gr/workbench/
22. MapChart. URL: https://mapchart.net/greece.html
23. Chartsbin. URL: http://chartsbin.com
24. Temporary closing of Schools and Universities (In Greek) URL:
 https://www.taxheaven.gr/circulars/32497
25. Coronavirus: Closing of malls, restaurants, cafes, hair salons, and bars (list) (in Greek).
 URL:https://www.skai.gr/news/greece/kanonika-tha-leitourgoun-trapezes-katastimata-
 kai-souper-market.
26. Coronavirus: Governmental decision on business’ closing (list) (in Greek).
 https://www.lawspot.gr/nomika-nea/koronoios-dimosieythike-i-apofasi-gia-kleisimo-
 epiheirison-analytika-i-lista
27. Forma.gov.gr and 13033: The platform for the special forms. URL:
 https://www.dikaiologitika.gr/eidhseis/koinonia/292579/forma-gov-gr-kai-13033-i-
 platforma-gia-to-entypo-dilosis-metakinisis
28. Lockdown in Damaskinia-Dragasia. All suspect symptoms are tested (in Greek).
 URL:https://www.megatv.com/megagegonota/article.asp?catid=27369&subid=2&pubi
 d=38560225
29. Coronavirus: lockdown in Echinos, Xanthi, with a population of 3000. What alarmed the
 authorities (in Greek). URL: https://www.skai.gr/news/greece/koronoios-karantina-
 ston-exino-ksanthis-ton-3000-katoikon-ti-anisyxise-tous-eidikous
30. Coronavirus: 14-day quarantine-restrictions in five mulicipalities (in Greek). URL:
 https://www.skai.gr/news/greece/koronoios-xardalias-se-karantina-14-imeron-o-
 dimos-mesopotamias-kastorias
31. New movement restrictions in Xanthi municipality (in Greek). URL:
 https://www.cityofxanthi.gr/enimerosi/nea/press/21958-νέοι-περιορισμοί-
 κυκλοφορίας-στον-δ-ξάνθης
32. Mavragani A. Tracking COVID-19 in Europe: Infodemiology Approach. JMIR Public Health
 Surveill 6(2), e18941 (2020).
33. Mavragani A, Gkillas K. On the predictability of COVID-19 in USA: A Google Trends
 analysis. Under Review (2020).
34. Yuan X, Xu J, Hussain S, Wang H, Gao N, Zhang L. Trends and Prediction in Daily New Cases
 and Deaths of COVID-19 in the United States: An Internet Search-Interest Based Model.
 Explor Res Hypothesis MeD 5(2), 1–6 (2020).
35. Hong YR, Lawrence J, Williams DJ, Mainous A. Population-Level Interest and Telehealth
 Capacity of US Hospitals in Response to COVID-19: Cross-Sectional Analysis of Google
 Search and National Hospital Survey Data JMIR Public Health Surveill 6(2), e18961 (2020).

 13
36. Mavragani A, Ochoa G (2019) Google Trends in infodemiology and infoveillance:
 methodology framework. JMIR Public Health Surveill 5(2), e13439 (2019).
37. Corsi F. A simple approximate long-memory model of realized volatility. Journal of
 Financial Econometrics, 7(2), 174-196 (2009).
38. Dickey D, Fuller W. Distribution of the Estimators for Autoregressive Time Series with a
 Unit Root. Journal of the American Statistical Association. 74, 427-431.
39. Dickey D, Fuller W. Likelihood Ratio Statistics for Autoregressive Time Series with a Unit
 Root. Econometrica, 49, 1057-1072 (1981).
40. Phillips PCB, Perron P. Testing for a Unit Root in Time Series Regression. Biometrika. 75
 (2), 335–346 (1988).
41. Efron B. Bootstrap methods: another look at the jacknife”. Annals of Statistics 7, 1-26
 (1979).

Author Contributions

A.M. conceived the idea; A.M. and K.G. designed the methodology; A.M. performed the data collection
and analysis; K.G. performed the statistical analysis; A.M. and K.G. interpreted the data; A.M. wrote the
paper. Both authors reviewed the manuscript.

Conflict of Interest

The authors declare no conflicts of interest.

Data Availability

All data used in the analysis are open and publicly available in the cited sources.

Funding

No funding.

 14
You can also read