Influence of Absolute Humidity, Temperature and Population Density on COVID-19 Spread and Decay Durations: Multi-Prefecture Study in Japan - MDPI
←
→
Page content transcription
If your browser does not render page correctly, please read the page content below
International Journal of
           Environmental Research
           and Public Health

Article
Influence of Absolute Humidity, Temperature and
Population Density on COVID-19 Spread and Decay
Durations: Multi-Prefecture Study in Japan
Essam A. Rashed 1,2 , Sachiko Kodera 1 , Jose Gomez-Tames 1,3 and Akimasa Hirata 1,3, *
 1    Department of Electrical and Mechanical Engineering, Nagoya Institute of Technology,
      Nagoya 466-8555, Japan; essam.rashed@nitech.ac.jp (E.A.R.); kodera@nitech.ac.jp (S.K.);
      jgomez@nitech.ac.jp (J.G.-T.)
 2    Department of Mathematics, Faculty of Science, Suez Canal University, Ismailia 41522, Egypt
 3    Center of Biomedical Physics and Information Technology, Nagoya Institute of Technology,
      Nagoya 466-8555, Japan
 *    Correspondence: ahirata@nitech.ac.jp; Tel.: +81-52-735-7916

 Received: 16 June 2020; Accepted: 23 July 2020; Published: 24 July 2020

 Abstract: This study analyzed the spread and decay durations of the COVID-19 pandemic in different
 prefectures of Japan. During the pandemic, affordable healthcare was widely available in Japan
 and the medical system did not suffer a collapse, making accurate comparisons between prefectures
 possible. For the 16 prefectures included in this study that had daily maximum confirmed cases
 exceeding ten, the number of daily confirmed cases follow bell-shape or log-normal distribution
 in most prefectures. A good correlation was observed between the spread and decay durations.
 However, some exceptions were observed in areas where travelers returned from foreign countries,
 which were defined as the origins of infection clusters. Excluding these prefectures, the population
 density was shown to be a major factor, affecting the spread and decay patterns, with R2 = 0.39
 (p < 0.05) and 0.42 (p < 0.05), respectively, approximately corresponding to social distancing. The
 maximum absolute humidity was found to affect the decay duration normalized by the population
 density (R2 > 0.36, p < 0.05). Our findings indicate that the estimated pandemic spread duration, based
 on the multivariate analysis of maximum absolute humidity, ambient temperature, and population
 density (adjusted R2 = 0.53, p-value < 0.05), could prove useful for intervention planning during
 potential future pandemics, including a second COVID-19 outbreak.

 Keywords: COVID-19; temperature; absolute humidity; population density; spread and
 decay durations

1. Introduction
     Outbreaks of the infectious coronavirus disease of 2019 (COVID-19) have been reported
worldwide [1,2]. In response, numerous studies on COVID-19 have been conducted on different
aspects, including disease prevention, control, diagnosis, causes, and epidemiology [3]. A state of
emergency was declared in 7 of Japan’s 47 prefectures on 7 April 2020. This state of emergency
was extended nationwide on 16 April and ended on 25 May 2020. During this state of emergency,
people voluntarily self-isolated and no government-enforced lockdown of the prefectures (districts)
was implemented.
     Many epidemic modeling approaches exist [4] and various mathematical models have been used
to demonstrate different aspects related to COVID-19, including serial intervals [5], transmission in
China [6], and case studies in Wuhan, China [7], Italy [8], and Spain [9]. Comparisons among different
countries have also been made [10] and the importance of different models in developing policies has

Int. J. Environ. Res. Public Health 2020, 17, 5354; doi:10.3390/ijerph17155354     www.mdpi.com/journal/ijerph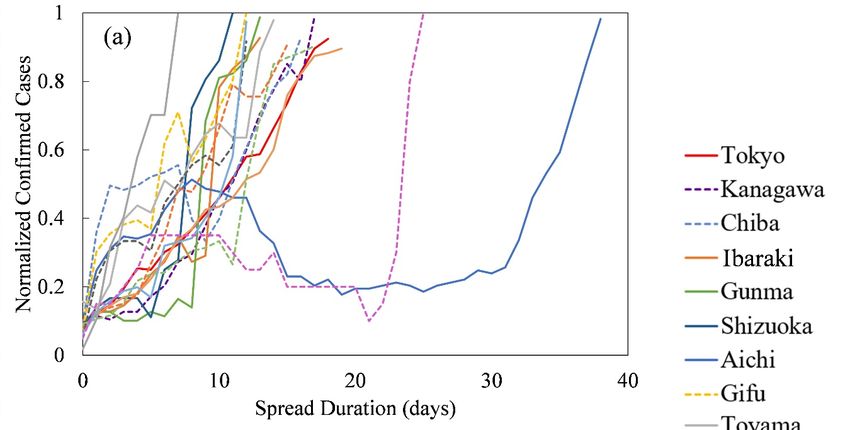
Int. J. Environ. Res. Public Health 2020, 17, 5354                                                                         2 of 14

been discussed in [11]. Regarding the COVID-19 spread in Italy, a multivariate analysis study was
conducted to evaluate the effect of different environmental factors on confirmed positive cases [12].
Three regions in Italy with high national infection rates were considered. In a time-series analysis,
different factors were evaluated within each region. Strong correlations were found with different
environmental factors, such as the average temperature, humidity, and wind speed. Although this
study addressed how these factors were correlated with confirmed COVID-19 cases, it does not discuss
their influence on disease spread and decay durations. However, it does provide a parameter fitting
model based on local data within each region. Being able to estimate the duration of the epidemic in
different prefectures would be useful for developing lockdown policies.
      The duration and morbidity rates of COVID-19, however, are not easy to compare because different
co-factors affect them. The number of polymerase chain reaction (PCR) tests, a simple and cost-effective
test conducted in Japan was limited because of its reliability; therefore, chest computed tomography
imaging was performed to obtain highly accurate diagnoses [13]. In addition, to avoid nosocomial
infections and medical resource shortages, it was suggested that people with symptoms (e.g., fever >
37.5 ◦ C for no more than four consecutive days) stay home and not seek immediate medical attention
unless they had been in close contact with infected people or had recently visited a foreign country.
Some patients have been reported to be asymptomatic [14], making the statistical study of COVID-19
more complex.
      The statistics of confirmed deaths and COVID-19 positive patients are being updated every
day in each prefecture of Japan. Furthermore, the Japanese medical system did not collapse during
the outbreak, and the health insurance system provides COVID-19 medical care for free. However,
the percentage of positive coronavirus tests ranges from 2.2 to 34.8% (Table 1) throughout Japan,
making morbidity estimations in different areas more challenging. Assuming that the criteria for
conducting a test are the same in each prefecture, the estimation of the epidemic duration provides a
useful parameter.

      Table 1. Population, area, and population density data of 19 prefectures where daily maximum cases
      of COVID-19 exceeded 10. Total cases of COVID-19 and mean percentages of the positive test cases are
      also listed.

                                                Population             Total Cases                           Percentage of
                          Population                                                       Daily Max
                                              Density (People         (Through 25                            Positive Test
                           (×1000)                                                           Cases
                                                 Per km2 )                May)                                Results (%)
         Tokyo                13,921                 6354.8                5170                206                34.8
      Kanagawa *               9198                  3807.5                1336                 94                14.7
       Saitama *               7350                  1932.0                1000                 56                 5.2
        Chiba *                6259                  1217.4                 904                 70                 6.4
        Ibaragi                2860                  470.4                 168                  28                3.7
        Gunma                  1942                   304.6                 149                44                  4.2
       Shizuoka                3644                   467.9                  75                18                  2.2
         Aichi                 7552                  1460.0                 507                 21                 5.2
        Gifu **                1987                   187.3                 150                 18                 4.4
       Ishikawa                1138                  271.7                 296                  20                11.2
        Toyama                 1044                   245.6                 227                 21                 7.3
         Osaka                 8809                  4631.0                1781                108                 6.1
       Hyogo ***               5466                   650.4                 699                57                  6.4
       Kyoto ***               2583                   560.1                358                  20                 4.6
       Shiga ***               1414                   352.0                 100                12                  5.7
      Hiroshima                2804                   331.1                 167                 51                 2.5
       Fukuoka                 5104                  1024.8                 672                108                 5.7
       Saga ****                815                   333.6                 47                  11                 3.4
       Okinawa                 1453                   637.5                  81                17                  2.9
      * Kanagawa, Saitama, and Chiba are considered adjacent prefectures of Tokyo. ** Gifu is considered an adjacent
      prefecture of Aichi. *** Hyogo, Kyoto, and Shiga are considered adjacent prefectures of Osaka. **** Saga is considered
      an adjacent prefecture of Fukuoka.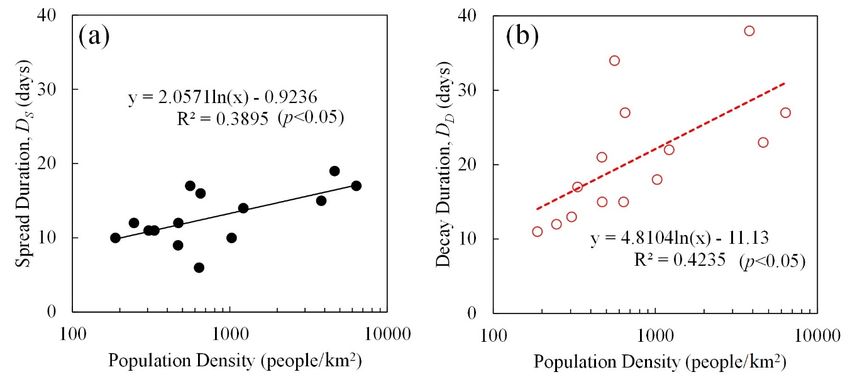
Int. J. Environ. Res. Public Health 2020, 17, 5354                                                    3 of 14

     Environmental co-factors potentially influencing COVID-19 morbidity, including ambient
temperature, absolute humidity, and air pollution, have been studied [15–22]. However, neither
these studies nor the above-mentioned modeling studies have considered the impact of population
density and ambient conditions on both the spread and decay duration [23]. In fact, the durations
were not discussed at all. The necessity of population density scaling in epidemic transmission models
has been suggested for infectious diseases in general [24], indicating that the factors characterizing the
spread and decay durations might be different. Recent studies have confirmed the effect of temperature
and relative humidity on morbidity rates in Brazil [22,25] and the morbidity/mortality rates in Japan [26].
Studies with wider scopes include global data analysis—discussion on how temperature and humidity
are correlated with the infection and fatality rates of the COVID-19 pandemic [27,28]. Both studies
focus on the morbidity and mortality rates in their respective study area and globally, but neither of
them discusses the effect of environmental factors on the duration of COVID-19, which is an essential
factor for policymaking. Its effect on the mortality and morbidity rates is still controversial; for example,
no correlation with weather data was found in a study of 122 cities in China [19], whereas a correlation
was reported in [15]. A report highlighting the duration of the pandemic spread may lead to better
management of medical resources and protective gear, which is a well-known life-threatening factor
during the evolution of COVID-19.
     In this study, we evaluate the effect of different ambient conditions and population densities on
the spread and decay durations of COVID-19 in different prefectures of Japan. To the best of our
knowledge, this is the first study to discuss the effect of environmental factors during COVID-19 in
Japan. Japan provides an interesting case study for environmental factors, because medical services
and social reactions are similar nationwide and high-quality data were properly recorded.

2. Materials and Methods

2.1. Data Source
      Three datasets were utilized in this study. The first dataset contains the number of confirmed
positive cases in each prefecture that was obtained from Toyo Keizai Online [29] and is based on a
report by the Ministry of Health, Labour and Welfare [30].
      Because the state of emergency was terminated on 25 May 2020, this study utilized data from 15
March 2020, to that date. COVID-19 started spreading in mid-February in the Aichi Prefecture, which
is the only prefecture where the spread started earlier than 15 March. As such, additional data were
obtained from the Aichi Prefecture website [31] and included in this study.
      The second dataset consists of population and prefecture area data that were obtained from the
Statistics Bureau of Japan [32] (Table 1). Several prefectures are classified as geographically adjacent
to primary prefectures (Tokyo, Osaka, Aichi, and Fukuoka; Table 1). In adjacent prefectures, several
people were found to commute to the primary prefectures, thus potentially affecting the prefecture
data, and should, therefore, not be neglected.
      The third dataset contains weather data obtained from the Japan Meteorological Agency for each
prefecture during the time of the pandemic. The absolute humidity was derived from the relative
humidity and ambient temperature data [33].

2.2. Data Processing
     The number of confirmed positive tests may be influenced by diagnostic data, based on Japanese
guidelines, serial intervals, and latency, which is affected by each doctor’s judgment; therefore, the
moving average over 7 days (± 3 days in addition to the corresponding day) was considered to reduce
the effect of potential singularities. This duration was used in the trajectory analysis of COVID-19 as
well [34], also considering its incubation time (mean value of 5.1 days) [35]. Additional small peaks
were still observed, which were attributed to clusters of patients (e.g., nosocomial infections, nursing
home patients, and people returning from foreign countries). Similar to other countries, the number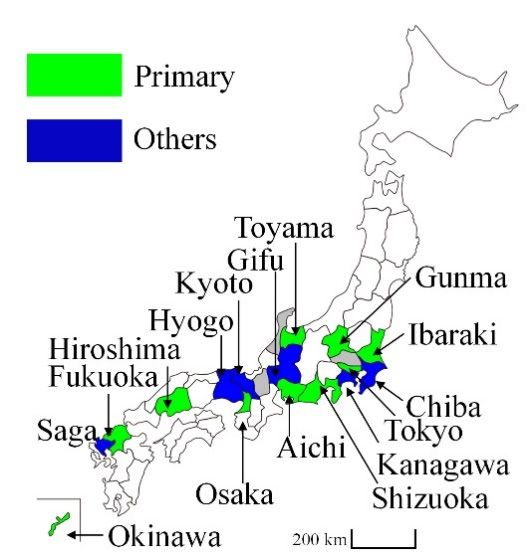
Int. J. Environ. Res. Public Health 2020, 17, 5354                                                                            4 of 14

of confirmed positives may depend on the day of the week (see [34]); in general, the number of tests
conducted on weekends is lower than on weekdays.
     This tendency prevents the direct fitting of the observed cases for comparison with a computational
model (typically expressed as a bell-shape or a log-normal distribution, similar to the trend in theoretical
models [36,37]). Therefore, our study introduces the criteria of days required for spreading from
10% to 90% and for decaying from 90% to 10% of the peak [38] of the confirmed positives (7-day
average [34]), as metrics for the evaluation, as shown in Figure 1a. This metric is particularly useful
for cases where the noise effect should not be neglected. A limitation of this metric is that a certain
minimum number of samples is needed because if the number of samples is small, one or two new
patients would significantly influence the results. Therefore, as a pre-processing step, prefecture data
were excluded if the daily maximum number of confirmed positive cases was less than 10. In addition,
the percentage of morbidity/mortality in nosocomial infections and nursing home patients should not
be significant. In Ishikawa, however, 75% of the confirmed deaths were nosocomial infections. Two
prefectures (Saitama and Shiga) were excluded from the analysis due to a lack of humidity data, which
are essential for discussing the effect of ambient conditions on the spread and decay durations (see the
data source     in theRes.
        Int. J. Environ. next subsection).
                           Public Health 2020, 17, Based   onREVIEW
                                                   x FOR PEER this criterion, 16 prefectures met the minimum
                                                                                                          5 of 15number
of confirmed positive cases, as shown in Figure 1b.

                                           (a)                                                     (b)

      Figure 1.Figure 1. (a) Proposed
                 (a) Proposed          definition
                                 definition       of the
                                               of the    spreadand
                                                       spread   and decay
                                                                    decay durations
                                                                             durations along the curve
                                                                                          along          of theof
                                                                                                  the curve     COVID-19
                                                                                                                  the COVID-19
              pandemic, which has been applied to the 7-day moving average of original data. Time parameters
      pandemic, which has been applied to the 7-day moving average of original data. Time parameters
              extracted from the definition are TSS (start of spread), TSE (end of spread), TDS (start of decay), TDE (end
      extracted  from the definition are T and(start
              of decay), DS (spread duration), SS
                                                           of spread), T (b)(end
                                                      DD (decay duration).SE
                                                                                      of spread), T prefectures
                                                                               Map of Japan with 16DS
                                                                                                                    decay), TDE
                                                                                                          (start of under
      (end of decay),   DS (spread
              study classified        duration),
                                as primary          andand
                                            prefectures   DDadjacent
                                                              (decay prefectures
                                                                       duration).(others).
                                                                                     (b) Map of Japan with 16 prefectures
      under study classified as primary prefectures and adjacent prefectures (others).
          2.3. Statistics
2.3. Statistics
                A statistical analysis was conducted to determine the correlation between different factors and
     A statistical   analysis
         both the spread    and was conducted
                                decay             to determine
                                      periods of the             the correlation
                                                      pandemic using  the softwarebetween
                                                                                   JMP (SASdifferent     factors
                                                                                              Institute, Cary,   and both
                                                                                                               NC,
         USA).
the spread   and Todecay
                    assist the pairwise
                            periods  of correlations,
                                        the pandemic  we calculated
                                                          using thethe  Spearman’s
                                                                    software    JMPrank
                                                                                     (SAScorrelation
                                                                                            Institute,between  the USA).
                                                                                                         Cary, NC,
To assistspread   and decay
          the pairwise         durations normalized
                            correlations,  we calculatedto the population
                                                             the Spearman’sdensity
                                                                               rankand  different environmental
                                                                                     correlation    between the spread
         parameters. The correlation matrix with partial correlation probabilities was also calculated.
and decay durations normalized to the population density and different environmental parameters.
         Subsequently, a multivariate analysis using linear regression was conducted using the same software.
The correlation
         Statistical matrix   with
                     significance   partial
                                  was acceptedcorrelation
                                                at p < 0.05. probabilities was also calculated. Subsequently, a
multivariate analysis using linear regression was conducted using the same software. Statistical
               was accepted at p < 0.05.
         3. Results
significance
                Table 2. lists the starting and terminating dates of the spread and decay stages (using moving
3. Results
       averages) as well as the date of the peak value of daily confirmed cases (without averaging) observed
          for each prefecture. Figure 2 shows the time-series of the confirmed new positive cases for the spread
     Table 2 lists the starting and terminating dates of the spread and decay stages (using moving
        and decay durations based on the data presented in Table 2.
averages) asAswell as the
                shown      date of
                       in Figure 2a,the  peak value
                                     the number        of daily confirmed
                                                 of normalized  confirmed    cases
                                                                          cases     (without
                                                                                 increased     averaging)
                                                                                           in most           observed
                                                                                                   prefectures,
for eachand
         prefecture.
            multiple peaks are observed in some prefectures. In Aichi, the start of the spread period, TSS, was spread
                      Figure   2 shows    the time-series   of the confirmed    new   positive  cases  for  the
and decay  durations
        three          based
              weeks earlier thanon
                                 in the data studied
                                    the other presented    in Table
                                                      prefectures    2. 2), and in mid-March, when traveling
                                                                  (Table
          residents returned home from foreign countries in response to a call from the Japanese government,
          two large peaks are visible in the spread graph. A similar tendency is observed in Saga, while in
          Chiba, and Gifu, only small peaks are observed.

                Table 2. Starting and terminating dates of the spread and decay stages of the COVID-19 pandemic
                and the date (year 2020) when the highest daily peak value of confirmed cases was reported.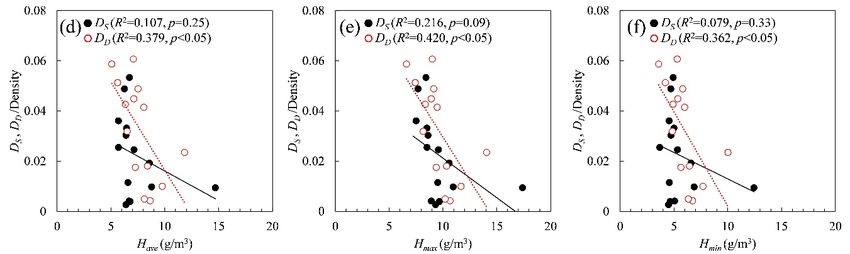
Int. J. Environ. Res. Public Health 2020, 17, 5354 5 of 14
Table 2. Starting and terminating dates of the spread and decay stages of the COVID-19 pandemic and
the date (year 2020) when the highest daily peak value of confirmed cases was reported.
T SS T SE Daily Peak * T DS T DE DS DD
Tokyo 17-Mar 3-Apr 17-Apr 10-Apr 7-May 17 27
Kanagawa 19-Mar 3-Apr 10-Apr 11-Apr 19-May 15 38
Chiba 19-Mar 2-Apr 17-Apr 13-Apr 5-May 14 22
Ibaraki 16-Mar 28-Mar 3-Apr 8-Apr 23-Apr 12 15
Gunma 25-Mar 5-Apr 11-Apr 9-Apr 22-Apr 11 13
Shizuoka 25-Mar 3-Apr 10-Apr 6-Apr 27-Apr 9 21
Aichi 22-Feb 30-Mar 4-Apr 1-Apr 27-Apr 37 26
Gifu 25-Mar 4-Apr 8-Apr 6-Apr 17-Apr 10 11
Toyama 1-Apr 13-Apr 17-Apr 18-Apr 30-Apr 12 12
Osaka 18-Mar 6-Apr 14-Apr 13-Apr 6-May 19 23
Hyogo 19-Mar 4-Apr 9-Apr 7-Apr 4-May 16 27
Kyoto 16-Mar 2-Apr 7-Apr 5-Apr 9-May 17 34
Hiroshima 26-Mar 6-Apr 12-Apr 10-Apr 27-Apr 11 17
Fukuoka 22-Mar 1-Apr 11-Apr 9-Apr 27-Apr 10 18
Saga 23-Mar 15-Apr 19-Apr 22-Apr 1-May 23 9
Okinawa 28-Mar 3-Apr 7-Apr 10-Apr 25-Apr 6 15
* Moving average is not applicable for daily peak values.
Int. J. Environ. Res. Public Health 2020, 17, x FOR PEER REVIEW 7 of 15
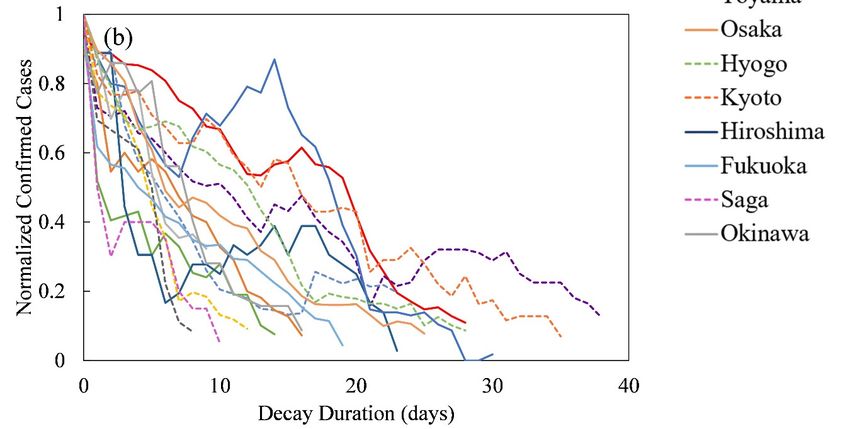
Figure 2.Figure 2. (a) Spread and (b) decay durations (in days) of 16 prefectures in Japan. Dashed lines
(a) Spread and (b) decay durations (in days) of 16 prefectures in Japan. Dashed lines represent
represent the prefectures that are adjacent to primary prefectures (Tokyo, Osaka, Aichi, and
the prefectures that are adjacent to primary prefectures (Tokyo, Osaka, Aichi, and Fukuoka).
Fukuoka).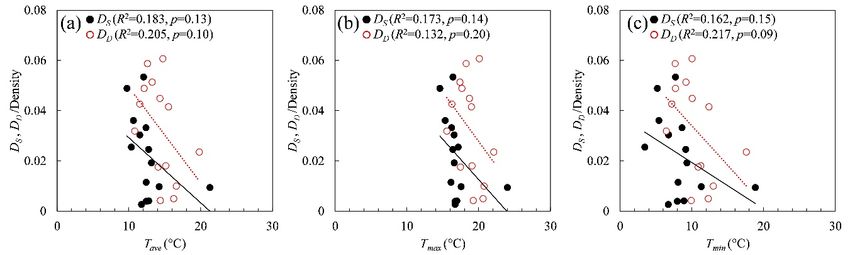
Int. J. Environ. Res. Public Health 2020, 17, 5354                                                            6 of 14

      As shown in Figure 2a, the number of normalized confirmed cases increased in most prefectures,
and multiple peaks are observed in some prefectures. In Aichi, the start of the spread period, TSS , was
three weeks earlier than in the other studied prefectures (Table 2), and in mid-March, when traveling
residents returned home from foreign countries in response to a call from the Japanese government,
two large peaks are visible in the spread graph. A similar tendency is observed in Saga, while in Chiba,
and Gifu, only small peaks are observed.
      As shown in Figure 2b, which illustrates the pandemic decay timeline, the number of normalized
confirmed cases decreased over time in most prefectures. Similar to Figure 2a, multiple peaks are
observed in some prefectures, including Kanagawa and Hyogo. In Aichi, the second peak, whose
magnitude is approximately 0.9 times the maximum value, occurred on 15 April 2020, and was caused
by travelers returning from foreign countries [39].
      Figure 3 illustrates the relationship between the durations of the spread and decay stages. These
relationships are separated into two groups based on hierarchical clustering. The red group consists of
metropolitan   regions
    Figure 2. (a)       with
                   Spread  anda relatively
                                (b) decay high  population
                                           durations        density
                                                     (in days) of 16 compared
                                                                     prefecturestointhe moreDashed
                                                                                     Japan.  rural blue
                                                                                                    linesgroup.
Hereafter,
    represent the prefectures that are adjacent to primary prefectures (Tokyo, Osaka, Aichi, and that
           the  Aichi  and  Saga   are considered  to  be outliers. Based on  Figure   3, we hypothesize
population
    Fukuoka).density is an important factor, and further investigation is required.

      Figure 3. Relationship between the durations of spread and decay (in days). The red ellipse highlights
      prefectures with relatively high population densities, while the blue ellipse highlights those with lower
      population densities.

     Figure 4 shows the relationship between the spread and decay durations (DS and DD ) and
the population density. The data of Aichi and Saga prefectures were excluded due to their outlier
status. The resulting curves confirm the correlation between the spread and decay durations and the
population density. The coefficients of determination of the spread and decay stages are 0.390 and
0.424 (p < 0.05), respectively.
     For environmental factors, the mean daily temperature and humidity values listed in Table 3 were
obtained for the two durations listed in Table 2. Figure 5 shows the effect of the ambient parameters
on the spread and decay durations. The daily mean, maximum, and diurnal change values were
selected based on previous studies on the influenza virus [40,41] and suggest that the temperature and
humidity variations are likely correlated with the COVID-19 mortality rate [15]. As seen in Figure 5,
such a correlation was observed for the data analyzed in this study. If the adjacent prefectures and
those prefectures with multiple peaks in the curves are excluded, a mild correlation is observed for the
maximum absolute humidity (R2 > 0.2) with the spread and decay durations (see also Table 4). In both
cases, including and excluding adjacent prefectures, the maximum absolute humidity is the parameter
that correlates significantly with duration. A brief discussion on how maximum ambient temperature
and maximum absolute humidity are correlated can be found in Appendix A.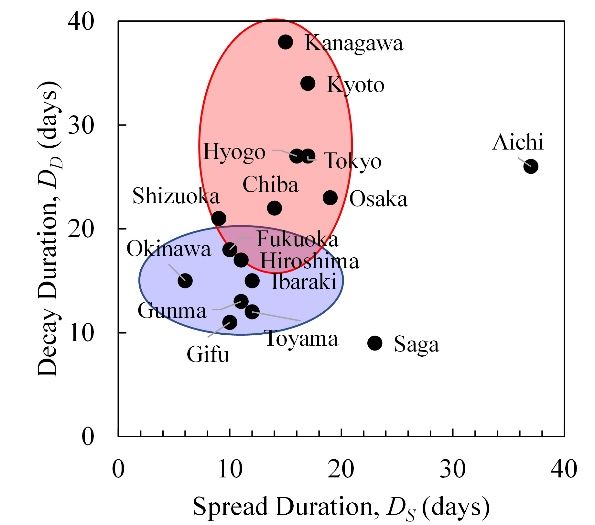
Figure 4 shows the relationship between the spread and decay durations (DS and DD) and the
population density. The data of Aichi and Saga prefectures were excluded due to their outlier status.
The resulting curves confirm the correlation between the spread and decay durations and the
population density. The coefficients of determination of the spread and decay stages are 0.390 and
Int. J. Environ. Res. Public Health 2020, 17, 5354 7 of 14
0.424 (p < 0.05), respectively.
Figure
Figure 4. Relationship
4. Relationship of the
of the (a)(a) spreadand
spread and(b)
(b) decay
decay durations
durations(D
(DS and DDD
S and ) with population
D ) with density.
population density.
For environmental factors, the mean daily temperature and humidity values listed in Table 3
Table 3. Daily average,
were obtained maximum
for the two andlisted
durations minimum temperature,
in Table 2. Figure and absolute
5 shows the humidity values.
effect of the The
ambient
values are averaged
parameters duringand
on the spread the decay
spreaddurations.
and decayThe stages as mean,
daily listed in Tave , diurnal
Table 2. and
maximum, Tmax , and Tmin
change
values were
represent the selected basedmaximum,
daily average, on previous and studies
minimumon the influenza virus
temperatures, [40,41] and
respectively. Havesuggest thatHthe
, Hmax , and min
temperature
represent the and
dailyhumidity
average,variations
maximum,are likely
and correlated
minimum with humidity
absolute the COVID-19
values,mortality rate [15]. As
respectively.
seen in Figure 5, such a correlation was observed for the data analyzed in this study. If the adjacent
prefectures and those prefecturesDwith S multiple peaks in the curves are excluded, DD a mild correlation
T T
is observed foravethe maximum
max T H
absolute
min H
avehumidity H
max (R min
2 T
> 0.2) with T
ave the spread
max Tand Havedurations
min decay Hmax (see Hmin
also Table 4).11.7
Tokyo In both cases, 6.7
16.7 including6.4 and excluding
9.3 4.5 adjacent
14.4 prefectures,
19.2 9.9the maximum
8.6 absolute
10.7 6.7
Kanagawa
humidity is the 12.4 parameter
16.7 8.0 correlates
that 6.8 9.7 4.7 with
significantly 16.6duration.
20.7 A 13.0 9.8
brief discussion 11.7
on how 7.7
Chiba
maximum 12.4
ambient 16.1 8.1 and6.6maximum
temperature 9.5 absolute
4.6 15.1
humidity 19.1 11.2
are correlated 8.4
can be10.3 found in 6.4
Ibaragi 10.3 17.1 3.4 5.7 8.5 3.7 10.8 15.6 6.4 6.5 8.2 4.9
Appendix A.
Gunma 10.6 15.3 5.4 5.7 7.5 4.6 11.5 16.3 7.2 6.3 8.4 4.9
Shizuoka 13.1 16.6 9.3 8.6 10.6 6.6 14.3 18.7 10.0 7.1 8.9 5.4
AichiTable 3. 10.1
Daily average,
14.8 maximum
6.0 and minimum
5.9 7.9 temperature,
4.4 13.0 and 18.3
absolute 8.6
humidity 6.5values.8.4
The 4.9
Gifuvalues are averaged
12.0 16.4 during
7.7 the spread
6.7 and
8.4decay 4.9
stages as
12.6listed 18.2 2. Tave, 5.1
in Table7.7 Tmax, and6.6Tmin 3.6
Toyamarepresent 9.7
the daily14.6
average,5.2 maximum,6.3 and 7.7
minimum 4.7temperatures,
12.1 17.6 7.7 Have, 7.5
respectively. Hmax, and9.1
Hmin 5.8
Osakarepresent12.7
the daily17.0
average,8.9maximum,6.7 and 8.9
minimum 5.1absolute
16.2humidity
20.6 values,
12.3respectively.
8.1 10.2 6.3
Hyogo 12.7 16.4 9.1 7.2 9.6 5.3 15.5 19.0 12.4 8.1 9.5 6.0
Kyoto 11.5 16.6 6.8 D6.4
S 8.6 4.7 14.7 20.1 DD
10.0 7.1 9.0 5.3
Hiroshima 12.4 Tave16.2 Tmax 8.6Tmin 6.5 Have 8.5
Hmax H5.0
min T13.2
ave 17.4 Tmin9.2 Have 5.6 Hmax 7.4Hmin 4.2
Tmax
Fukuoka Tokyo 14.2 11.717.5 16.7 11.36.7 8.86.4 11.0 9.3 6.9
4.5 14.0 19.2
14.4 17.5 9.910.9 8.6 7.3 10.7 9.4 6.7 5.7
Saga
Kanagawa13.4 12.417.9 16.7 9.0 8.0 7.36.8 9.1
9.7 5.5
4.7 14.9 20.7
16.6 20.1 13.09.8 9.8 7.1 11.7 8.6 7.7 5.4
Okinawa 21.3 24.0 18.8 14.7 17.4 12.4 19.8 22.1 17.6 11.8 14.1 10.0
Chiba 12.4 16.1 8.1 6.6 9.5 4.6 15.1 19.1 11.2 8.4 10.3 6.4
Ibaragi 10.3 17.1 3.4 5.7 8.5 3.7 10.8 15.6 6.4 6.5 8.2 4.9
Gunma 10.6 15.3 5.4 5.7 7.5 4.6 11.5 16.3 7.2 6.3 8.4 4.9
Shizuoka 13.1 16.6 9.3 8.6 10.6 6.6 14.3 18.7 10.0
Table 4. Spearman’s rank correlation coefficients and p-values for spread and decay durations 7.1 8.9 5.4
Aichi 10.1 14.8 6.0 5.9 7.9 4.4 13.0 18.3 8.6 6.5 8.4 4.9
normalized by population density.
Ds/Density Dd/Density
ρ p-Value ρ p-Value
Tave −0.526 0.05 −0.459 0.099
Tmax −0.659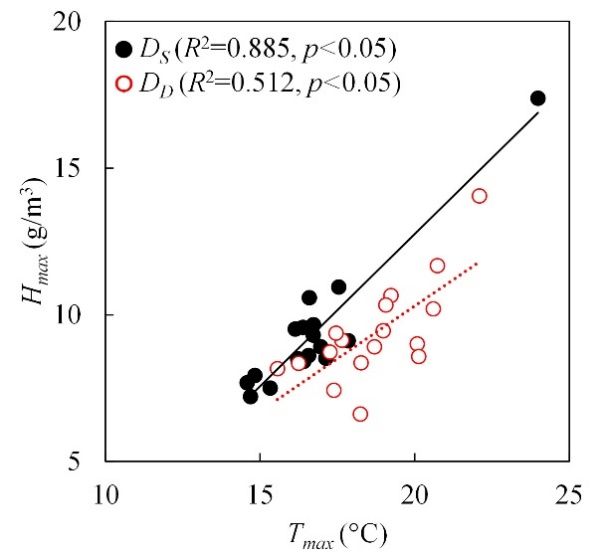
Osaka        12.7      17.0     8.9    6.7           8.9      5.1      16.2      20.6     12.3      8.1      10.2      6.3
          Hyogo        12.7      16.4     9.1    7.2           9.6      5.3      15.5      19.0     12.4      8.1      9.5       6.0
          Kyoto        11.5      16.6     6.8    6.4           8.6      4.7      14.7      20.1     10.0      7.1      9.0       5.3
        Hiroshima      12.4      16.2     8.6    6.5           8.5      5.0      13.2      17.4     9.2       5.6      7.4       4.2
         Fukuoka       14.2      17.5    11.3    8.8          11.0      6.9      14.0      17.5     10.9      7.3      9.4       5.7
           SagaRes. Public
Int. J. Environ.       13.4Health17.9
                                  2020, 17,9.0
                                            5354 7.3           9.1      5.5      14.9      20.1     9.8       7.1      8.6       5.4
                                                                                                                                   8 of 14
         Okinawa       21.3      24.0    18.8    14.7         17.4      12.4     19.8      22.1     17.6      11.8     14.1      10.0

      Figure5.5.Relationship
     Figure         Relationship      of spread
                                  of the  the spread    and durations
                                                 and decay     decay durations
                                                                          (DS and D   (D   and (a)
                                                                                       DS) with  DDdaily
                                                                                                    ) with    (a) daily
                                                                                                          average          average
                                                                                                                     temperature
      temperature
     (T ave ), (b) daily  ave), (b) daily
                       (Tmaximum           maximum(Ttemperature
                                       temperature      max ), (c) daily(T max), (c) daily
                                                                         minimum            minimum
                                                                                       temperature    (Ttemperature
                                                                                                        min ), (d) daily(T  min), (d)
                                                                                                                         average
      daily average
     absolute    humidityabsolute
                              (Have ),humidity   (Have), (e) absolute
                                      (e) daily maximum       daily maximum
                                                                        humidityabsolute       humidity
                                                                                     (Hmax ), and (f) daily(H  max), and absolute
                                                                                                            minimum       (f) daily
     humidity
      minimum(H      min ).
                    absolute     humidity (Hmin).

     ATable
        multivariate  correlation
              4. Spearman’s        analysis was
                             rank correlation     conducted
                                              coefficients   to p-values
                                                           and  examineforthespread
                                                                              relationship  between
                                                                                      and decay      the daily
                                                                                                 durations
maximum      temperature  and   absolute
      normalized by population density.  humidity    values measured    during   the study  period (pandemic
spread and decay) and the population density (Figure 6). The data of Aichi and Saga prefectures
                                        Ds/Density                   Dd/Density
were excluded due to their outlier status. The results yield adjusted R2 values of 0.53(p < 0.05)
                                      ρ          p-Value           ρ
and 0.24(p = 0.130) in the spread and decay stages, respectively, indicating  p-Valuevariability within some
                         T ave     −0.526           0.05         −0.459         0.099
prefectures, as shown in Table 5. The standardized partial regression coefficients of population density,
                         Tmax and
daily maximum temperature,         −0.659
Table 5. Coefficients of determination R2, adjusted R2 values and p-values for the multivariate
linear regression.
R2 adj. R2 p-Value
D S 0.641
Int. J. Environ. Res. Public Health 2020, 17, 5354
0.533Int. J. Environ. Res. Public Health 2020, 17, 5354 10 of 14
observed in Aichi and Saga during the spread stage and in Aichi, Saga and Tokyo during the decay stage.
According to reports of each prefecture, this is mainly caused by patient clusters, which are attributed
to nosocomial infections, nursing home patients, and travelers returning from foreign countries. In
Aichi, at least one peak is caused predominantly by individuals who returned from foreign countries.
The duration of such peaks is relatively short compared to the prefecture durations and generally
shorter than the estimated ones. The total spread and decay durations in Aichi were shorter than
20 days for the first bell-shaped curve, whereas the estimated duration from the multivariate analysis
was 35 days and thus may not be considered as a second outbreak. If the duration defining threshold
is changed (e.g., 0.05. to 0.95), the tendency does not change for distributions following a bell-shape
and the duration increases by 30%. However, some differences are apparent in prefectures where small
peaks (i.e., cluster infections) are observed. In general, such prefectures have been excluded or treated
separately, thus not influencing our conclusions.
Most noteworthy is the evaluation of the effect of population density on the spread and decay
durations. The results for the primary prefectures show a good correlation between these parameters,
indicating that population density functions as a rough proxy for social distancing [44]. Our data
indicate that it significantly influences the formation of the bell-shape of the curve describing the
pandemic. By normalizing our data using population density, we found good correlations between
the temperature and absolute humidity, and the identified durations. This is surprising because the
ambient conditions in the real world vary significantly with time (e.g., [45–47]). Regarding ambient
condition parameters, the daily maximum absolute humidity had the greatest effect.
The parameters obtained with multivariate linear regression analysis were applied for the
predictions: adjusted R2 values are 0.53 (p < 0.05) and 0.24 (p = 0.13) for the spread and decay durations,
respectively; that is, the decay duration is not statistically significant. The small peaks observed in the
prefectures adjacent to the primary prefectures (Figure 2b) could be the potential reason for this.
This demonstrates that in adjacent prefectures the influence of the primary prefectures may not be
neglected because residents commuting between the prefectures influence the spread and/or decay
durations. For example, Hyogo prefectural governor decided to match the end of state emergency
with that in Osaka; they are adjacent with each other.
Therefore, additional constraints were defined to exclude prefectures located adjacent to primary
prefectures to avoid the influence of infections caused by neighboring major pandemic clusters. A set
of nine prefectures demonstrated a strong correlation of the average absolute humidity and population
density, yielding adjusted R2 values of 0.896 (p < 0.05) and 0.681 (p < 0.05) in the spread and decay
stages, respectively.
The importance of absolute humidity was suggested in previous studies on the morbidity/mortality
rate of the influenza virus [48,49] and also in a preliminary study of COVID-19 [22]. Note that
the differences in other parameters, including maximum and average temperatures, and average
absolute humidity, show comparable correlations. In [22] the role of the ambient parameters could
not be adequately constrained, and controversies and inconsistencies remained (see the review in
“Introduction”).
A straightforward comparison of our findings with those of different countries is not feasible
because the data is measured based on different closure policies, testing rates, validation measures,
etc., which would introduce several biases. Further factors influencing data accuracy are lockdown
restrictions, social distancing, and public response. Recently, the effect of air-conditioning units on
COVID-19 transmission has also been suggested [50]. This case study on the pandemic duration in
Japan nevertheless provides a highly consistent result that may lead to a better understanding of
this correlation.
5. Conclusions
This study investigates the correlation of the durations of the spread and decay stages of COVID-19
with ambient conditions and population density in 16 prefectures of Japan. Although the number ofJapan nevertheless provides a highly consistent result that may lead to a better understanding of this
correlation.
5. Conclusions
This study
Int. J. Environ. investigates
Res. Public the17,correlation
Health 2020, 5354 of the durations of the spread and decay stages of COVID-
11 of 14
19 with ambient conditions and population density in 16 prefectures of Japan. Although the number
of cases reported in Japan is limited, the uniformity of the data provides a fairly consistent conclusion;
cases reported indensity
the population Japan isis limited, the and
dominant, uniformity
higher of the data
absolute providesand
humidity a fairly consistent
temperature conclusion;
may result in
the population density is dominant, and higher absolute humidity and temperature
shorter durations. Some exceptions exist, especially in prefectures where travelers returned frommay result in
shorter
foreign durations. Some
countries. In exceptions
addition, exist, especially
the durations in prefectures
in adjacent prefectures were
whereinfluenced
travelers by
returned from
the primary
foreign countries. In addition, the durations in adjacent prefectures were influenced by the
prefectures (e.g., Tokyo, Osaka, Aichi, and Fukuoka), resulting in longer durations. For a potential primary
prefectures (e.g., Tokyo,
pandemic, especially Osaka, Aichi,
a potential second and
waveFukuoka), resulting
of COVID-19, thisinfactor
longer durations.
should For a potential
be considered as well
pandemic, especially
as the multi-city a potential
comparison forsecond wave different
developing of COVID-19, this factor
protection should be considered as well as
policies.
the multi-city comparison for developing different protection policies.
Author Contributions: Conceptualization, A.H.; Data curation, E.A.R. and S.K.; Formal analysis, S.K., J.G.-T.
and A.H.;
Author Investigation,Conceptualization,
Contributions: E.A.R., S.K. and J.G.-T.; Methodology,
A.H.; Data A.H.;and
curation, E.A.R. Project
S.K.;Administration,
Formal analysis,A.H.; Resources,
S.K., J.G.-T. and
A.H.; Investigation,
E.A.R.; E.A.R., and
Software, E.A.R. S.K. and
S.K.;J.G.-T.; Methodology,
Validation, E.A.R.;A.H.; Project Administration,
Visualization, A.H.; Resources,
S.K.; Writing—original draft,E.A.R.;
A.H.;
Software, E.A.R. and
Writing—review andS.K.; Validation,
editing, E.A.R.,E.A.R.; Visualization,
S.K., J.G.-T. and A.H.S.K.; Writing—original
All authors have read draft, A.H.; Writing—review
and agreed to the published
and editing, E.A.R., S.K., J.G.-T. and A.H. All authors have read and agreed to the published version of
version of the
the manuscript. manuscript.
Funding: This
Funding: This research
research received
receivedno
noexternal
externalfunding.
funding.
Conflictsof
Conflicts ofInterest:
Interest:The
Theauthors
authorsdeclare
declareno
noconflicts
conflictsofofinterest.
interest.
Appendix
AppendixAA
The
Therelationship
relationshipbetween
between the the
different ambient
different condition
ambient metricsmetrics
condition and morbidity is often discussed
and morbidity is often
(e.g., [51]). (e.g.,
discussed For the COVID-19
[51]). duration analyzed
For the COVID-19 durationinanalyzed
this study,
in the
thiscorrelation between thebetween
study, the correlation maximum the
temperature and maximum absolute humidity in the spread duration presented
maximum temperature and maximum absolute humidity in the spread duration presented in Figure in Figure A1 are
significant (p < 0.05).
A1 are significant (pThe duration
< 0.05). of COVID-19
The duration was generally
of COVID-19 was limited to two
generally months;
limited thus,
to two the metrics
months; thus,
considered in the discussion of Figure 6 are correlated unlike the discussion of their annual
the metrics considered in the discussion of Figure 6 are correlated unlike the discussion of their impact on
influenza (e.g., [49]).
annual impact on influenza (e.g., [49]).
Figure A1.
Figure A1. Relationship
Relationship between
between maximum
maximum humidity
humidity and
and maximum
maximum temperature.
temperature.
References
References
1. Wu, Z.; McGoogan, J.M. Characteristics of and important lessons from the coronavirus disease 2019(COVID-19)
outbreak in China: Summary of a report of 72314cases from the Chinese Center for Disease Control and
Prevention. Jama 2020, 323, 1239–1242. [CrossRef] [PubMed]
2. World Health Organization. Coronavirus Disease 2019(COVID-19): Situation Report 72; World Health
Organization: Geneva, Switzerland, 2020.
3. Adhikari, S.P.; Meng, S.; Wu, Y.-J.; Mao, Y.-P.; Ye, R.-X.; Wang, Q.-Z.; Sun, C.; Sylvia, S.; Rozelle, S.; Raat, H.
Epidemiology, causes, clinical manifestation and diagnosis, prevention and control of coronavirus disease
(COVID-19) during the early outbreak period: A scoping review. Infect. Dis. Poverty 2020, 9, 1–12. [CrossRef]
4. Hethcote, H.W. The mathematics of infectious diseases. SIAM Rev. 2000, 42, 599–653. [CrossRef]
5. Daley, D.J.; Gani, J. Epidemic Modelling: An introduction; Cambridge University Press: Cambridge, UK, 2001;
Volume 15.Int. J. Environ. Res. Public Health 2020, 17, 5354 12 of 14
6. Keeling, M.J.; Rohani, P. Modeling Infectious Diseases in Humans and Animals; Princeton University Press:
Princeton, NJ, USA, 2011.
7. Lin, Q.; Zhao, S.; Gao, D.; Lou, Y.; Yang, S.; Musa, S.S.; Wang, M.H.; Cai, Y.; Wang, W.; Yang, L. A conceptual
model for the outbreak of Coronavirus disease 2019(COVID-19) in Wuhan, China with individual reaction
and governmental action. Int. J. Infect. Dis. 2020, 93, 211–216. [CrossRef] [PubMed]
8. Giordano, G.; Blanchini, F.; Bruno, R.; Colaneri, P.; Di Filippo, A.; Di Matteo, A.; Colaneri, M. Modelling the
COVID-19epidemic and implementation of population-wide interventions in Italy. Nat. Med. 2020, 26, 1–6.
[CrossRef]
9. Briz-Redón, Á.; Serrano-Aroca, Á. A spatio-temporal analysis for exploring the effect of temperature on
COVID-19early evolution in Spain. Sci. Total Environ. 2020, 728, 138811. [CrossRef]
10. Reis, R.F.; de Melo Quintela, B.; de Oliveira Campos, J.; Gomes, J.M.; Rocha, B.M.; Lobosco, M.; dos Santos, R.W.
Characterization of the COVID-19pandemic and the impact of uncertainties, mitigation strategies, and
underreporting of cases in South Korea, Italy, and Brazil. Chaos Solitons Fractals 2020, 36, 109888. [CrossRef]
11. Currie, C.S.; Fowler, J.W.; Kotiadis, K.; Monks, T.; Onggo, B.S.; Robertson, D.A.; Tako, A.A. How simulation
modelling can help reduce the impact of COVID-19. J. Simul. 2020, 14, 83–97. [CrossRef]
12. Pirouz, B.; Shaffiee Haghshenas, S.; Pirouz, B.; Shaffiee Haghshenas, S.; Piro, P. Development of an assessment
method for investigating the impact of climate and urban parameters in confirmed cases of covid-19: A new
challenge in sustainable development. Int. J. Environ. Res. Public Health 2020, 17, 2801. [CrossRef]
13. Ai, T.; Yang, Z.; Hou, H.; Zhan, C.; Chen, C.; Lv, W.; Tao, Q.; Sun, Z.; Xia, L. Correlation of chest CT and
RT-PCR testing in coronavirus disease 2019(COVID-19) in China: A report of 1014cases. Radiology 2020, 296,
200642. [CrossRef]
14. Repici, A.; Maselli, R.; Colombo, M.; Gabbiadini, R.; Spadaccini, M.; Anderloni, A.; Carrara, S.; Fugazza, A.;
Di Leo, M.; Galtieri, P.A. Coronavirus (COVID-19) outbreak: What the department of endoscopy should
know. Gastrointest. Endosc. 2020, 92, 192–197. [CrossRef] [PubMed]
15. Ma, Y.; Zhao, Y.; Liu, J.; He, X.; Wang, B.; Fu, S.; Yan, J.; Niu, J.; Zhou, J.; Luo, B. Effects of temperature
variation and humidity on the death of COVID-19in Wuhan, China. Sci. Total Environ. 2020, 724, 138226.
[CrossRef] [PubMed]
16. Wang, J.; Tang, K.; Feng, K.; Lv, W. High temperature and high humidity reduce the transmission of COVID-19.
SSRN 3551767 2020. (In Press) [CrossRef]
17. Tosepu, R.; Gunawan, J.; Effendy, D.S.; Lestari, H.; Bahar, H.; Asfian, P. Correlation between weather and
Covid-19pandemic in Jakarta, Indonesia. Sci. Total Environ. 2020, 725, 138436. [CrossRef] [PubMed]
18. Ogen, Y. Assessing nitrogen dioxide (NO2) levels as a contributing factor to the coronavirus (COVID-19)
fatality rate. Sci. Total Environ. 2020, 726, 138605. [CrossRef] [PubMed]
19. Zhu, Y.; Xie, J. Association between ambient temperature and COVID-19infection in 122cities from China.
Sci. Total Environ. 2020, 724, 138201.
20. Liu, J.; Zhou, J.; Yao, J.; Zhang, X.; Li, L.; Xu, X.; He, X.; Wang, B.; Fu, S.; Niu, T. Impact of meteorological
factors on the COVID-19transmission: A multi-city study in China. Sci. Total Environ. 2020, 726, 138513.
[CrossRef]
21. Tomar, A.; Gupta, N. Prediction for the spread of COVID-19in India and effectiveness of preventive measures.
Sci. Total Environ. 2020, 728, 138762. [CrossRef]
22. Auler, A.; Cássaro, F.; da Silva, V.; Pires, L. Evidence that high temperatures and intermediate relative
humidity might favor the spread of COVID-19in tropical climate: A case study for the most affected Brazilian
cities. Sci. Total Environ. 2020, 729, 139090. [CrossRef]
23. Oliveiros, B.; Caramelo, L.; Ferreira, N.C.; Caramelo, F. Role of temperature and humidity in the modulation
of the doubling time of COVID-19cases. medRxiv 2020. Available online: https://www.medrxiv.org/content/
10.1101/2020.03.05.20031872v1 (accessed on 24 July 2020).
24. Hu, H.; Nigmatulina, K.; Eckhoff, P. The scaling of contact rates with population density for the infectious
disease models. Math. Biosci. 2013, 244, 125–134. [CrossRef] [PubMed]
25. Prata, D.N.; Rodrigues, W.; Bermejo, P.H. Temperature significantly changes COVID-19transmission in (sub)
tropical cities of Brazil. Sci. Total Environ. 2020, 729, 138862. [CrossRef]
26. Kodera, S.; Rashed, E.A.; Hirata, A. Correlation between COVID-19morbidity and mortality rates in japan
and local population density, temperature, and absolute humidity. Int. J. Environ. Res. Public Health 2020.
submitted.Int. J. Environ. Res. Public Health 2020, 17, 5354 13 of 14
27. Wu, Y.; Jing, W.; Liu, J.; Ma, Q.; Yuan, J.; Wang, Y.; Du, M.; Liu, M. Effects of temperature and humidity
on the daily new cases and new deaths of COVID-19in 166countries. Sci. Total Environ. 2020, 729, 139051.
[CrossRef] [PubMed]
28. Huang, Z.; Huang, J.; Gu, Q.; Du, P.; Liang, H.; Dong, Q. Optimal temperature zone for the dispersal of
COVID-19. Sci. Total Environ. 2020, 736, 139487. [CrossRef] [PubMed]
29. Toyo Keizai Online. Coronavirus Disease (COVID-19) Situation Report in Japan. Available online: https:
//toyokeizai.net/sp/visual/tko/covid19/en.html (accessed on 31 May 2020).
30. Ministry of Health Labour and Welfare. About Coronavirus Disease 2019(COVID-19). Available online:
https://www.mhlw.go.jp/stf/seisakunitsuite/bunya/newpage_00032.html (accessed on 26 May 2020).
31. Aichi Prefecture. Aichi New Coronavirus Infectious Disease Top Page. Available online: https://www.pref.
aichi.jp/site/covid19-aichi/ (accessed on 24 July 2020).
32. Statistics Bureau of Japan. Population Estimates. Available online: https://www.stat.go.jp/english/ (accessed
on 2 June 2020).
33. Japan Meteorological Agency Weather/Earthquake. Available online: https://www.jma.go.jp/jma/indexe.html
(accessed on 29 May 2020).
34. Roser, M.; Ritchie, H.; Ortiz-Ospina, E.; Hasell, J. Coronavirus Pandemic (COVID-19). Available online:
https://ourworldindata.org/coronavirus#coronavirus-country-profiles (accessed on 29 June 2020).
35. Lauer, S.A.; Grantz, K.H.; Bi, Q.; Jones, F.K.; Zheng, Q.; Meredith, H.R.; Azman, A.S.; Reich, N.G.; Lessler, J.
The incubation period of coronavirus disease 2019(COVID-19) from publicly reported confirmed cases:
Estimation and application. Ann. Intern. Med. 2020, 172, 577–582. [CrossRef] [PubMed]
36. Ceylan, Z. Estimation of COVID-19prevalence in Italy, Spain, and France. Sci. Total Environ. 2020, 729,
138817. [CrossRef]
37. Nishiura, H.; Linton, N.M.; Akhmetzhanov, A.R. Serial interval of novel coronavirus (COVID-19) infections.
Int. J. Infect. Dis. 2020, 93, 284–286. [CrossRef]
38. Gusev, A.I.; Lyubutin, S.K.; Rukin, S.N.; Tsyranov, S.N. Superfast thyristor-based switches operating in
impact-ionization wave mode. IEEE Transact. Plasma Sci. 2016, 44, 1888–1893. [CrossRef]
39. Ishikawa Prefecture. 2019 Novel Coronavirus. Available online: https://www.pref.ishikawa.lg.jp/kansen/
coronakennai.html (accessed on 29 May 2020).
40. Park, J.E.; Son, W.S.; Ryu, Y.; Choi, S.B.; Kwon, O.; Ahn, I. Effects of temperature, humidity, and diurnal
temperature range on influenza incidence in a temperate region. Influenza Other Respir. Viruses 2019, 14,
11–18. [CrossRef]
41. Metz, J.A.; Finn, A. Influenza and humidity–Why a bit more damp may be good for you! J. Infect. 2015, 71,
S54–S58. [CrossRef] [PubMed]
42. Michelozzi, P.; Accetta, G.; De Sario, M.; D’Ippoliti, D.; Marino, C.; Baccini, M.; Biggeri, A.; Anderson, H.R.;
Katsouyanni, K.; Ballester, F. High temperature and hospitalizations for cardiovascular and respiratory
causes in 12European cities. Am. J. Respir. Crit. Care Med. 2009, 179, 383–389. [CrossRef] [PubMed]
43. Lanzinger, S.; Hampel, R.; Breitner, S.; Rückerl, R.; Kraus, U.; Cyrys, J.; Geruschkat, U.; Peters, A.;
Schneider, A. Short-term effects of air temperature on blood pressure and pulse pressure in potentially
susceptible individuals. Int. J. Hyg. Environ. Health 2014, 217, 775–784. [CrossRef] [PubMed]
44. The Prime Minister in Action. Press Conference regarding the Novel Coronavirus Disease (COVID-19).
Available online: https://japan.kantei.go.jp/98_abe/actions/202004/_00022.html (accessed on 29 May 2020).
45. Kamiya, T.; Onishi, R.; Kodera, S.; Hirata, A. Estimation of Time-Course Core Temperature and Water Loss
in Realistic Adult and Child Models with Urban Micrometeorology Prediction. Int. J. Environ. Res. Public
Health 2019, 16, 5097. [CrossRef]
46. Kamiya, T.; Kodera, S.; Hasegawa, K.; Egawa, R.; Sasaki, H.; Hirata, A. Different thermoregulatory responses
of people from tropical and temperate zones: A computational study. Build. Environ. 2019, 159, 106152.
[CrossRef]
47. Tyler, C.J.; Reeve, T.; Hodges, G.J.; Cheung, S.S. The effects of heat adaptation on physiology, perception and
exercise performance in the heat: A meta-analysis. Sports Med. 2016, 46, 1699–1724. [CrossRef]
48. Peci, A.; Winter, A.-L.; Li, Y.; Gnaneshan, S.; Liu, J.; Mubareka, S.; Gubbay, J.B. Effects of absolute humidity,
relative humidity, temperature, and wind speed on influenza activity in Toronto, Ontario, Canada. Appl.
Environ. Microbiol. 2019, 85, e02426-18. [CrossRef]Int. J. Environ. Res. Public Health 2020, 17, 5354 14 of 14
49. Shimmei, K.; Nakamura, T.; Ng, C.F.S.; Hashizume, M.; Murakami, Y.; Maruyama, A.; Misaki, T.; Okabe, N.;
Nishiwaki, Y. Association between seasonal influenza and absolute humidity: Time-series analysis with
daily surveillance data in Japan. Sci. Rep. 2020, 10, 1–7. [CrossRef]
50. Lu, J.; Gu, J.; Li, K.; Xu, C.; Su, W.; Lai, Z.; Zhou, D.; Yu, C.; Xu, B.; Yang, Z. COVID-19outbreak associated
with air conditioning in restaurant, Guangzhou, China, 2020. Emerg. Infect. Dis. 2020, 26, 1628. [CrossRef]
51. Kodera, S.; Nishimura, T.; Rashed, E.A.; Hasegawa, K.; Takeuchi, I.; Egawa, R.; Hirata, A. Estimation
of heat-related morbidity from weather data: A computational study in three prefectures of Japan over
2013–2018. Environ. Int. 2019, 130, 104907. [CrossRef]
© 2020 by the authors. Licensee MDPI, Basel, Switzerland. This article is an open access
article distributed under the terms and conditions of the Creative Commons Attribution
(CC BY) license (http://creativecommons.org/licenses/by/4.0/).You can also read