Characterization of Purified Red Cabbage Anthocyanins: Improvement in HPLC Separation and Protective Effect against H2O2-Induced Oxidative Stress ...
←
→
Page content transcription
If your browser does not render page correctly, please read the page content below
molecules
Article
Characterization of Purified Red Cabbage
Anthocyanins: Improvement in HPLC Separation and
Protective Effect against H2O2-Induced Oxidative
Stress in HepG2 Cells
Sheng Fang 1, * , Fubin Lin 1 , Daofeng Qu 1 , Xianrui Liang 2 and Liping Wang 1
 1   School of Food Science and Biotechnology, Zhejiang Gongshang University, Hangzhou 310018, China;
     linfubinwin@126.com (F.L.); daofeng@zjsu.edu.cn (D.Q.); wanglp155fs@sina.com (L.W.)
 2   College of Pharmaceutical Sciences, Zhejiang University of Technology, Hangzhou 310014, China;
     liangxrvicky@zjut.edu.cn
 *   Correspondence: fszjgsu@163.com; Tel.: +86-130-9375-2831

 Received: 29 November 2018; Accepted: 27 December 2018; Published: 31 December 2018

 Abstract: In this study, the chemical profiles and antioxidant activities of red cabbage anthocyanin
 (RCA)-enriched extract are evaluated. The effects of column temperature on the HPLC resolution of
 the RCAs are studied. The HPLC resolutions became better as the column temperature increased from
 20 ◦ C–45 ◦ C. An optimized HPLC condition was achieved at 45 ◦ C and used for the quantification
 and qualification of the RCAs. The anthocyanins in the enriched powder are all derivatives of
 cyanidin (268 ± 2 µg/mg), mainly with 19% nonacylated, 51% monoacylated, and 31% diacylated
 structures with ferulic, sinapic, p-coumaric, and caffeic acids characterized by HPLC-MS. The RCA
 extracts markedly reduced intracellular oxidative stress production by H2 O2 on HepG2 cells and
 consequently ameliorated cell apoptosis and improved viability. The analytical method and cellular
 antioxidant activity demonstration of the RCAs will greatly facilitate their functional applications.

 Keywords: anthocyanins; HPLC; temperature; intracellular oxidative stress

1. Introduction
     Currently, there is an increase in the application of natural anthocyanins as an alternative to
synthetic pigments [1,2]. Red cabbage (RC) is a good natural resource of anthocyanins since it has high
content and productivity compared to berries [3,4]. The red cabbage anthocyanins (RCAs) have a wide
range of color spectrum and hues, as well as excellent thermostability because of their highly-acylated
structures [4]. The characterization of anthocyanin profiles and antioxidant activities of purified RCAs
are important for its utilization as substitutes for synthetic colorants in the food industry [5].
     High-performance liquid chromatography (HPLC) is an extensively-used and powerful technique
to separate and characterize anthocyanins in plants including RC [3,4,6,7]. However, because of their
similar structures, some anthocyanins in RC have a tendency to be co-eluted in an HPLC column [6],
which makes it difficult to achieve a baseline separation. Zhang et al. [7] found that, although some
peaks were isolated at the baseline after optimization in a reversed-phase HPLC, there were still
other predominant RCAs eluted together either in a C18 or phenyl-hexyl column. Methods based
on a two-dimensional HPLC for the analysis of RCAs have also been developed [7,8]. To achieve
satisfactory peak resolution, most attention has been focused on the optimization of the speed, pH,
and composition of the mobile phase, etc. In this study, we found that the column temperature
greatly influenced the separation of RCAs in a reversed-phase HPLC. By optimizing the column
temperature, a good resolution of RCAs in a normal C18 column could be achieved. To our knowledge,

Molecules 2019, 24, 124; doi:10.3390/molecules24010124                     www.mdpi.com/journal/molecules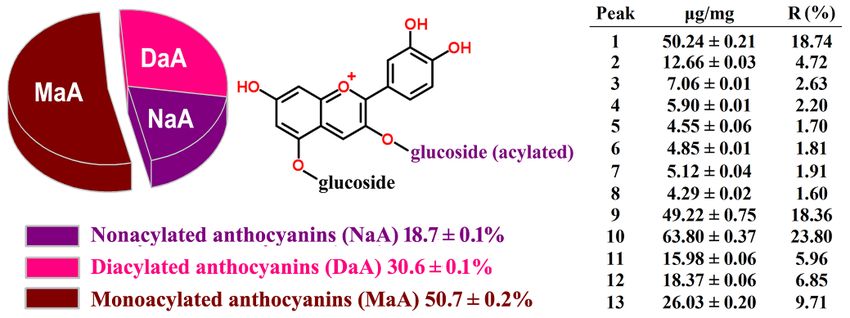
Molecules 2019, 24, 124                                                                           2 of 10

this is the first time that the column temperature has been recognized as an important variable in
the HPLC separation of RCAs, which also provides a good reference for anthocyanins’ analysis from
other resources.
      The antioxidant effect of anthocyanins is one of the underlying mechanisms for their biological
activities [9]. The antioxidant activities of RCAs have always been determined by chemical methods
such as the DPPH and ABTS assays [10]. Reactive oxygen species (ROS), which have been implicated in
the etiology of various chronic diseases, are a series of metabolic byproducts involved in pathological
and degenerative processes in the human body [11]. The determination of ROS level in cells can
represent their oxidative stress and consequently demonstrate the antioxidant activities of test
compounds in protecting cells [12–14]. The protective effects of many natural compounds on the
H2 O2 -induced oxidative stress in different cells have been demonstrated [15,16]. So far, no studies
have been undertaken to investigate the potential protective properties of RCAs against oxidative
stress induced by H2 O2 on human hepatocellular carcinoma (HepG2) cells [17,18]. Here, we applied
a high content analysis (HCA)-based technology [19] to measure simultaneously the effects of RCAs
on cell viability and ROS levels of H2 O2 -treated HepG2 cells.
      In this study, new methods are established to characterize the properties of RCA extracts that are
purified by resin adsorption, including the characterization of anthocyanin profiles and antioxidant
activity on HepG2 cells. A new HPLC method with a good resolution of each RCAs was developed
by optimizing the column temperatures. Based on the optimized HPLC conditions, the anthocyanin
profile of the RCAs was quantitatively and qualitatively determined. Finally, the antioxidant activity
of the RCAs was characterized by the ROS-reducing effect of HepG2 cells after H2 O2 treatment.
The purification, analytical method, and antioxidant activity demonstration of the RCAs extracts will
facilitate their applications as substitutes for synthetic colorants in the food industry.

2. Results and Discussions

2.1. Effect of Temperature on the HPLC Resolution of RCAs
     An optimum HPLC condition is essential for the qualitative and quantitative analysis of the
RCAs extracts. The column temperature is one factor that influences chromatographic retention
and selectivity [20], but it is often overlooked in the analytical method of anthocyanins. In this
study, an acidic mobile phase with pH 2.0 was optimized to separate RCAs on a reversed phase
HPLC-column at 25 ◦ C at first, as shown in Figure 1a. Although the separation in the chromatograph
seemed acceptable, there were still some shoulder peaks, as shown in the figure. It is interesting
to find that the temperature affects the resolution of RCAs in HPLC remarkably. As shown
in Figure 1, the peaks of 9 and 10 and the peaks of 11, 12, and 13 could not be separated at
25 ◦ C. However, as the column temperature increased from 25–45 ◦ C, these peaks became better
separated. Generally, as the column temperature increased from 20–45 ◦ C, the retention times
of all the RCAs decreased. Consequently, taller and narrower chromatographic peaks could be
found in the chromatographic profiles at a higher temperature, as shown in Figure 1e. With mass
spectral characterization, for example, the last peak in Figure 1a contained three cyanidin-derivatives
with different glycosylation patterns (Peaks 11, 12, and 13 were characterized as cyanidin
3-(feruloyl)(feruloyl)-diglucoside-5-glucoside, cyanidin 3-(feruloyl)(sinapoyl)-diglucoside-5-glucoside,
and cyanidin 3-(sinapoyl)(sinapoyl)-diglucoside-5-glucoside, respectively). These cyanidin-derivatives
all had an acetyl diglucoside and a glucoside group, but the only differences at their acetyl groups
were feruloyl and sinapoyl, which made them difficult to separate at normal conditions. However,
these compounds could be separated linearly with the temperature increased from 25–45 ◦ C. These
results show that the column temperature is a critical factor for HPLC separation of RCAs.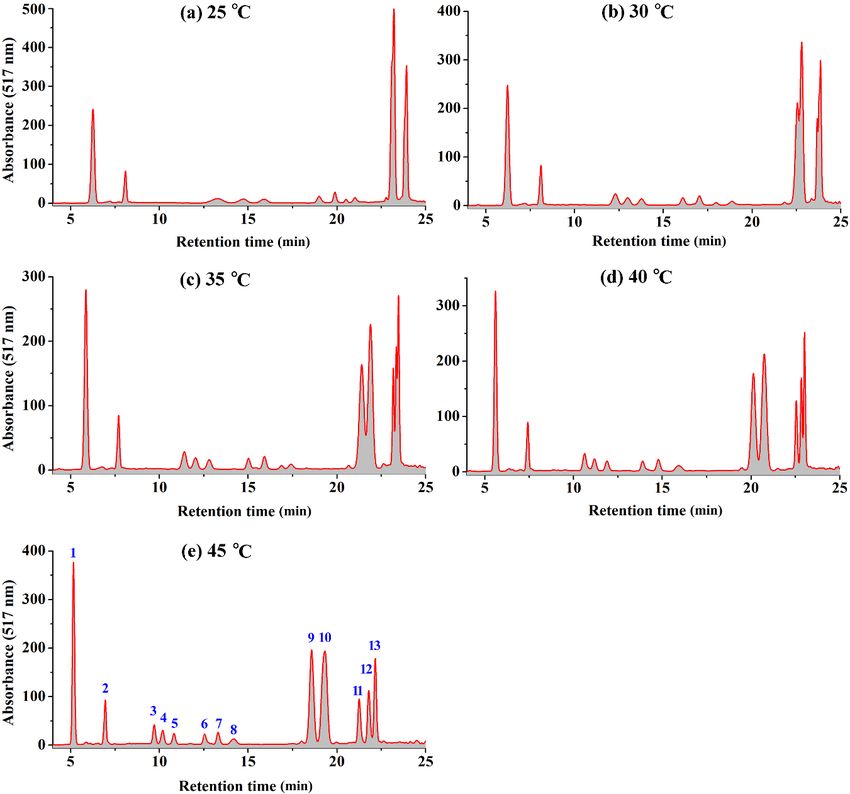
Molecules 2019, 24, 124 3 of 10
Molecules 2018, 23, x FOR PEER REVIEW 3 of 10
Figure 1.1. The
Figure The illustration
illustration ofof the HPLC profiles
the HPLC profiles of
of the
the red
red cabbage
cabbage anthocyanins
anthocyanins at
at different
different
temperatures:(a)
temperatures: (a)25 ◦
25 °C; (b) 30
C; (b) ◦
30 °C; (c) 35
C; (c) ◦
35 °C; (d) 40
C; (d) ◦
40 °C; (e) 45
C; (e) ◦
45 °C.
C.
ItItisisproposed
proposedthatthatthe
theseparation
separationofofthe
theRCAs
RCAsby byincreasing
increasingtemperatures
temperatureson onthe
theHPLC
HPLCcolumn
column
be attributed
be attributed to to their
theirdifferent
differentreductions
reductionsof ofthe
theelution
elutiontime
timewith
withtemperature
temperature[20–22].
[20–22]. The
The results
results
showedthat
showed thatthe
theretention
retentiontimes
timesof
ofsome
someRCAs
RCAswereweremore
moresensitive
sensitivetotothe
thecolumn
columntemperature.
temperature.This
This
phenomenoncould
phenomenon couldbe beexplained
explainedfrom
fromaathermodynamic
thermodynamicpoint point[21].
[21].
According to
According to Snyder’s
Snyder’s theory
theory [21],
[21], the
the relationship
relationship between
between the
the retention
retention factor
factor and
and column
column
temperaturefor
temperature foraagiven
givensolute
solutecan
canbe
bedescribed
describedas: as:
log klog kT =klog
T = log
k − a (1/ TR − 1/
R − aR(1/TR − 1/T ) T)
where kR and TR are the retention factor and (absolute) temperature for a reference condition
where kR and TR are the retention factor and (absolute) temperature for a reference condition (e.g.,
(e.g., 298 K) and kT and T are the retention factor and temperature for the solute at a new temperature,
298 K) and kT and T are the retention factor and temperature for the solute at a new temperature, a
a being the energy constant. For a given mobile phase and column condition as in this study, the a
being the energy constant. For a given mobile phase and column condition as in this study, the a value
valueofofeach
each RCA
RCA is fixed.
is fixed. Hence,
Hence, by plotting
by plotting logkT(1/T
logkT versus versus
R − 1/T) over
− 1/T)
(1/TR the over the
experimental experimental
temperature
temperature range,
range, the a value a value
thecan can be obtained
be obtained from of
from the slope thethe
slope
plot of theHere,
[20]. plot [20]. Here, the temperature
the temperature 25 °C is
25 ◦ Cselected
is selected as the reference temperature T R , and the time at the baseline disturbance
as the reference temperature TR, and the time at the baseline disturbance (3.0 min) was (3.0 set
min)as was
set asthe
thehold-up
hold-up time. The retention factor k and the a values for each RCAs are shown
time. The retention factor kT andTthe a values for each RCAs are shown in Table 1. in Table 1.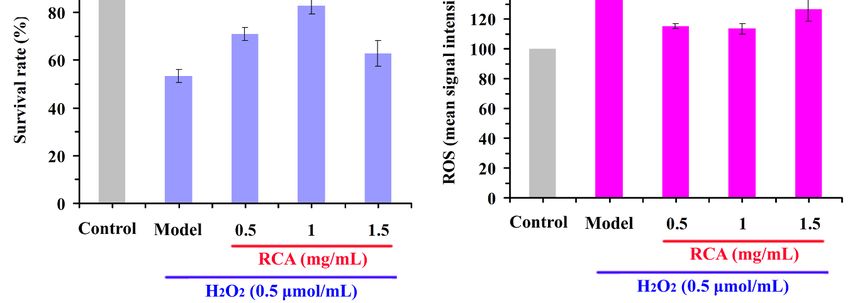
Molecules 2019, 24, 124                                                                                             4 of 10

              Table 1. The retention factor kT and a values for each red cabbage anthocyanin (RCA) 1 .

                Peak No.             k25            k30           k35            k40            k45           a
                    1               1.110         1.074          0.954          0.869          0.751         2251
                    2               1.750         1.703          1.568          1.476          1.329         1552
                    3               3.426         3.100          2.803          2.542          2.244         2057
                    4               3.909         3.331          3.013          2.728          2.397         2095
                    5               4.298         3.591          3.270          2.963          2.609         2036
                    6               5.334         4.363          4.006          3.633          3.183         2011
                    7               5.630         4.678          4.307          3.927          3.437         1959
                    8               6.006         5.289          4.806          4.304          3.730         2231
                    9               6.737         6.518          6.134          5.712          5.193         1451
                    10              6.737         6.599          6.299          5.916          5.442         1235
                    11              7.076         6.890          6.726          6.517          6.286          590
                    12              7.076         6.952          6.783          6.611          6.453          482
                    13              7.076         6.952          6.824          6.672          6.488          443
                          1   The retention factor was calculated by kT = (tT − t0 )/t0 , with t0 = 3 min.

     The value of a is negatively proportional to the enthalpy for the transfer of the solute from the
mobile phase to the stationary phase [20]. The values of a were positive for all RCAs, which means
that the adsorption process of RCAs was exothermic. The exothermic retention behavior resulted
in a decrease in retention with increasing temperature as observed. However, the retention of some
anthocyanins may decrease at a different rate, since the slopes of the van’t Hoff curves (∆H) for these
anthocyanins were not equal [22]. Therefore, as the temperature increases, the separation between
peaks that co-eluted at a low temperature will be much improved. For example, the a was 1451 and
1235 for Peaks 9 and 10, respectively. The larger value of Peak 9 resulted in more reduction degrees
of the retention time and consequently separated Peaks 9 and 10. It is obvious that the larger the
difference of the a values for co-eluted peaks, the more feasible it is to apply the temperature effects
to get a good resolution. The difference of the a values between Peaks 11 and 13 was larger than
that between Peaks 12 and 13, which made Peak 11 more easy to separate from Peak 13, as shown
in Figure 1.

2.2. HPLC-ESI-MS Analysis and Quantification of RCAs
     Based on the optimum HPLC conditions, the components of the RCAs extracts were determined
by ESI-MS, as listed in Table 1. The anthocyanins profile of red cabbage had been successfully analyzed
by means of HPLC-DAD-MS/MS [3]. According to the results, the derivatives of cyanidin were only
found in RCAs [3]. Therefore, all 13 peaks can be identified based on the comparison of their retention
time and the mass spectrum with the published data [3]. The tentative identification of chemical
structures for each peak is listed in Table 2. The results obtained supported the previous observation
that the main structure of anthocyanins in red cabbage was cyanidin-3-diglucoside-5-glucosides,
the glycoside chains of which can be nonacylated, monoacylated, and diacylated [3,23]. It can be seen
that the monoacylated derivatives of cyanidin were predominate in the RCAs. Anthocyanins with
acylation have shown good stabilities to light and heating compared to nonacylated anthocyanins [6].
The purified RCAs contained mainly anthocyanins with acyl chain structures, which are beneficial for
their application as a natural colorant in the food industry.
Molecules 2019, 24, 124 5 of 10
Molecules 2018, 23, x 2.
Table FOR PEER REVIEW
Identification of each anthocyanins in the RCA extracts by HPLC-ESI-MS. 5 of 10
Peak tR /min +
M m/z Tentative Identification
4 11.67 1111 Cyanidin-3-(feruloyl)-triglucosides-5-glucoside
51 6.14
12.39 773
1141 Cyanidin-3-diglucoside-5-glucoside
Cyanidin-3-(sinapoyl)-triglucoside-5-glucoside
62 8.14
14.39 979
1287 Cyanidin-3-(sinapoyl)-diglucoside-5-glucoside
Cyanidin-3-(feruloyl)(feruloyl)-triglucoside-5-glucoside
3 11.12 1081 Cyanidin-3-(caffeoyl)(p-coumaroyl)-diglucosides-5-glucoside
74 15.29
11.67 1317
1111 Cyanidin-3-(feruloyl)(sinapoyl)-triglucoside-5-glucoside
Cyanidin-3-(feruloyl)-triglucosides-5-glucoside
85 16.11
12.39 935
1141 Cyanidin-3-(caffeoyl)-diglucoside-5-glucoside
Cyanidin-3-(sinapoyl)-triglucoside-5-glucoside
96 19.73
14.39 919
1287 Cyanidin-3-(p-coumaroyl)-diglucoside-5-glucoside
Cyanidin-3-(feruloyl)(feruloyl)-triglucoside-5-glucoside
107 15.29
20.45 1317
949 Cyanidin-3-(feruloyl)(sinapoyl)-triglucoside-5-glucoside
Cyanidin-3-(feruloyl)-diglucoside-5-glucoside
8 16.11 935 Cyanidin-3-(caffeoyl)-diglucoside-5-glucoside
11 22.88 1125 Cyanidin-3-(feruloyl)(feruloyl)-diglucoside-5-glucoside
9 19.73 919 Cyanidin-3-(p-coumaroyl)-diglucoside-5-glucoside
12
10 23.42
20.45 1155
949 Cyanidin-3-(feruloyl)(sinapoyl)-diglucoside-5-glucoside
Cyanidin-3-(feruloyl)-diglucoside-5-glucoside
13
11 23.78
22.88 1185
1125 Cyanidin-3-(sinapoyl)(sinapoyl)-diglucoside-5-glucoside
Cyanidin-3-(feruloyl)(feruloyl)-diglucoside-5-glucoside
12 23.42 1155 Cyanidin-3-(feruloyl)(sinapoyl)-diglucoside-5-glucoside
13 23.78 1185 Cyanidin-3-(sinapoyl)(sinapoyl)-diglucoside-5-glucoside
2.3. HPLC Method Validation and Quantification
2.3. HPLC TheMethod
HPLC Validation
method established above was valid using C3G as a standard anthocyanin reference.
and Quantification
The linearity, limit of detection (LOD), limit of quantification (LOQ), precision, and recovery were
The HPLC
assessed. Formethod
linearity established
tests, the above
equation was of valid using
linear C3G as a standard
regression was y = anthocyanin
32.51x − 28.36 reference.
over the
The linearity, limit of detection (LOD), limit of quantification (LOQ), precision,
concentration range from 5–60 μg/mL (y is the peak area in mAU*s; x is the concentration in μg/mL; and recovery were
assessed. For The
R2 = 0.9962). linearity
LOD tests,
and LOQ the were
equation
0.080ofμg/mLlinearand regression
0.267 μg/mL = 32.51x −at28.36
was ydetermined S/N ofover
threethe
and
concentration range from 5–60 µg/mL (y is the peak area in mAU*s; x is the
10, respectively. The relative standard deviation (RSD) and recovery were tested and calculated to concentration in µg/mL;
R2assess
= 0.9962). The LODof
the precision andtheLOQ wereThe
method. 0.080 µg/mL
RSD values and of 0.267 µg/mL
intra-day determined
variations wereat± S/N
0.58%offor
three
peak
and 10, respectively.
areas and ± 0.43% for Theretention
relative standard
times. Thedeviation
recovery(RSD) and recovery
was 98.71 were on
± 2.53% based tested
the and
C3Gcalculated
addition.
to assess thetotal
The precision of the method.
anthocyanins The RSD
in the RCAs values
extracts were of intra-day
determined variations
with 268were ± 0.58%
± 2 μg/mg for peak
based on the
areas
above ± 0.43%The
andmethod. for retention times.of
concentrations Theeach recovery
RCA in wasthe98.71 ± 2.53%
purified based
powder areonlisted
the C3G addition.
in Figure 2 along
withThetheir
total relative
anthocyanins
contentsin the RCAs
(R%). The extracts were determined
composition profiles of with 268 ± 2 µg/mg
nonacylated, based on the
monoacylated, and
above
diacylated anthocyanins are also shown in Figure 2. The glycosyl groups of the RCAs2were
method. The concentrations of each RCA in the purified powder are listed in Figure alongacylated
with
their
by relative contents
ferulic acid, (R%).
sinapic Thep-coumaric
acid, composition profiles
acid, of nonacylated,
and caffeic monoacylated,
acid. It can be seen that the andderivatives
diacylated of
anthocyanins are also shown in Figure 2. The glycosyl groups of the
cyanidin in the extracts were distributed mainly into about 19% nonacylated anthocyanins, RCAs were acylated by ferulic
51%
acid, acid, p-coumaric
monoacylated anthocyanins, and 31% diacylated anthocyanins. Wiczkowski et al. [3] found in
sinapic acid, and caffeic acid. It can be seen that the derivatives of cyanidin that
thenonacylated
extracts were distributed mainly
anthocyanins comprisedinto about
27.6% 19% nonacylated
of total RCAs, whileanthocyanins,
monoacylated51% monoacylated
and diacylated
anthocyanins,
anthocyaninsand 31% diacylated
covered 38.4% and anthocyanins.
34.1%, respectively. Wiczkowski et al. [3] of
The proportions found
eachthat nonacylated
anthocyanin were,
anthocyanins
however, changedcomprisedwith 27.6%
varietalofdiversity,
total RCAs, while monoacylated
maturation and diacylated
time, and cultivation conditions anthocyanins
[24,25].
covered 38.4% and 34.1%, respectively. The proportions of each anthocyanin were, however, changed
with varietal diversity, maturation time, and cultivation conditions [24,25].
Figure 2. The
Figure anthocyanins
2. The contents
anthocyanins and
contents profiles
and of the
profiles RCA
of the extracts.
RCA extracts.
2.4. Effect of RCAs against H2 O2 -Induced Oxidative Stress in HepG2 Cells
2.4. Effect of RCAs against H2O2-Induced Oxidative Stress in HepG2 Cells
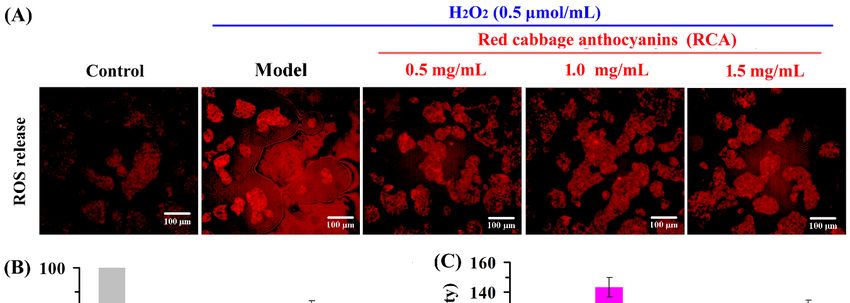
Because oxidative stress resulted in inevitable damage during metabolism, we investigated
Because oxidative stress resulted in inevitable damage during metabolism, we investigated
whether treatment with the RCAs represses cell death induced by H2 O2 . As shown in Figure 3,
whether treatment with the RCAs represses cell death induced by H2O2. As shown in Figure 3, the
the cytotoxicity induced by H2 O2 was significantly increased compared to the control group. On the
cytotoxicity induced by H2O2 was significantly increased compared to the control group. On the other
hand, treatment of the RCAs at all concentrations suppressed the damage triggered by H2O2. Among
three concentrations, the RCAs with 1.0 mg/mL showed more inhibitory effects on oxidative stress-
induced cytotoxicity. The result indicated that the RCA extracts could provide the first line of defenseMolecules 2019, 24, 124 6 of 10
other hand, treatment of the RCAs at all concentrations suppressed the damage triggered by H2 O2 .
Among three concentrations, the RCAs with 1.0 mg/mL showed more inhibitory effects on oxidative
Molecules 2018, 23, x FOR PEER REVIEW 6 of 10
stress-induced cytotoxicity. The result indicated that the RCA extracts could provide the first line
of
todefense
HepG2 to HepG2
cells cellsoxidative
against against oxidative
stress. It stress. It was supposed
was supposed that the that
cells the cells reduced
reduced oxidative
oxidative stress-
stress-induced apoptosis by directly scavenging reactive oxygen species (ROS)
induced apoptosis by directly scavenging reactive oxygen species (ROS) in the cell. in the cell.
Figure3.3.The
Figure Theprotective
protective effects
effects of
of the
theRCAs
RCAs against
against H
H22O22-induced
-induced HepG2
HepG2cell
cellantioxidant
antioxidantdamage
damage
((A)
((A)fluorescence
fluorescenceimage;
image;(B,C)
(B,C)fluorescence
fluorescence data
data analysis).
analysis).
To
Toclarify
clarifythetheeffect
effectof
ofthethe RCAs
RCAs on on HepG2 cells, the activityactivity levels
levels of
ofROS
ROSin incells
cellswere
weremeasured.
measured.
As
Asshown
showninin Figure 3A,C,
Figure compared
3A,C, compared withwiththe control group,
the control the treatment
group, of H2 Oof
the treatment 2 significantly increase
H2O2 significantly
the ROS levels
increase the ROS(pMolecules 2019, 24, 124 7 of 10
pathways related to the antioxidant response, e.g., increase in antioxidant enzyme activity and the
protection of mitochondrial functionality [29,30]. Shih et al. [29] found that anthocyanins could
induce the activation of phase II enzymes through the antioxidant response element pathway against
H2 O2 -induced oxidative stress and apoptosis. Lee et al. [30] recently reported that berry anthocyanins
were able to protect the lipopolysaccharide-stimulated RAW 264.7 macrophages against oxidative
damage through the activation of the nuclear factor-erythroid 2-related factor 2 (Nrf2). Therefore,
any model or the combined actions of an antioxidant mechanism for the RCAs are possible, e.g., by
directly scavenging ROS, or by chelating metal ions, thus inhibiting Fenton reactions, or by enhancing
the activity of genes involved in the expression of antioxidant enzymes. However, more detailed
determinations including enzyme activities are needed. Overall, the study demonstrated that the
RCA extracts obtained markedly reduced intracellular ROS production by H2 O2 on HepG2 cells and
consequently ameliorated cell apoptosis and improved viability.
3. Materials and Methods
3.1. Materials
The red cabbage (Brassica oleracea var. capitata F. rubra) was grown in Hangzhou, East China.
The red cabbage was firstly sealed in a plastic bag and blanched in boiling water for 5 min to inactive
enzymes [31]. The blanched red cabbage was instantly cooled and squeezed using a juice extractor
with ceramic spiral extrusion (Joyoung JYZ-E3C/E3, Hangzhou, China). The juice was centrifuged to
obtain clarified liquid and stored in a refrigerator at −30 ◦ C. The X-5 macroporous resin was obtained
from Zhengzhou Qinshi Technology Co., Ltd (Zhengzhou, China).
The human hepatoma HepG2 cell line was obtained from Shanghai Cell Bank (Shanghai, China).
Cell culture flasks and black body clear-bottomed 96-well plates (Costar 3631) were purchased from
Corning (New York, NY, USA). The MTT Cell Proliferation Assay Kit was purchased from Beyotime
Company (Shanghai, China). CellROX Oxidative Stress Reagent and Image-iT™ LIVE Green Caspase
Detection Kits were purchased from Molecular Probes, Invitrogen (Eugene, OR, USA).
3.2. Purification of RCAs by Resin Adsorption
The adsorption process is shown below [32,33]. The X-5 resin was first pretreated with 95%
ethanol, 4% NaOH, and 10% acetic acid to remove organic, alkali, and acid residues according to
references. Briefly, 6 bed volumes (BVs) of the juice were pumped into a pretreated resin column at
a flow rate of 9 BV per hour for sample loading. Then, the column was eluted with 6 BVs of deionized
water to remove the majority of sugars and organic acids. The purple section of RCAs was then eluted
by 4 BVs of desorption solution (80% ethanol at pH 4.0) at a flow rate of 9 BV per hour. The eluent
fractions were collected and concentrated in a rotary vacuum evaporator at 40 ◦ C to remove ethanol.
A dried powder of RCA extracts was obtained by freeze-drying of the concentrated eluent solution.
The overall yield was about 110 mg RCAs enriched dry powder per 100 g fresh red cabbage.
3.3. HPLC/ESI-MS Characterization
The HPLC/ESI-MS system adopted consisted of an Agilent 1260 system (Agilent Technologies,
Wilmington, DE, USA), equipped with a quaternary pump, surveyor plus detector, and ion trap mass
spectrometer detector (LCQ Advantage, Thermo, Waltham, MA, USA). Chromatographic separation
was performed using an Ultimate LP-C18 column (Φ 4.6 × 250 mm, 5 µm, Yuexu Keji, Shanghai,
China). The sample was filtrated through a syringe filter (0.45 µm), and 10 µL of filtrates were injected.
The mobile phase consisted of 5% (v/v) formic acid in water (Solvent A) and methanol (Solvent B) at
a flow rate of 1.0 mL/min. The gradient elution program was performed as follows: 0–5 min, 20–30%
B; 5–12 min, 30–33% B; 12–18 min, 33–40% B; 18–25 min 40–60% B. The column temperature was
maintained using the column oven model, and the detection wavelength was set at 517 nm. The ESI-MS
parameters were as follows: positive mode; ESI source voltage, 3.8 kV; capillary voltage, 36 V; sheathMolecules 2019, 24, 124 8 of 10
gas flow rate, 40 arb; aux gas flow rate, 5 arb; sweep gas flow rate, 0 arb; capillary temperature, 300 ◦ C;
and scan range, 50–1500 m/z.
3.4. HPLC Method Validation and Quantification
The HPLC conditions for the method validation and quantification were the same as above.
The column temperature was maintained at 45 ◦ C. The linearity of the calibration curve was established
by the analysis of the C3G (reference compound) at seven concentrations (5, 10, 20, 30, 40, 50,
and 60 µg/mL). The limit of detection (LOD) and limit of quantification (LOQ) were determined at
signal-to-noise ratios (S/N) of 3 and 10, respectively [34]. The precision of the developed method was
demonstrated by intra-day variations of the sample of 30 µg/mL, which were examined five times
within one day. The RSDs for the retention time and peak area were calculated as measures of precision.
Recovery was determined by adding C3G to an aqueous solution of the purified RCAs powder.
3.5. Cell Culture-Based Assays for Antioxidant Activity
3.5.1. Cell Culture
HepG2 cells were thawed in a 37 ◦ C water bath and maintained in 75-cm2 cell culture flasks. Cells
were cultured in DMEM medium supplemented with 15% fetal bovine serum, 2 mM L-glutamine,
and 1% antibiotics. The cells were kept in a humidified incubator at 37 ◦ C containing atmospheric
air and 5% CO2 . For the subculture, the HepG2 cells were harvested at 70–80% confluence.
A trypsin-EDTA solution (0.25% trypsin, 0.02% EDTA) was used to detach cells. The cells that
in the logarithmic growth phase were selected and tested.
3.5.2. Cell Count and ROS Assays by HCA
HepG2 cells in the logarithmic growth phase were seeded into 96-well plates at a density of
5000 cells/well in a final volume of 100 µL medium. The cells were allowed to adhere for 12 h. After
removing the cell medium, the cells were exposed to 100 µL H2 O2 (500 µM) for 2 h (100 µL culture
medium for control). The cell medium was removed again and washed with ice-cold PBS three times.
Then, cells were exposed to given concentrations of the RCA solutions prepared with fresh cell medium
for 24 h. In our studies, the treatment of HepG2 cells with RCAs at 1000 µg/mL produced no detectable
cell toxicity, which was consistent with previous research [35,36].
Following treatments, the viability and ROS levels of the treated cells were measured based on
a previous method [19]. Briefly, the cells were loaded with different fluorescent probes including the
Hoechst 33342 kit (Sigma, Missouri, USA) and CellROX® Oxidative Stress Reagent. After incubation
with fluorescence probes, the plate with cells was scanned from the bottom using an ImageXpress
Micro XLS HCS system (Molecular Devices, San Francisco, CA, USA). A DAPI filter cube (exciter (Ex)
377/50, emitter (Em) 447/60; center wavelength (nm)/bandpass width (nm)) was used for Hoechst
33342. A Cy5 filter cube (Ex 628/40, Em 692/40) was used for the ROS dye [19]. The collected images
were analyzed with the MetaXpress (Molecular Devices, San Francisco, CA, USA). Experiments were
performed in triplicate, and data are shown as the mean ± standard deviation (SD).
4. Conclusions
In conclusion, new methods were established for the chemical and cellular assays of the
RCA extracts. The effects of column temperature on the HPLC resolution of RCAs were studied
and discussed. A good HPLC peak resolution can be achieved at 45 ◦ C and used for the
quantification and qualification of the RCAs. The anthocyanins in the extracts were all derivatives of
cyanidin (268 ± 2 µg/mg), mainly with 19% nonacylated, 51% monoacylated, and 31% diacylated
structures with ferulic, sinapic, p-coumaric, and caffeic acids. The RCA extracts markedly reduced
intracellular ROS production by H2 O2 on HepG2 cells and consequently ameliorated cell apoptosis
and improved viability.Molecules 2019, 24, 124 9 of 10
Author Contributions: S.F. and F.L. conceived of and designed the experiments; D.Q. and F.L. performed the
cellular experiments; X.L. and L.W. performed the purification experiments and HPLC analysis; S.F. and L.F.
analyzed the data; S.F. drafted the manuscript; S.F. was responsible for raising the funds.
Funding: This research was funded by the Zhejiang Provincial Collaborative Innovation Center of Food Safety
and Nutrition, Grant Number 2017SICR116.
Conflicts of Interest: The authors declare no conflict of interest.
References
1. Dangles, O.; Fenger, J.A. The chemical reactivity of anthocyanins and its consequences in food science and
nutrition. Molecules 2018, 23, 1970. [CrossRef]
2. Rose, P.M.; Cantrill, V.; Benohoud, M.; Tidder, A.; Rayner, C.M.; Blackburn, R.S. Application of anthocyanins
from blackcurrant (Ribes nigrum L.) fruit waste as renewable hair dyes. J. Agric. Food Chem. 2018, 66,
6790–6798. [CrossRef] [PubMed]
3. Wiczkowski, W.; Szawara-Nowak, D.; Topolska, J. Red cabbage anthocyanins: Profile, isolation, identification,
and antioxidant activity. Food Res. Int. 2013, 51, 303–309. [CrossRef]
4. Wiczkowski, W.; Szawara-Nowak, D.; Topolska, J. Changes in the content and composition of anthocyanins
in red cabbage and its antioxidant capacity during fermentation storage and stewing. Food Chem. 2015, 167,
115–123. [CrossRef] [PubMed]
5. Moloney, M.; Robbins, R.J.; Collins, T.M.; Kondo, T.; Yoshida, K.; Dangles, O. Red cabbage anthocyanins:
The influence of D-glucose acylation by hydroxycinnamic acids on their structural transformations in acidic
to mildly alkaline conditions and on the resulting color. Dyes Pigments 2018, 158, 342–352. [CrossRef]
6. Scalzo, R.L.; Genna, A.; Branca, F.; Chedin, M.; Chassaigne, H. Anthocyanin composition of cauliflower
(Brassica oleracea L. var. botrytis) and cabbage (B. oleracea L. var. capitata) and its stability in relation to
thermal treatments. Food Chem. 2008, 107, 136–144. [CrossRef]
7. Zhang, J.; Wang, Z.; Liu, X. Characterization of acylated anthocyanins in red cabbage via comprehensive
two-dimensional high performance liquid chromatography and HPLC-MS. J. Food Process. Pres. 2016, 41,
e13129. [CrossRef]
8. Willemse, C.M.; Stander, M.A.; Tredoux, A.G.J.; Villiers, A.D. Comprehensive two-dimensional liquid
chromatographic analysis of anthocyanins. J. Chromatogr. A 2014, 1359, 189–201. [CrossRef]
9. Buko, V.; Zavodnik, I.; Kanuka, O.; Belonovskaya, E.; Naruta, E.; Lukivskaya, O.; Kirko, S.; Budryn, G.;
Żyżelewicz, D.; Oracz, J.; et al. Antidiabetic effects and erythrocyte stabilization by red cabbage extract in
streptozotocin-treated rats. Food Funct. 2018, 9, 1850–1863. [CrossRef]
10. Degenhardt, A.; Knapp, H.; Winterhalter, P. Separation and purification of anthocyanins by high-speed
countercurrent chromatography and screening for antioxidant activity. J. Agric. Food Chem. 2000, 48, 338–343.
[CrossRef]
11. Nordberg, J.; Arnér, E.S. Reactive oxygen species, antioxidants, and the mammalian thioredoxin system.
Free Radicals Biol. Med. 2001, 31, 1287–1312. [CrossRef]
12. Chaudhary, A.; Bag, S.; Banerjee, P.; Chatterjee, J. Honey extracted polyphenolics reduce experimental
hypoxia in human keratinocytes culture. J. Agric. Food. Chem. 2017, 65, 3460–3473. [CrossRef] [PubMed]
13. Li, F.; Zhang, X.; Zheng, S.; Lu, K.; Zhao, G.; Ming, J. The composition.; antioxidant and antiproliferative
capacities of phenolic compounds extracted from tartary buckwheat bran [Fagopyrum tartaricum, (L.) Gaerth].
J. Funct. Foods 2016, 22, 145–155. [CrossRef]
14. Omar, S.H.; Kerr, P.G.; Scott, C.J.; Hamlin, A.S.; Obied, H.K. Olive (Olea europaea L.) Biophenols:
A Nutriceutical against Oxidative Stress in SH-SY5Y Cells. Molecules 2017, 22, 1858. [CrossRef]
15. Guo, Y.; Sun, L.; Yu, B.; Qi, J. An integrated antioxidant activity fingerprint for commercial teas based on
their capacities to scavenge reactive oxygen species. Food Chem. 2017, 237, 645–653. [CrossRef] [PubMed]
16. Salla, S.; Sunkara, R.; Ogutu, S.; Walker, L.T.; Verghese, M. Antioxidant activity of papaya seed extracts
against H2 O2 induced oxidative stress in HepG2 cells. LWT-Food Sci. Technol. 2016, 66, 293–297. [CrossRef]
17. Sankhari, J.M.; Thounaojam, M.C.; Jadeja, R.N.; Devkar, R.V.; Ramachandran, A.V. Anthocyanin-rich red
cabbage (Brassica oleracea L.) extract attenuates cardiac and hepatic oxidative stress in rats fed an atherogenic
diet. J. Sci. Food Agr. 2012, 92, 1688–1693. [CrossRef]Molecules 2019, 24, 124 10 of 10
18. Saluk, J.; Bijak, M.; Posmyk, M.M.; Zbikowska, H.M. Red cabbage anthocyanins as inhibitors of
lipopolysaccharide-induced oxidative stress in blood platelets. Int. J. Biol. Macromol. 2015, 80, 702–709.
[CrossRef]
19. Qu, D.; Gu, Y.; Feng, L.; Han, J. High content analysis technology for evaluating the joint toxicity of sunset
yellow and sodium sulfite in vitro. Food Chem. 2017, 233, 135–143. [CrossRef]
20. Dolan, J.W. Temperature selectivity in reversed-phase high performance liquid chromatography.
J. Chromatogr. A 2002, 965, 195–205. [CrossRef]
21. Gant, J.R.; Dolan, J.W.; Snyder, L.R. Systematic approach to optimizing resolution in reversed-phase liquid
chromatography, with emphasis on the role of temperature. J. Chromatogr. A 1979, 185, 153–177. [CrossRef]
22. Khalaf, R.; Baur, D.; Pfister, D. Optimization of reversed-phase chromatography methods for peptide
analytics. J. Chromatogr. A 2015, 1425, 198–203. [CrossRef]
23. Prior, R.L.; Wu, X.; Schaich, K. Standardized methods for the determination of antioxidant capacity and
phenolics in foods and dietary supplements. J. Agric. Food Chem. 2005, 53, 4290–4302. [CrossRef]
24. Ahmadiani, N.; Robbins, R.J.; Collins, T.M.; Giusti, M.M. Anthocyanins contents, profiles, and color
characteristics of red cabbage extracts from different cultivars and maturity stages. J. Agric. Food Chem. 2014,
62, 7524–7531. [CrossRef]
25. Wiczkowski, W.; Piskuła, M.K. Food flavonoids. Pol. J. Food Nutr. Sci. 2004, 13, 101–114.
26. Yeh, C.T.; Ching, L.C.; Yen, G.C. Inducing gene expression of cardiac antioxidant enzymes by dietary phenolic
acids in rats. J. Nutr. Biochem. 2009, 20, 163–171. [CrossRef]
27. Yang, G.; Liao, J.; Kim, K.; Yurkow, E.J.; Yang, C. Inhibition of growth and induction of apoptosis in human
cancer cell lines by tea polyphenols. Carcinogenesis 1998, 19, 611–616. [CrossRef]
28. Huang, W.Y.; Wu, H.; Li, D.J.; Song, J.F.; Xiao, Y.D.; Liu, C.Q.; Zhou, J.Z.; Sui, Z.Q. Protective effects of
blueberry anthocyanins against H2 O2 -induced oxidative injuries in human retinal pigment epithelial cells.
J. Agric. Food Chem. 2018, 66, 1638–1648. [CrossRef]
29. Shih, P.H.; Yeh, C.T.; Yen, G.C. Anthocyanins induce the activation of phase II enzymes through the
antioxidant response element pathway against oxidative stress-induced apoptosis. J. Agric. Food Chem. 2007,
55, 9427–9435. [CrossRef]
30. Lee, S.G.; Kim, B.; Yang, Y.; Pham, T.X.; Park, Y.K.; Manatou, J.; Koo, S.I.; Chun, O.K.; Lee, J.Y. Berry
anthocyanins suppress the expression and secretion of proinflammatory mediators in macrophages by
inhibiting nuclear translocation of NF-kB independent of NRF2-mediated mechanism. J. Nutr. Biochem. 2014,
25, 404–411. [CrossRef]
31. Cheng, L.; Fang, S.; Ruan, M. Influence of blanching pretreatment on the drying characteristics of cherry
tomato and mathematical modeling. Int. J. Food Eng. 2015, 11, 265–274. [CrossRef]
32. Chen, Y.; Zhang, W.; Zhao, T.; Li, F.; Zhang, M.; Li, J.; Zou, Y.; Wang, W.; Cobbina, S.J.; Wu, X.; et al.
Adsorption properties of macroporous adsorbent resins for separation of anthocyanins from mulberry.
Food Chem. 2016, 194, 712–722. [CrossRef] [PubMed]
33. Buran, T.J.; Sandhu, A.K.; Li, Z.; Rock, C.R.; Yang, W.; Gu, L. Adsorption/desorption characteristics
and separation of anthocyanins and polyphenols from blueberries using macroporous adsorbent resins.
J. Food Eng. 2014, 128, 167–173. [CrossRef]
34. Liang, X.; Wu, H.; Su, W. A rapid UPLC-PAD fingerprint analysis of chrysanthemum morifolium ramat
combined with chemometrics methods. Food Anal. Method. 2014, 7, 197–204. [CrossRef]
35. Yan, F.; Chen, Y.; Azat, R.; Zheng, X. Mulberry Anthocyanin Extract Ameliorates Oxidative Damage in
HepG2 Cells and Prolongs the Lifespan of Caenorhabditis elegans through MAPK and Nrf2 Pathways.
Oxid. Med. Cell. Longev. 2017, 2017. [CrossRef] [PubMed]
36. Hwang, Y.P.; Choi, J.H.; Choi, J.M.; Chung, Y.C.; Jeong, H.G. Protective mechanisms of anthocyanins from
purple sweet potato against tert-butyl hydroperoxide-induced hepatotoxicity. Food Chem. Toxicol. 2011, 49,
2081–2089. [CrossRef] [PubMed]
Sample Availability: Samples of the compounds are not available from the authors.
© 2018 by the authors. Licensee MDPI, Basel, Switzerland. This article is an open access
article distributed under the terms and conditions of the Creative Commons Attribution
(CC BY) license (http://creativecommons.org/licenses/by/4.0/).You can also read