Improving the Technological and Nutritive Properties of Gluten-Free Bread by Fresh Curd Cheese Enrichment - MDPI
←
→
Page content transcription
If your browser does not render page correctly, please read the page content below
applied
           sciences
Article
Improving the Technological and Nutritive Properties
of Gluten-Free Bread by Fresh Curd
Cheese Enrichment
Carla Graça, Anabela Raymundo                 and Isabel Sousa *
 Linking Landscape, Environment, Agriculture and Food (LEAF) Research Center of Instituto Superior
 de Agronomia, Universidade de Lisboa, Tapada da Ajuda, 1349-017 Lisboa, Portugal;
 carlalopesgraca@isa.ulisboa.pt (C.G.); anabraymundo@isa.ulisboa.pt (A.R.)
 * Correspondence: isabelsousa@isa.ulisboa.pt; Tel.: +351-21-365-3246

 Received: 27 August 2020; Accepted: 28 September 2020; Published: 30 September 2020

 Abstract: Replacing wheat flour in the breadmaking process is a technology challenge since the
 elimination of gluten has a strong influence on bread quality. Proteins addition are often used to form
 a protein network capable of mimicking gluten-like structure, giving to dough a foaming support.
 This study aimed to evaluate the potential of denatured whey proteins coming from fresh curd cheese
 addition, to strengthening gluten-free dough structure, enhancing the breadmaking performance.
 Curd cheese additions were tested (5% up to 20%, weight/weight) and the effect on dough rheology
 behavior and bread quality was evaluated. Findings obtained revealed that the technology and
 nutritional properties of the bread can be enhanced by curd cheese addition, and such effects should
 be related to the composition and functionality of denatured whey proteins. Considering higher levels
 of curd cheese (20%) tested, improvements on bread quality was observed, leading to a considerable
 increase in bread volume (73%), softness (65%), with a significant reduction on staling kinetics (70%),
 comparing with control bread. Additionally, an improvement in nutritional value in terms of proteins
 (80%) and minerals content (P—50.0%, Mg—6.0%, and Ca—360.3%) was obtained, which can give an
 additional contribution to the nutritional daily requirements of celiac patients. Linear correlations
 between dough rheology properties and bread quality attributes were found, supporting the good
 breadmaking performance obtained.

 Keywords: curd cheese enrichment; whey protein; mimic gluten structure; dough rheology; bread
 texture; gluten-free bread

1. Introduction
     The demand for gluten-free products, especially bread, has been growing since the number of
celiac disease diagnoses, as well as other gluten intolerance cases, have been increasing, requiring the
absence of gluten from the diet [1].
     Celiac disease is characterized by a small gut inflammation via autoimmune response to specific
peptides of gliadin, one of the gluten proteins [2]. This gluten intolerance can lead to several
health-associated disorders, as the damage and atrophy of the gut villi results in malabsorption of
nutrients [2], with a great impact on health.
     Gluten is the main structure-forming protein in flour, responsible for the dough viscous-elasticity
features that contribute to a good appearance and crumb structure of the baked goods [3]. The protein
fractions in the gluten network are glutenin and gliadin: the former gives elasticity to dough, while
gliadin produces a viscous, fluid mass, under hydration conditions. The gluten matrix is a protein
structure determinant of wheat dough properties such as dough resistance to stretch, extensibility,

Appl. Sci. 2020, 10, 6868; doi:10.3390/app10196868                             www.mdpi.com/journal/applsci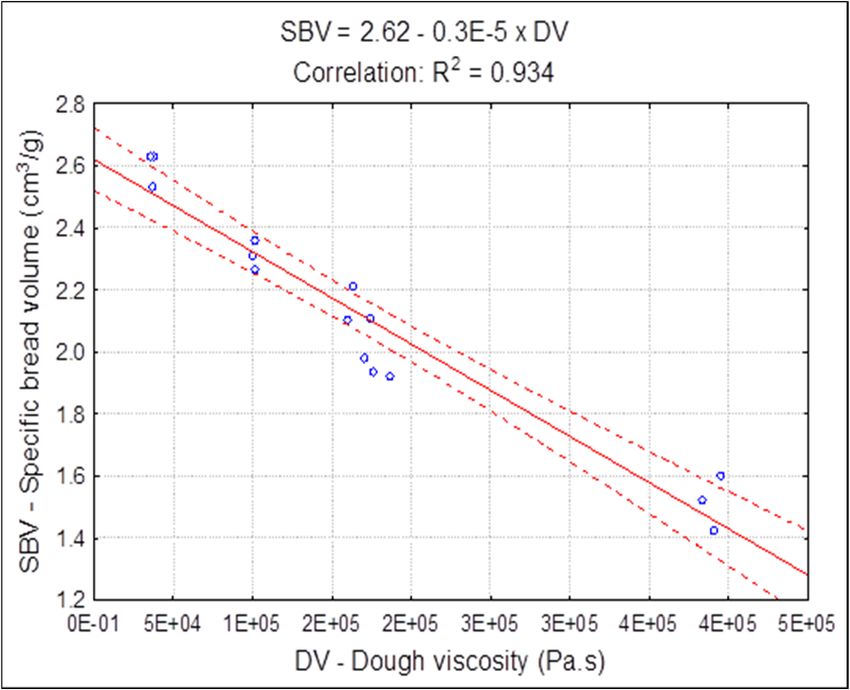
Appl. Sci. 2020, 10, 6868                                                                            2 of 15

gas retention capacity, bread volume, and softness, responsible for the quality of final products.
Therefore, gluten removal results in major technological problems leading to low quality and short
shelf life of the gluten-free products [1]. The technological challenge of gluten removal has led to the
search for alternatives to mimic gluten structure in the manufacture of gluten-free bakery goods [1–7].
     In addition, the nutritive value of the gluten-free bread (GFB) presents, generally, a deficient
nutritional profile of protein and minerals, but high contents of carbohydrates and fat [4].
     To overcome this challenge, several approaches were taken in the last few years, as the use
of gluten-free cereal flours (e.g., rice and corn flours) [5], pseudocereals (e.g., quinoa, amaranth,
buckwheat) [6], and starches (corn, potato, cassava) [5–8]. To mimic the gluten-like structure, the usage
of certain hydrocolloids such as hydroxypropyl-methyl-cellulose and guar and/or xanthan gum [5,7],
have been widely tested to enhance the dough viscoelastic features and GFB technological properties [8].
     Proteins are naturally good hydrocolloids and one of the main molecule classes available to
improve desirable textural attributes, promoting crosslinking and aggregation mechanisms, with a
great impact on food structure. They are extensively used in different gluten free formulations, such as
egg albumin and whey protein [1,9], due to their functionality, based on water binding and holding
capacity, emulsifier, foaming, and gelling properties. In addition, proteins present a key role in Maillard
reactions, which are responsible for color development, needed to improve the appearance of GFB
crust [10].
     Dairy proteins are interesting ingredients to enhance the nutritional properties of GFB due to their
protein content and balanced amino acids profile, minerals content as calcium and phosphorus, as well
as functional properties on baking performance [11].
     A recent work showed that the incorporation of fresh dairy products on wheat bread formulations
increased the nutritional value and improved the texture and other bread quality attributes [12].
Other researchers showed relevant enhancements in breadmaking, by the addition of whey protein
(WP) on GFB formulations, reporting the capacity to increase water absorption, improving the handling
properties [13]. Good thermal gelation capacity of WP inducing viscoelastic gels by protein network,
capable of supporting dough foaming, was also reported [14].
     Curd cheese (Cc) is a coproduct obtained by the thermal denaturation and subsequent precipitation
of the soluble whey proteins. These products are considered to have a high protein nutritional value,
representing of 20–30% of the proteins present in bovine milk (beta-lactoglobulin, alfa-lactalbumin)
and are considered to be an important source of essential amino acids (leucine, isoleucine, and valine)
and minerals (e.g., Ca and P) [15].
     Therefore, the enrichment of GFB with fresh Cc can be an interesting approach to enhance their
nutritional value, and the combination between vegetable (cereal) and animal proteins (denatured
whey protein from Cc) could represent an alternative to mimic a foam structure support like the gluten
network, improving bread quality.
     This research work aimed to evaluate the influence of the fresh Cc addition on gluten-free
breadmaking performance, to improve the GFB quality. Various levels of Cc addition into a gluten-free
dough were tested, and the effect on dough rheology properties, by mixing curves, steady shear
flow behavior, and small amplitude oscillatory assays, was assessed. The impact on GFB quality,
by evaluating the loaf firmness and staling kinetics during the storage time, as well as by the after-baking
quality attributes and the nutritive value, were also evaluated.

2. Materials and Methods

2.1. Raw Materials
     GFB were prepared using rice flour (Próvida, Pêro Pinheiro, Portugal), buckwheat flour
(Próvida, Pêro Pinheiro, Portugal), and potato starch (Colmeia do Minho, Paio Pires, Portugal)
according to the GFB recipes earlier described by Graça et al. [16]. Detailed nutritional composition of
the gluten-free flours used were described earlier by other authors [16].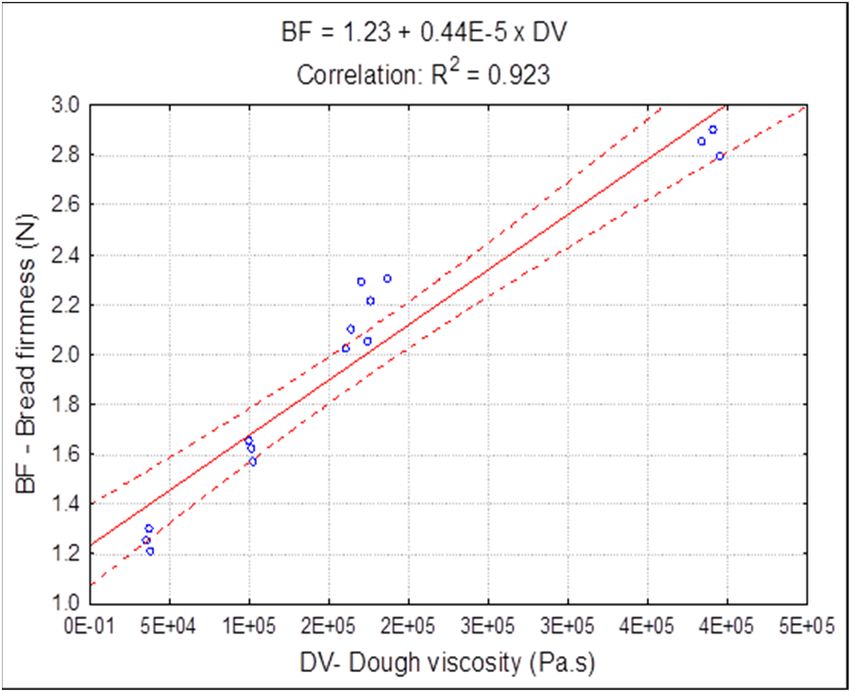
Appl. Sci. 2020, 10, 6868                                                                                            3 of 15

      The fresh Cc lactose-free used was a commercial product from Lacticínios do Paiva
(Lamego, Paiva, Portugal), obtained by the soluble protein thermal denaturation/precipitation of
the whey resulting from the production of the lactose free cheeses; the dry extract of Cc (31.2%,
dry matter) and respective nutritional composition were determined and described in previous
works [12,16].
      Other ingredients used were commercial saccharose (Sidul, Santa Iria de Azóia, Portugal),
salt (Vatel, Alverca, Portugal), dry yeast (Fermipan, Setúbal, Portugal), vegetable fat (Vegê, Sovena
Group, Algés, Portugal), and xantham gum (XG) (Naturefoods, Lisboa, Portugal) [12,16].

2.2. Gluten-Free Bread Dough Preparation
    GFB dough formulations were prepared according to the procedure earlier described by
Graça et al. [16]: the yeast was activated in warm water; dry ingredients were incorporated, well
mixed, and kneaded for 10 min; dough was fermented/leavened for 20 min at 30 ◦ C, followed by
baking at 180 ◦ C during 30 min under convection, according to the breadmaking conditions earlier
described [16]. Baking trials were performed in triplicates.
    The GFB formulations tested are presented in Table 1.

                Table 1. Bread formulations tested: control bread (CB) and curd cheese breads (CcB).

         Ingredients (% w/w)                CB            CcB5%           CcB10%           CcB15%          CcB20%
              Buckwheat                    16.6             14.6             12.6            10.6             9.6
                 Rice                      25.0             22.0             20.0            16.6             13.0
             Potato starch                 14.0             12.0             11.0            10.4             8.0
             Curd cheese                    0.0             5.0              10.0            15.0             20.0
            Water added **                 37.0              35              32.0            31.0             30.0
        Curd cheese water ***               0.0              4.0              7.0             9.0             12.0
      Total water absorption ****          37.0             39.0             39.0            40.0             42.0
      Other ingredients kept constant: 7.4%; ** Determined by MicrodoughLab mixing curves; *** Water deriving for curd
      cheese incorporation; **** Total water absorption = water added + water deriving from Cc incorporation.

     Considering the water coming from the different Cc additions tested, the water added (WAD)
was determined by MicrodoughLab mixing curves, and the water absorption was calculated according
to the procedure earlier described by Graça et al. [16]. Cc doughs were prepared by successive
incorporations of 10, 20, 30, and 40 g of Cc into dough (5% up to 20% w/w). Replacements were based
on gluten-free flours basis, substituting the dry extract of each Cc percentage on 100 g of flour [16].
Ingredients kept constant: salt—0.8%; saccharose—1.6%; yeast—1.6%, XG—0.3%, and vegetable
fat—3.1% (sum of ingredients = 7.4%) (Table 1).

2.3. MicrodoughLab Measurements

Mixing Curves
     Mixing dough behavior of control dough and doughs produced with Cc additions, was studied
using the MicrodoughLab equipment (Perten instruments, Hägersten, Sweden), according to the
specific protocol: 4 g of gluten-free flours mixed for 20 min at 30 ◦ C under constant speed, 63 rpm.
The parameters recorded from the mixing curves that characterize the dough rheology behavior are
(AACC, 54–60.01): (WA) water absorption, or the amount of water required to reach the optimal dough
consistency (mL of water/100 g of flour, at 14.0% of moisture basis), (DDT) dough development time
or required time to reach the maximum dough consistency, (DST) dough stability during mixing,
corresponding the time at which dough kept the maximum consistency; (DSF) dough softening degree
or mixing tolerance index. Mixing curves were triplicated.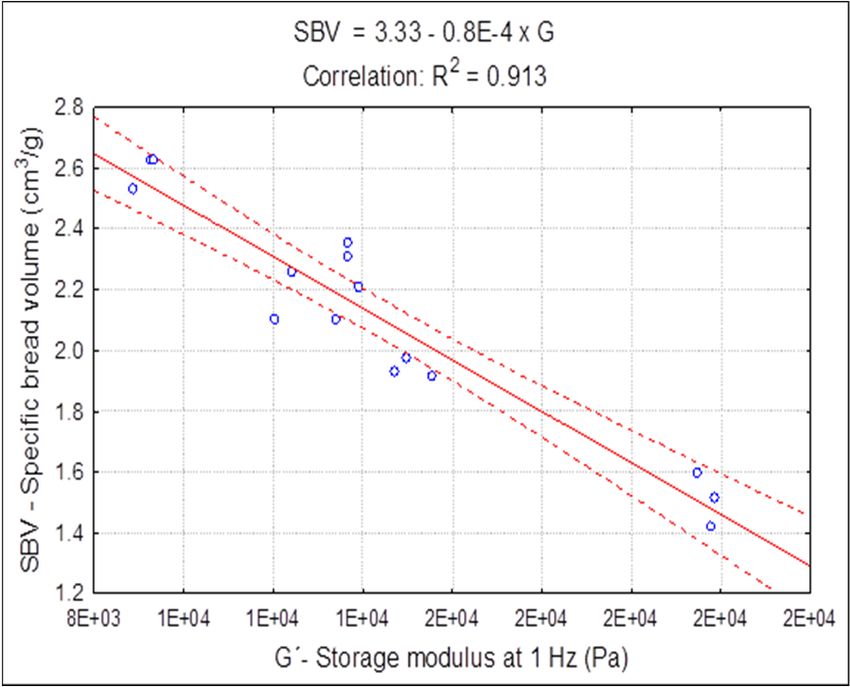
Appl. Sci. 2020, 10, 6868                                                                               4 of 15

2.4. Dough Rheology Characterization
     The dough rheology measurements were assessed according to the method earlier described
by Graça et al. [16]. Briefly, rheology measurements (Haake Mars III—Thermo Scientific, Karlsruhe,
Germany, Universal Temperature Control-Peltier system), on the fermented dough (20 min), using a
serrated parallel plate as sensor system (PP35 and 1 mm gap), to avoid the split effect [17], and under
cold conditions (at 5 ◦ C) to inactivate the yeast, were performed in triplicates.

2.4.1. Steady-Shear Dough Behavior
    The influence of the Cc addition on dough viscosity behavior was evaluated according to the
method earlier described by Graça et al. [16]: shear steady conditions, varying the shear rate varied
from 1.00 × 10⁻⁶ to 1.00 × 10³ s−1 .
    Experimental rheology data were compared and model by Carreau Model, applying Equation (1):

                                           η = η0 /[1 + (γ./γ.c )2 ] s                                     (1)

where the fitted parameters obtained corresponds to: η is the apparent viscosity (Pa. s), γ. is the
shear rate (s−1 ), η0 is the zero-shear rate-viscosity (Pa. s), γ.c is the critical shear rate at the onset of
the shear-thinning behavior (s−1 ), i.e., the value corresponding to the transition from Newtonian to
shear-thinning behavior and s is a dimensionless parameter related to the slope of this region.

2.4.2. Dynamic-Shear Dough Behavior
     The impact of the Cc enrichment on dough linear viscoelastic properties, by the elastic (G’) and
viscous (G”) moduli changes, by small-amplitude oscillatory measurements was applied, according to
the method earlier described by other authors [16]: 0.001 to 100.0 Hz of frequency ranging, at 10 Pa of
shear stress within the linear viscoelastic region (determined at 1 Hz).
     In all rheology methods described above, triplicates were performed.

2.5. After-Baking Quality Parameters of the GFB

2.5.1. Bread Texture and Staling Kinetics
     Bread crumb texture (BCT) was evaluated following the methods earlier described
Graça et al. [12,16,18]: penetration mode, by puncture test, using a Texturometer Stable MicroSystems
(Surrey, UK). Triplicates of each 10-bread crumb firmness measurement repetitions were performed.
     BCT of the different Cc breads was compared in terms of firmness, and bread staling kinetics
(during a storage time of 96 h), in accordance with a procedure previously described [12,16].
     Applying the linear Equation (2) the bread staling kinetics was described as a function of time,

                                         Firmness = A × time + B                                           (2)

where A (N/h) corresponds to the staling kinetics and B (N) the initial firmness of the GFB [16].

2.5.2. Breadmaking Properties
    Post-baking quality parameters of the GFB: moisture (%), water activity (aw), bake loss (BL),
and specific bread volume (SBV) (cm3 /g), were evaluated, according to the procedures previously
reported [12,16]. Triplicates were performed.
    Bread crumb and crust color were recorded by Minolta colorimeter using illuminative D65
(Chromameter CR-400, Minolta-Japan), as earlier described [16].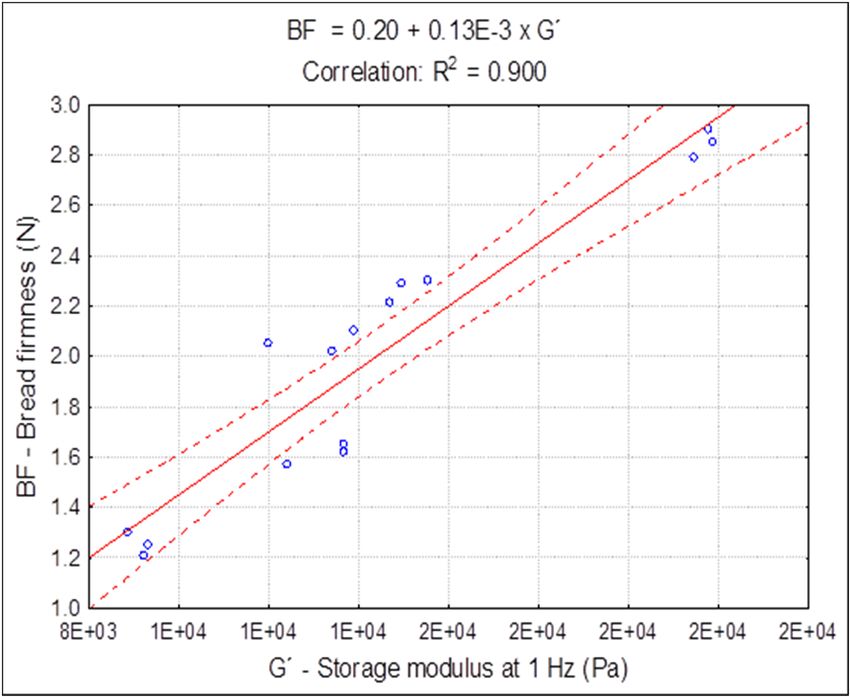
Appl. Sci. 2020, 10, 6868                                                                                                         5 of 15

     Differences in bread color (∆E) between control bread (CB) and curd cheese breads (CcB) was
calculated by Equation (3):

                      ∆E = [(L* CcB − L* CB)2 + (a* CcB − a* CB)2 + (b* CcB − b* CB)2 ]1/2                                            (3)

2.6. Nutritional Value of the GFB
     Nutritionally, the obtained GFBs were characterized based on the proteins (ISO-20483:2006),
lipids (NP 4168), ash (AACC Method 08–01.01), carbohydrates (estimated by difference), and total
minerals (ICP-AES-Inductively Coupled Plasma-Atomic Emission Spectrometry) contents, following
the Standard Methods described previously by Graça et al. [12,16]. Triplicates were performed.

2.7. Statistical Analysis
     Statistical analysis of the experimental data (average values and standard deviation) (RStudio,
Version 1.1.423) using variance test in one factor (ANOVA), by Tukey test (post-hoc comparisons, at 95%
of significant level), were assessed. A Nonlinear Rheology Model, to fit the experimental rheology
data was applied (Carreau model using TA Instruments/TRIOS software).

3. Results and Discussion

3.1. MicrodoughLab Mixing Curves
   The impact of Cc additions on dough mixing properties was evaluated and the mixing parameters,
summarized in Table 2, were used to characterize the effect of Cc additions on mixing behavior.

      Table 2. Comparison of Microdoughlab mixing parameters: WA—water absorption (%), DDT—dough
      development time (min), DST—dough stability (min), DSF—dough softening degree (mNm), for
      control dough (CD) and curd cheese doughs (CcD5% up to CcD20%).

                Samples                WA (%)               DDT (min)              DST (min)             DSF (mNm)
                   CD              66.30 ± 0.60    a       0.80 ± 0.10   a         0.80 ± 0.10  a         3.30 ± 0.61 a
                 CcD5%             66.70 ± 0.60 a          0.70 ± 0.10 a           0.60 ± 0.20 a          3.00 ± 0.12 a
                 CcD10%            67.70 ± 0.50 a          0.70 ± 0.20 a           0.60 ± 0.10 a          3.00 ± 0.63 a
                 CcD15%            69.30 ± 0.50 ab         0.90 ± 0.50 ab          0.60 ± 0.15 a          5.30 ± 0.60 b
                 CcD20%            70.30 ± 0.60 b          1.00 ± 0.10 b           0.60 ± 0.10 a          6.00 ± 0.30 b
      Different superscripts (a , b ) indicate significantly statistical differences between CB and CcB. (at p ≤ 0.05, Tukey test).

     From Table 2, it can be observed that up to 10% of incorporation, no significant (p > 0.05)
impact on water absorption (WA), dough development time (DDT), dough stability (DST), and dough
softening (DSF), was registered. However, for higher levels of Cc tested, 15% and 20%, the WA
increased, probably due to the increased amounts of proteins in dough matrix, requiring more water
to improve the connectivity of the network developed by starch-protein-xanthan gum, reinforced by
hydrogen bonds [19]. The DDT also increased with 15% of Cc addition, resulting from the increase in
solids content associated with difficulties in dough homogenization. In terms of dough stability, no
significant differences were observed. However, Cc additions led to a significant (p < 0.05) increase
of dough softening after 15% of Cc addition, reflecting the weakening of dough structure. Although
the Cc addition promoted a slight impact on dough mixing properties, in terms of DDT and DSF,
these effects can be considered as an additional support of denatured WP (coming from Cc) to dough
plasticity or extensibility, which can be crucial during the fermentation process to dough expansion
and gas retention.
Appl. Sci. 2020, 10, 6868 6 of 15
Appl. Sci. 2020, 10, x 6 of 15
3.2. Dough
3.2. DoughRheology
RheologyCharacterization
Characterization
3.2.1. Gluten-Free
3.2.1. Gluten-FreeDough
DoughFlow
FlowBehavior
Behavior
Figure 11shows
Figure showsthe
theimpact
impactof
ofCc
Ccadditions,
additions,on
onsteady-shear
steady-shearflow
flowbehavior
behaviorof
ofgluten-free
gluten-freedoughs,
doughs,
in comparison to control dough (CD).
in comparison to control dough (CD).
1.0E+06
CD
1.0E+05
ɳap - Apparent viscosity (Pa.s)
1.0E+04 CcD5%
1.0E+03
CcD10%
1.0E+02
CcD15%
1.0E+01
CcD20%
1.0E+00
1.0E-01
1.0E-06 1.0E-04 1.0E-02 1.0E+00 1.0E+02 1.0E+04
γ. - Shear rate (s-1)
Figure
Figure 1.
1. Flow
Flow rheology behavior
behaviorof
ofthe
thecontrol
controldough
dough (CD)
(CD) and
and CcCc doughs
doughs (CcD):
(CcD): 5% to
5% up up20%,
to 20%,
w/w.
w/w.
The flow curves indicated that all these systems behaved as typical structured materials, showing
a Newtonian
The flowplateau
curvesregion at lowthat
indicated shear allrates and
these dough viscosity
systems behaved began to decrease
as typical as thematerials,
structured shear rate
values increase,
showing reflecting
a Newtonian a typical
plateau regionshear-thinning
at low shear ratesbehavior. Theseviscosity
and dough results agree
began with those obtained
to decrease as the
by other
shear rateauthors [19,20], using
values increase, different
reflecting gluten-free
a typical flours and
shear-thinning hydrocolloids
behavior. on GFBagree
These results formulations.
with those
obtainedCarreau equation
by other was [19,20],
authors adjustedusingto thedifferent
experimental data from
gluten-free floursFigure 1 (R2 > 0.975) on
and hydrocolloids andGFBthe
obtained rheology fitted parameters, summarized in Table 3, were used to characterize the dough flow
formulations.
behavior:
Carreau Cc equation
incorporations to doughto
was adjusted promoted a significant
the experimental datareduction on apparent
from Figure 1 (R2 > viscosity values
0.975) and the
(η0 ) ranging
obtained from 390.2
rheology fittedkparameters,
Pa s for CD to 37.3 k Pa s for
summarized CcD20%
in Table (higher
3, were usedCctolevel tested), representing
characterize the dough
a decrease
flow in viscosity
behavior: of aroundto
Cc incorporations 90.0%.
doughConsidering
promoted athe significant
significant reduction
reduction in dough viscosity
on apparent viscosity
observed,
values (η0)promoted
ranging from by the Cc addition
390.2 k Pa s for to dough, the dilution
CD to 37.3 k Pa s for effect of starch-proteins-xanthan
CcD20% (higher Cc level tested),gum
linkage density,
representing of the GFB
a decrease reference,
in viscosity of should
aroundbe invoked
90.0%. to support
Considering thethese findings.
significant reduction in dough
viscosity observed, promoted by the Cc addition to dough, the dilution effect of starch-proteins-
xanthan Table
gum3. Fitted rheology
linkage parameters
density, estimated
of the GFB for control
reference, dough
should (CD) and curd
be invoked cheese doughs
to support (CcD5%
these findings.
up to CcD20%), by applying Carreau Model.
Table 3. Fitted rheology parameters estimated for control dough (CD) and curd cheese2 doughs
η0 (k Pa s) γ.c (s−1 ) s (Slope) R
(CcD5% up to CcD20%), by applying Carreau Model.
CD 390.2 ± 8.7 a −3 −4 a 0.27 ± 0.06 a 0.987
3.3 × 10 ± 1.3 × 10
CcD5% 166.4 Pab s)
η0 ±(k5.0 3.1 × 10γ.−3c ±
(s4.0
−1)
× 10−4 a 0.26 ± 0.03 a R2 0.987
s (Slope)
−3 ± 2.3 × 10⁻⁴
CcD10% CD 178.0 ± 6.6
390.2 b a
± 8.7 3.2 ×× 10
3.3 10−3 ± 1.3 × 10 −4aa 0.270.23 ± 0.03
± 0.06 a ab
0.987 0.980
CcD15% 101.5 ± 1.7 c −3 ± 4.8 × 10⁻⁴ a b 0.996
CcD5% 166.4 ± 5.0 b 3.6 × 10
3.1 × 10⁻³ 0.21 ± 0.04
± 4.0 × 10⁻⁴ a 0.26 ± 0.03 a 0.987
CcD20% 37.3 ± 4.0 d b 3.6 × 10⁻³ −3 ± 2.3 × 10⁻⁴ a 0.18 ± 0.09 b 0.975
CcD10% 178.0 ± 6.6 3.2 × 10 ± 2.3 × 10
−4 a ab 0.23 ± 0.03 0.980
Different superscripts (a , b , c , d ) indicate CcD (at p ≤ 0.05,
Tukey test).
CcD15% 101.5 ± 1.7 c significant 3.6 × 10⁻³statistical
± 4.8 × 10differences
−4 a between CD
0.21 ± 0.04 b and
0.996
CcD20% 37.3 ± 4.0 d 3.6 × 10⁻³ ± 2.3 × 10⁻⁴ a 0.18 ± 0.09 b 0.975
Based on the values of critical shear rate (γ.c ), the transition of the Newtonian to shear-thinning
Different superscripts (a, b, c, d) indicate significant−3statistical differences between CD and CcD (at p ≤
behavior of all systems occurred around 3.4 × 10 s−1 .
0.05, Tukey test).
Concerning the dough flow index (slope), the addition of Cc up to 10% did not significantly
(p > 0.05) change the dough’s flow behavior, presenting values like CD (0.27–0.23). Nevertheless,
Based
as the amounton the values
of Cc of critical
increases, shear
the flow rate was
index (γ c),significantly
the transition . of the Newtonian
reduced, varying fromto0.27
shear-thinning
(CD) to 0.18
behavior of all systems occurred around 3.4 × 10 s . −3 −1
Appl. Sci. 2020, 10, x; doi: www.mdpi.com/journal/applsciAppl. Sci. 2020, 10, 6868 7 of 15
for high Cc level tested (CcD20%). This increase in shear thinning behavior is probably due to the
formation of longer and more flexible polymer-chains [21].
Similar findings were reported by other researchers [22] to evaluate the effect of other hydrocolloids
addition on the rheology features of the GF cakes. According to a previous study [23], lower flow
indexes led to a quick decrease in dough viscosity, which can improve the capacity of dough to expand
and retain more gas during baking.
3.2.2. Gluten-Free Dough Viscoelastic Behavior
Rheology behavior of the GF doughs focused on storage (G’) and loss (G”) moduli changes with
oscillatory frequency, was assessed on fermented doughs. Results are illustrated in Figure 2A–D,
Appl. Sci. 2020, 10, x 8 of 15
where different viscoelastic functions can be observed between CD and Cc doughs obtained.
A
B
C
1.E+05 Figure 2. Cont.
D
G´ (Pa) ; G´´ (Pa)
1.E+04
1.E+03
G´-CD G´´- CD G´- Cc20% G"- Cc20%
1.E+02
1.E-03 1.E-02 1.E-01 1.E+00 1.E+01 1.E+02
f (Hz)Appl. Sci. 2020, 10, 6868 8 of 15
1.E+05
D
G´ (Pa) ; G´´ (Pa)
1.E+04
1.E+03
G´-CD G´´- CD G´- Cc20% G"- Cc20%
1.E+02
1.E-03 1.E-02 1.E-01 1.E+00 1.E+01 1.E+02
f (Hz)
Figure 2. Rheology changes in viscoelastic functions, storage (G’, full symbols) and loss (G”, empty
Figure 2. Rheology changes in viscoelastic functions, storage (G’, full symbols) and loss (G”, empty
symbols) moduli, by the additions of curd cheese to dough (CcD5% up to CcD20% w/w), compared
symbols) moduli, by the additions of curd cheese to dough (CcD5% up to CcD20% w/w), compared
with viscoelastic profile of the control dough (CD) (black round symbols): (A) CD vs. Cc5%; (B) CB vs.
with viscoelastic profile of the control dough (CD) (black round symbols): (A) CD vs. Cc5%; (B) CB
Cc10%; (C) CB vs. Cc15%; (D) CB vs. Cc20%.
vs. Cc10%; (C) CB vs. Cc15%; (D) CB vs. Cc20%.
Starting for CD, at low frequency, a poorly structured system can be observed, since the values of G”
are higher than G’, characteristic of a typical viscoelastic fluid behavior [22]. Nevertheless, the crossover
of both moduli occurred with the frequency increase, and the dominance of the G’ over the G” was
observed, expressing
Appl. Sci. 2020, 10, x; doi: a weak gel behavior [24]. For Cc doughs, a typical weak-gel structure can be
www.mdpi.com/journal/applsci
observed [25], where the G’ values were greater than the G” over the whole range of frequency applied,
indicating the predominance of the solid-elastic behavior [24], with high frequency dependence [26].
The values of both G’ and G” were decreasing with Cc incorporations. The viscoelastic behaviors
observed suggested that the presence of denatured WP, coming from Cc addition, are promoting a new
network or/and protein agglomerates, giving more complexity to dough matrix. On the other hand,
the increasing amount of lipids coming from the Cc additions enhance extensibility by the lubrication
effect on the macromolecular chains resulting in the reduction of the viscoelastic parameters, increasing
the plasticity of the doughs. The viscoelasticity of the gluten-free dough (GFD) depends strongly on
intra and intermolecular interactions, i.e., a network with a desirable viscoelastic behavior, required for
breadmaking. The chemical composition and functional properties of Cc proteins and their interactions
are responsible for the changes in dough viscoelastic behavior.
From the results obtained, it can be stated that the Cc addition into dough promoted significant
changes in dough viscoelastic profile, that probably can result in higher dough protein network ability
to inflate and retain more CO2 , due to a flexible protein network, reducing considerably the dough
viscoelastic parameters, under oscillatory measurements. Similar reports were obtained by other
authors [27], where the addition of different protein sources to dough produced smaller G’ and G”
values, causing the reduction of consistency. This behavior can result in better quality properties based
on the bread texture and volume [28].
3.3. Quality Characterization of the Gluten-Free Bread
3.3.1. Bread Crumb Texture and Hardening Kinetics
Bread crumb firmness is an important parameter used to evaluate the bread quality, that influences
the consumers acceptability. To measure the effect of Cc addition on bread firmness, during 4 days of
storage time (96 h), a puncture test was applied [12,16,18], to mimic the teeth chewing of the human
sensory perception.
The mean values of bread crumb firmness (BCF) of CB and CcB are illustrated in Figure 3, showing
that for all Cc amounts tested, bread crumb was softer than for CB, as the Cc levels increase in
GFB formulations.Appl.
Appl.Sci. 2020,10,
Sci.2020, 10,6868
x 99 of
of 15
15
7.0
CB CcB5% CcB10% CcB15% CcB20%
6.0
Bread crumb firmness (N)
5.0
4.0
3.0
2.0
1.0
0.0
0 20 40 60 80 100
Time (hours)
Figure 3.3. Evaluation of the gluten-free bread (GFB)
Figure (GFB) crumb
crumb firmness
firmness progression,
progression, (96
(96 hh at
at room
room
temperature), between control bread (CB) and curd cheese bread (CcB5% up to CcB20%).
temperature), between control bread (CB) and curd cheese bread (CcB5% up to CcB20%).
Initial
Initialand
andfinal
finalvalues of of
values BCF varied
BCF fromfrom
varied 2.70 2.70
N to N6.50toN6.50
for CB andCB
N for 1.12
andN to 2.30NNtofor2.30
1.12 CcB20%,
N for
representing a reduction on the firmness of around 55% (initial) and 65% (final).
CcB20%, representing a reduction on the firmness of around 55% (initial) and 65% (final). This This behavior suggests
abehavior
high functionality
suggests aofhighthe denatured WPof
functionality in the
breadmaking
denaturedperformance. Higher firmness
WP in breadmaking valuesHigher
performance. of CB
seem to be consistent with high viscosity and viscoelastic moduli values exhibited
firmness values of CB seem to be consistent with high viscosity and viscoelastic moduli values for CD, probably
due to stiffer
exhibited forstructure effect promoted
CD, probably by xanthan
due to stiffer structure gum, reducing
effect promotedthe dough expansion,
by xanthan gum, consequently
reducing the
leading to firmer breads. Similarly, Demirkesen et al. [21] reported an increase
dough expansion, consequently leading to firmer breads. Similarly, Demirkesen et al. [21] reportedof BCF by xanthan gum
addition in GFB.
an increase of BCF by xanthan gum addition in GFB.
Staling
Stalingofofbread
breadduring
duringthethe
storage timetime
storage is a is
consequence
a consequence of humidity loss, and
of humidity loss,subsequent starch
and subsequent
crystallization/retrogradation phenomena, leading to an increase of crumb firmness
starch crystallization/retrogradation phenomena, leading to an increase of crumb firmness values values [28].
[28].Linear correlations were determined to describe the staling kinetics of the GFB, under controlled
storage conditions
Linear (96 h atwere
correlations room temperature).
determined The obtained
to describe linearkinetics
the staling parameters,
of thesummarized in Table 4,
GFB, under controlled
reflects the influence of Cc incorporations on the bread staling rate (Equation
storage conditions (96 h at room temperature). The obtained linear parameters, summarized in Table(2)).
4, reflects the influence of Cc incorporations on the bread2staling rate (Equation (2)).
Table 4. Linear parameters derived by linear correlation (R > 0.972): A—bread staling rate (N/h) and
B—initial bread firmness (N), for control bread (CB) and curd 2cheese bread obtained (CcB).
Table 4. Linear parameters derived by linear correlation (R > 0.972): A—bread staling rate (N/h)
and B—initial bread firmness (N),Staling
Cc Levels for control
Rate bread
(N/h) (CB) Firmness
and curd cheese
(N) breadRobtained
2 (CcB).
CB ± 0.001
0.040 Rate a 0.23 a
2.70 ±Firmness
Cc Levels Staling (N/h) (N) 0.996 R2
CcB5% 0.032 ± 0.002 ab 2.21 ± 0.40 ab 0.998
CB 0.040 ± 0.001 c a 2.70 ± 0.23 a 0.996
CcB10% 0.022 ± 0.001 1.90 ± 0.30 b 0.981
CcB5% 0.032 ± 0.002 ab 2.21 ± 0.40 ab 0.998
CcB15% 0.020 ± 0.003 c 1.57 ± 0.09 c 0.979
CcB10%CcB20% 0.022
0.012 ±± 0.001
0.002 d
c
1.12 ± 1.90
0.15 d± 0.30 0.972 0.981
b
CcB15% 0.020 ± 0.003 c 1.57 ± 0.09 c 0.979
Different superscripts (a , b , c , d ) indicate significant statistical differences between CB and CcB: CcB5% up to CcB20%
CcB20%
(at p ≤ 0.05, Tukey 0.012 ± 0.002
test); A and B linear parameters d 1.12 ±(2):0.15
were obtained by Equation d
Firmness = A ×0.972
time + B.
Different
The superscripts
Cc bread staling (rate
, , ,values
) indicate
were significant
a b c d statistical
substantially lowerdifferences
than CBbetween CB and CcB:
value, ranging fromCcB5%
0.032 N/h
up to CcB20% (at p ≤ 0.05, Tukey test); A and B linear parameters were obtained
for lower incorporation (CcB5%) to 0.012 N/h for higher additions (CcB20%), compared to 0.040 by Equation (2): N/h
Firmness = A × time + B.
obtained for CD, a reduction about 70% of staling. Results reported by Gallagher et al. [13], by evaluating
the effect of dairy powder addition on GFB shelf-life, are similar with those obtained. These findings
The Cc bread staling rate values were substantially lower than CB value, ranging from 0.032 N/h
are also in line with those obtained by other researchers [12], by testing the fresh dairy products
for lower incorporation (CcB5%) to 0.012 N/h for higher additions (CcB20%), compared to 0.040 N/h
addition to improve the wheat bread quality.
obtained for CD, a reduction about 70% of staling. Results reported by Gallagher et al. [13], by
The functionality of the Cc protein should be considered to explain these results of bread texture
evaluating the effect of dairy powder addition on GFB shelf-life, are similar with those obtained.
and bread aging rate, whose positive effects can be associated to the capability of these proteins to
These findings are also in line with those obtained by other researchers [12], by testing the fresh dairy
bind with water and retain moisture, retarding the starch retrogradation and hence the increase of
products addition to improve the wheat bread quality.
bread hardness [14]. On the other hand, these results suggest that the denatured WP relaxes the
The functionality of the Cc protein should be considered to explain these results of bread texture
and bread aging rate, whose positive effects can be associated to the capability of these proteins to
Appl. Sci. 2020, 10, x; doi: www.mdpi.com/journal/applsciAppl. Sci. 2020, 10, x 10 of 15
Appl. Sci. 2020, 10, 6868 10 of 15
bind with water and retain moisture, retarding the starch retrogradation and hence the increase of
bread hardness [14]. On the other hand, these results suggest that the denatured WP relaxes the
protein-starch-XGnetwork,
protein-starch-XG network,giving
givingtotodough
dough a foaming
foamingsupport
supporttotoretain
retainthe
thegases within,
gases improving
within, improving
thethe bread
bread textureby
texture byincreasing
increasingvolume
volume (Figure
(Figure 4)
4) and
and softening
softeningeffects
effects[29].
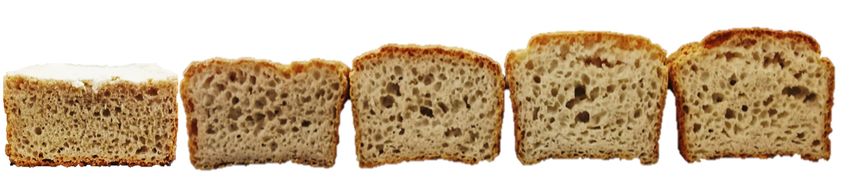
[29].Figure 4 shows
Figure 4 showsthethe
bread
bread
obtained with different levels of Cc addition, in comparison with
obtained with different levels of Cc addition, in comparison with CB. CB.
CB
CcB5% CcB10% CcB15% CcB20%
Figure
Figure 4. 4. Comparation
Comparation of the
of the resulted
resulted breads
breads obtained
obtained for control
for control breadbread (CB)those
(CB) and and breads
those breads
obtained
byobtained
differentby differentof
additions additions of curd
curd cheese cheese
(CcB): (CcB):
CcB5% upCcB5% up to. CcB20%.
to CcB20%
3.3.2. After-Baking
3.3.2. After-BakingParameters
Parametersof
of the
the Gluten-Free Bread
Gluten-Free Bread
Breadmaking
Breadmakingperformance
performance of of GFB
GFB produced
produced withwithCc Ccadditions
additionswas wasassessed
assessed byby bread
bread quality
quality
parameters:
parameters: moistness
moistness (%) water
(%) wateractivity (aw),
activity baking
(aw), lossloss
baking (BL,(BL,
%), %),
specific bread
specific volume
bread cm3 /g),
(SBV,(SBV,
volume
cm3and
crust /g), crust
crumb and crumb
color. color. are
Results Results are summarized
summarized in Tablein5.Table 5.
Moisture percentage of the breads (p < 0.05) increased by successively Cc additions, varying from
Table
43.0% 5. Bread
(CcB5%) to quality parameters:
51.0% (CcB20%), moisture,
compared towater
42.5%activity (aw),
of CB, an bakingofloss
increase 21%(BL), specific bread
in moisture. Water
volume (SBV), and bread crust and crumb color, for control bread (CB) and curd cheese
is the most important plasticizer in food structure, acting as chain polymer lubricant, reducing breads (CcB5%
stiffer
up to CcB20%).
linkage forces by increasing flexibility of structure effects [30]. Water activity (aw) was slightly
reduced as the Cc levels increase in bread formulations, from 0.960 for CB to 0.890 for CcB20% (upper
CB CcB5% CcB10% CcB15% CcB20%
Cc amount), a decrease of 7.3%, that will contribute to improving the preservation of bread during
a a b c
Moisture (%)
storage. 42.85 ± 0.33 43.02 ± 0.60 45.50 ± 0.43 47.80 ± 0.93 51.00 ± 0.13 d
aw 0.960 ± 0.006 a ab b
0.913 ± 0.005 c
0.892 ± 0.002 c
0.951 ± 0.004 0.943 ± 0.003
BL (%) 12.00 ± 0.40 a 11.00 ± 0.04 ab 10.22 ± 1.10 b 9.60 ± 0.80 b 9.00 ± 0.30 b
Table 5. Bread quality parameters: moisture, water activity (aw), baking loss (BL),bcspecific bread
SBV (cm3 /g) 1.50 ± 0.11 a 1.90 ± 0.08 a 2.10 ± 0.11 b 2.30 ± 0.15 2.50 ± 0.06 c
volume (SBV), and bread crust and crumb color, for control bread (CB) and curd cheese breads
(CcB5% up to CcB20%). Crust color
L* 59.60 ± 2.90 a 58.60 ± 1.64 a 51.80 ± 2.30 b 46.44 ± 3.13 c 36.80 ± 2.50 d
CB CcB5% CcB10% CcB15% CcB20%
a* 8.40 ± 1.00 a a 9.40 ± 0.51 aa 10.10 ± 0.94 bb 11.80 ± 0.80c bc 12.80 ± 0.30 c
Moisture
b*
(%) 42.85 ± 0.33
29.10 ± 1.43 a
43.02 ± 0.60
29.10 ± 1.20 a
45.50 ± 0.43
29.30 ± 1.10 a
47.80 ± 0.93 b 51.00 ± 0.13 d b
21.20 ± 2.53 21.10 ± 2.40
∆Eaw 0.960 ± 0.006 a 0.951
1.41 ±0.004
± 0.90 a
ab 0.943
8.00 ±0.003
± 1.02 b
b 0.913 ± 0.005
15.70 ± 1.80 c 0.892
c ± 0.002
24.60
c
± 1.30 d
BL (%) 12.00 ± 0.40 a 11.00 ± 0.04 ab 10.22 ± 1.10 b 9.60 ± 0.80 b 9.00 ± 0.30 b
Crumb color
SBV (cm3/g) 1.50 ± 0.11 a 1.90 ± 0.08 a 2.10 ± 0.11 b 2.30 ± 0.15 bc 2.50 ± 0.06 c
L* 60.52 ± 2.90 a 63.81 ± 2.32 a
Crust color 67.36 ± 1.90 b 69.59 ± 0.62 b 70.90 ± 1.91 b
a a b c
a* 3.49 ± 1.05 5.49 ± 0.75 6.63 ± 0.89 7.83 ± 0.20 1.81 ± 0.23 d
L* 59.60 ± 2.90aa 58.60 ± 1.64 aa 51.80 ± 2.30 ba 46.44 ± 3.13 c b 36.80 ± 2.50 d c
b* 11.40 ± 0.20 a 11.10 ± 0.64 a 12.15 ± 1.30 18.53 ± 1.50 23.40 ± 1.10
a* 8.40 ± 1.00 9.40 ± 0.51 a 10.10 ± 0.94 bb 11.80 ± 0.80 bc c 12.80 ± 0.30 c c
∆E 3.90 ± 0.95 7.60 ± 1.10 12.30 ± 1.20 16.00 ± 1.23
b* 29.10 ± 1.43 a 29.10 ± 1.20 a 29.30 ± 1.10 a 21.20 ± 2.53 b 21.10 ± 2.40 b
Different superscripts (a , b , c , d ) indicate significant statistical differences between CB and CcB: CcB5% up to CcB20%
(at p ΔE
≤ 0.05, Tukey test). 1.41 ± 0.90 a 8.00 ± 1.02 b 15.70 ± 1.80 c 24.60 ± 1.30 d
Crumb color
Moisture percentage of thea breads (p < 0.05)a increased by successively Cc additions, varyingb from
L* 60.52 ± 2.90 63.81 ± 2.32 67.36 ± 1.90 b 69.59 ± 0.62 b 70.90 ± 1.91
43.0% (CcB5%) to 51.0% (CcB20%), compared to 42.5% of CB, an increase of 21%c in moisture. Water is
a* 3.49 ± 1.05 a 5.49 ± 0.75 a 6.63 ± 0.89 b 7.83 ± 0.20 1.81 ± 0.23 d
the most b* important11.40 plasticizer
± 0.20 a
in food structure, acting
11.10 ± 0.64 a
as chain polymer
12.15 ± 1.30 a
lubricant,23.40
18.53 ± 1.50 b
reducing stiffer
± 1.10 c
linkage forces
ΔE by increasing flexibility of structure
3.90 ± 0.95 a effects [30]. Water
7.60 ± 1.10 b activity (aw)
12.30 ± 1.20 c was slightly reduced
16.00 ± 1.23 c
as the Different
Cc levelssuperscripts
increase in (a, bbread formulations,
, c, d) indicate significant from 0.960
statistical for CB between
differences to 0.890CBforand CcB20%
CcB: CcB5% (upper Cc
amount), up atodecrease
CcB20% (at ofp7.3%,
≤ 0.05,thatTukey willtest).
contribute to improving the preservation of bread during storage.
Additionally, a significant increase on yield for Cc bread was obtained, around 25% compared to
CB, as the consequence of less weight loss during baking (BL). Improvement in water holding capacity
has been
Appl. Sci. previously
2020, 10, x; doi:reported in GFB systems, by protein sources addition, enhancing the bread yield
www.mdpi.com/journal/applsci
after baking [27].Appl. Sci. 2020, 10, 6868 11 of 15
The enrichment of the bread formulation by Cc proteins addition enhanced the appearance of
the breads, in terms of specific bread volume (SBV), from 1.50 cm3 /g for CB to 2.60 cm3 /g for CcB20%,
a considerable increase about of 73%. These improvements in SBV could be justified by the increase in
water absorption, improving the handling properties and subsequently led to a flexible starch-protein
matrix further enhanced by starch gelatinization during baking [13].
The findings also agree with those reported by Sahagún and Gómez [27] evaluating the effect of
other protein sources on physicochemical and quality properties of GFB.
Other important features of the GFB are the crust and crumb color, also highly associated with
bread consumers acceptance. Crust and crumb color results (Table 5) reveal that the addition of Cc had
a considerable impact on both quality bread attributes. The inclusion of Cc substantially (p < 0.05)
increased the darker crust color of the GFBs (lower L* values). In fact, it could be related to the
increments in protein levels by Cc additions, since the Maillard reaction occurs between amino acids
and reducing sugars [31]. Based on bread crust tone, Cc addition promoted an increase of redness
(higher a* values) reducing slightly the yellowness of the crust (lower b*). The differences in color
(∆E) between Cc breads and CB, were calculated by Equation (3), resulting in ∆E values higher than
5, indicating significant bread color differences by the increments in Cc. In agreement, are previous
reports about GFB with egg white and whey proteins addition [1]. In contrast, on crumb color, lighter
breads (L* values) with a remarkable yellowness tone (b* values) whilst the reddish tone decreased
(a* values), was obtained. Differences in color were also confirmed by the values ∆E higher than
5. Similar results were previous reported Graça et al. [16] by adding yoghurt to improve the GFB
quality properties.
3.4. The Relationship between Bread Quality and Dough Rheology Features
This study showed that the bread volume and crumb texture can be improved by denatured WP
coming from Cc incorporation to dough, acting as lubricant agents in dough matrix. In fact, results
discussed above suggest some linear correlation between bread quality attributes and dough rheology
results, that can be taken into consideration to support the enhancements of the GFB.
Linear relationships (R2 > 0.900) were found between bread firmness (BF) with dough viscosity
(DV) and elastic modulus (G’, at 1 Hz), and bread volume (SBV) with both DV and G’, at 1 Hz, as can
be observed from Figure 5A,B.
Improvements of BF and SBV were obtained for Cc doughs with lower viscosity and elasticity
values, resulting in softer breads with better volumes.
It can be stated that the Cc incorporation to dough had a significant impact on GFB quality
attributes, and such effects are probably due to additional support of the denatured WP to flexible
effects on macromolecule interactions, improving the dough matrix performance to produce higher
quality breads than CB.
These finding are aligned with those published by Graça et al. [16], reporting positive effects of
the casein protein, present in yoghurt, on GFB quality properties.Appl. Sci. 2020, 10, 6868 12 of 15
Appl. Sci. 2020, 10, x 12 of 15
A1 A2
B1 B2
Figure
Figure 5. 5.Linear
Linearrelationship
relationshipbetween
between bread
bread quality
qualityattributes
attributes(BF—bread
(BF—bread firmness and
firmness SBV—specific
and SBV—specific
bread volume) with dough rheology properties (DV—dough viscosity and G’—elastic
bread volume) with dough rheology properties (DV—dough viscosity and G’—elastic modulus, modulus, at 1 at
Hz): (A11)—BF
1 Hz): )—BFvs.vs.DV;
DV;(A 2)—BF
(A 2 )—BF vs.vs.
G’;G’;
(B1(B
)—SBV vs. vs.
1 )—SBV DV;DV;
(B2)—SBV vs. G’.
(B2 )—SBV vs. G’.
3.5. Nutritional Value ofofthe
The increments Gluten-Free
protein Bread
by Cc incorporation to GFB was noticeable: comparing CB to CcB20%
(higher level tested), the protein content varied from 5.34 to 9.40 g/100 g, respectively, representing
The impact of Cc addition to improve the nutritional and minerals profile of GFB was evaluated,
an increase around 80%. Carbohydrates levels varied from 45.9 to 31.5 g/100 g, representing a
and the results obtained are summarized in Table 6.
considerable reduction of 31.4% for CcB20%, compared to CB. According to a recent work [32], in
The increments of protein by Cc incorporation to GFB was noticeable: comparing CB to CcB20%
which the supplementation of wheat bread with curd cheese to reduce the glycemic response was
(higher level tested), the protein content varied from 5.34 to 9.40 g/100 g, respectively, representing an
performed, these results can suggest that the incorporation of Cc as baking ingredients in GFB
increase around 80%. Carbohydrates levels varied from 45.9 to 31.5 g/100 g, representing a considerable
formulations can be an alternative to obtain breads with reduced glycemic index.
reduction of 31.4%
In terms for CcB20%,
of lipids content, compared
a significanttoincrease
CB. According to aupper
of 35% for recentlevels
workof[32], in which
Cc tested, wasthe
supplementation
obtained. of wheat bread with curd cheese to reduce the glycemic response was performed,
these results can suggest
A considerable that the
increase in incorporation
ash content was of also
Cc asobserved,
baking ingredients
and this resultin GFB formulations
is clearly reflectedcan
in be
anterms
alternative to obtain breads with reduced glycemic index.
of major minerals profile. As it can be observed from Table 6, a significant increase in
In terms of
phosphorus lipids content,
(50.0%), magnesium a significant
(6.0%), andincrease
calcium of(360.3%)
35% for were
upperregistered
levels of Cc
for tested, wasthat
Cc bread, obtained.
can
A considerable
cover more than 15% increase in ash content
of recommended daily was
valuealso observed,
as stated and this
in European result is clearly
community reflected in
(CE) Regulation
terms of major minerals
N° 1924/2006 based onprofile.
nutritionAsand
it can be observed
health from on
claims made Table 6, a [33],
foods significant
and inincrease in phosphorus
the Regulation (UE)
N° 432/2012 that specifies a list of permitted health claims made on foods [34].
(50.0%), magnesium (6.0%), and calcium (360.3%) were registered for Cc bread, that can cover more
than 15% of recommended daily value as stated in European community (CE) Regulation N◦ 1924/2006
based on nutrition and health claims made on foods [33], and in the Regulation (UE) N◦ 432/2012 that
specifies a list of permitted health claims made on foods [34].
In terms of trace elements (Fe, Cu, Mn, and Zn), since their prevalence in buckwheat flour is
higher than in curd cheese, their proportions were diluted by successive curd cheese additions.
Appl. Sci. 2020, 10, x; doi: www.mdpi.com/journal/applsciAppl. Sci. 2020, 10, 6868 13 of 15
A balanced gluten-free diet should provide adequate levels of macro- and micronutrients, since the
diagnosis of celiac patients is often associated to deficiencies in protein levels and mineral components,
caused by the atrophy and subsequent damage of small gut villus [35–37].
These nutritional improvements obtained by the addition of Cc on GFB formulation can give an
additional contribution to fulfill the nutritional daily diet requirements in terms of protein and major
mineral profile of celiac patients and also gluten-sensitive individuals.
Table 6. Nutritional value (g/100 g), including mineral profile (mg/100 g), for control bread (CB) and Cc
breads (CcB5% up to CcB20%).
Nutrients (g/100 g) CB CcB10% CcB20%
Proteins 5.34 ± 0.21 a b 9.40 ± 0.10 c
7.60 ± 0.12
Lipids 4.30 ± 0.29 a 5.30 ± 0.61 b 5.80 ± 0.20 c
Ash 1.40 ± 0.03 a 2.03 ± 0.11 b 2.90 ± 0.07 c
Carbohydrates 45.90 ± 0.95 a 39.60 ± 1.50 b 31.50 ± 1.20 c
Kcal 245.80 ± 1.80 a 236.20 ± 1.10 a 213.40 ± 2.10 b
Minerals (mg/100 g) 15% RDV * (mg/100 g)
Na (g/100 g) 0.41 ± 0.03 a 0.35 ± 0.01 a b -
0.36 ± 0.02
K 412.0 ± 8.02 a 315.35 ± 5.92 b 290.35 ± 10.40 b 300.0
P 131.80 ± 5.40 a 177.00 ± 0.90 a 197.40 ± 2.00 b 120.0
Mg 50.24 ± 1.02 a 50.60 ± 0.56 a 53.20 ± 0.82 b 45.0
Ca 35.93 ± 2.06 a 151.00 ± 0.81 b 165.38 ± 2.60 c 120.0
Fe 6.94 ± 0.12 a 3.68 ± 0.67 b 3.50 ± 0.05 c 2.1
Cu 0.23 ± 0.01 a 0.10 ± 0.02 b 0.07 ± 0.03 c 0.2
Mn 0.51 ± 0.01 a 0.40 ± 0.02 a 0.32 ± 0.03 b 0.3
Zn 1.12 ± 0.01 a 0.70 ± 0.08 b 0.65 ± 0.01 b 2.3
Different superscripts (a , b , c ) indicate significant statistical differences between CB and CcB: CcB5% up to CcB20%,
(at p ≤ 0.05, Tukey test). * Recommended daily values (RDV) established by Reg. (CE), No. 1924/2006 and Reg. (EU)
No. 432/2012.
4. Conclusions
The findings from this work showed that the quality of the GFB can be substantially improved by
Cc supplementation, and such effects are probably associated to the functionality of denatured WP
and lipids from the Cc, enhancing the viscoelastic properties of the GFD, giving additional support to
dough foaming structure.
The weakening effects observed on dough rheology features, promoted by Cc lipids incorporation
led to a significant improvement in bread softness with higher specific volumes than CB. Linear
correlation between dough viscosity and storage modulus, with bread firmness and specific volume,
supported these findings, showing that the positive effects observed are proportional to the increased
levels of the curd cheese into the gluten-free dough.
Nutritionally, a considerable protein enrichment as well as major minerals profile, especially
calcium, phosphorus, and magnesium contents, were obtained, whereas the carbohydrates amount
was significantly reduced.
Considerable improvements in terms of bread quality of the gluten-free bread were achieved by
successive increments of curd cheese, especially on the higher levels tested (15% and 20% w/w).
In summary, it can be stated that the breadmaking performance, technology properties, quality
attributes, as well as the nutritive value of the gluten-free bread, can be substantially improved by
fresh Cc enrichment.
Author Contributions: Conceptualization, Methodology, Investigation, Data Curation, Writing—Original Draft
Preparation, C.G.; Project Administration, Investigation, Supervision, Validation, Writing—Review and Editing,
A.R. and I.S. All authors have read and agree to the published version of the manuscript.Appl. Sci. 2020, 10, 6868 14 of 15
Funding: The research and publication—Portuguese Foundation for Science and Technology (FCT) through the
research unit UID/AGR/04129/2020 (LEAF).
Acknowledgments: The first author is grateful for the PhD granted by the University of Lisbon [Doctoral Grant
reference to C10781w].
Conflicts of Interest: The authors declare no conflict of interest.
References
1. Pico, J.; Reguilon, M.P.; Bernal, L.; Gomez, M. Effect of rice, pea, egg white and whey proteins on crust quality
of rice flour corn starch-based gluten-free breads. J. Cereal Sci. 2019, 86, 92–101. [CrossRef]
2. Shin, M.; Gang, D.O.; Song, J.Y. Effects of protein and transglutaminase on the preparation of gluten-free
bread. Food Sci. Biotechnol. 2010, 19, 951–956. [CrossRef]
3. Kittisuban, P.; Ritthiruangdej, P.; Suphantharika, M. Optimization of hydroxyl propyl methylcellulose, yeast,
b-glucan, and whey protein levels based on physical properties of gluten-free rice bread using response
surface methodology. LWT-Food Sci. Technol. 2014, 57, 738–748. [CrossRef]
4. Segura, M.E.M.; Rosell, C.M. Chemical composition and starch digestibility of different gluten-free breads.
Plant Foods Hum. Nutr. 2011, 66, 224–230. [CrossRef] [PubMed]
5. Martins, R.B.; Nunes, M.C.; Ferreira, M.M.L.; Peres, J.A.; Barros, A.I.R.N.A.; Raymundo, A. Impact of a corn
flour on gluten-free dough rheology properties. Foods 2020, 9, 560. [CrossRef] [PubMed]
6. Buresova, I.; Tokar, M.; Marecek, J.; Hivna, L.; Famera, O.; Sottníkova, V. The comparison of the effect of
added amaranth, buckwheat, chickpea, corn, millet and quinoa flour on rice dough rheological characteristics,
textural and sensory quality of bread. J. Cereal Sci. 2017, 75, 158–164. [CrossRef]
7. Hager, A.-S.; Arendt, E. Influence of hydroxy-propyl-methylcellulose (HPMC), xanthan gum and their
combination on loaf specific volume, crumb hardness and crumb grain characteristics of gluten-free breads
based on rice, maize, teff and buckwheat. Food Hydrocol. 2013, 32, 195–203. [CrossRef]
8. Masure, H.G.; Fierens, E.; Delcour, J.A. Current and forward-looking experimental approaches in gluten-free
bread making research. J. Cereal Sci. 2016, 67, 92–111. [CrossRef]
9. Schoenlechner, R.; Mandala, I.; Kiskini, A.; Kostaropoulos, A.; Berghofer, E. Effect of water, albumen, and fat
on the quality of gluten-free bread containing amaranth. Int. J. Food Sci. Technol. 2010, 45, 661–669. [CrossRef]
10. Purlis, E.; Salvadori, V.O. Modelling the browning of bread during baking. Food Res. Int. 2009, 42, 865–870.
[CrossRef]
11. Kumar, C.T.M.; Sabikhi, L.; Singh, A.K.; Raju, P.N.; Kumar, R.; Sharma, R. Effect of incorporation of
sodium caseinate, whey protein concentrates and transglutaminase on the properties of depigmented pearl
millet-based gluten free pasta. LWT-Food Sci. Technol. 2019, 103, 19–26. [CrossRef]
12. Graça, C.; Raymundo, A.; Sousa, I. Wheat Bread with Dairy Products -Technology, Nutritional, and Sensory
Properties. Appl. Sci. 2019, 9, 4101. [CrossRef]
13. Gallagher, E.; Kundel, A.; Gormley, T.R.; Arendt, E.K. The effect of dairy and rice powder addition on loaf
and crumb characteristics, and on shelf life (intermediate and long-term) of gluten-free breads in a modified
atmosphere. Eur. Food Res. Technol. 2003, 218, 44–48. [CrossRef]
14. Taylor, J.R.N.; Taylor, J.; Campanella, O.H.; Hamaker, B.R. Functionality of the storage proteins in gluten-free
cereals and pseudocereals in dough systems. J. Cereal Sci. 2016, 67, 22–34. [CrossRef]
15. Morens, C.; Bos, C.; Pueyo, M.E.; Benamouzig, R.; Gausseres, N.; Luengo, C. Increasing habitual protein
intake accentuates difference in postprandial dietary nitrogen utilization between protein sources in humans.
J. Nutr. 2003, 133, 2733–2740. [CrossRef] [PubMed]
16. Graça, C.; Raymundo, A.; Sousa, I. Yogurt as an Alternative Ingredient to Improve the Functional and
Nutritional Properties of Gluten-Free Breads. Foods 2020, 9, 111. [CrossRef]
17. Franco, J.M.; Raymundo, A.; Sousa, I.; Gallegos, C. Influence of processing variables on the rheological and
textural properties of lupin protein-stabilized emulsions. J. Agric. Food Chem. 1998, 46, 3109–3115. [CrossRef]
18. Graça, C.; Fradinho, P.; Sousa, I.; Raymundo, A. Impact of Chlorella vulgaris on the rheology of wheat flour
dough and bread texture. LWT-Food Sci. Technol. 2019, 89, 466–474. [CrossRef]
19. Liu, R.; Sun, W.; Zhang, Y.; Huang, Z.; Hu, H.; Zhao, M.; Li, W. Development of a novel model dough based
on mechanically activated cassava starch and gluten protein: Application in bread. Food Chem. 2019, 300,
125196. [CrossRef]Appl. Sci. 2020, 10, 6868 15 of 15
20. Demirkesen, I.; Mert, B.; Sumnu, G.; Sahin, S. Rheological properties of gluten-free bread formulations.
J. Food Eng. 2010, 96, 295–303. [CrossRef]
21. Gerrard, J.A. Protein–protein crosslinking in food: Methods, consequences, applications. Trends Food Sci.
Technol. 2002, 13, 391–399. [CrossRef]
22. Marchetti, L.; Andrés, S.; Cerruti, P.; Califano, A. Effect of bacterial nanocellulose addition on the rheological
properties of gluten-free muffin batters. Food Hydrocoll. 2020, 98, 105315. [CrossRef]
23. Ronda, F.; Oliete, B.; Gómez, M.; Caballero, P.A.; Pando, V. Rheological study of layer cake batters made with
soybean protein isolate and different starch sources. J. Food Eng. 2011, 102, 272–277. [CrossRef]
24. Hundschell, C.S.; Wagemans, A.M. Rheology of common uncharged exopolysaccharides for food applications.
Cur. Opin. Food Sci. 2019, 27, 1–7. [CrossRef]
25. Picout, D.; Ross-Murphy, S.B. Rheology of Biopolymer Solutions and Gels. Sci. World J. 2003, 3, 105–121.
[CrossRef]
26. Razmkhah, S.; Razavi, S.; Mohammadifar, M. Dilute solution, flow behavior, thixotropy and viscoelastic
characterization of cress seed (Lepidium sativum) gum fractions. Food Hydrocoll. 2017, 63, 404–413. [CrossRef]
27. Sahagún, M.; Gómez, M. Influence of protein source on characteristics and quality of gluten-free cookies.
J. Food Sci. Technol. 2018, 55, 4131–4138. [CrossRef]
28. Lazaridou, A.; Duta, D.; Papageorgiou, M.; Belc, N.; Biliaderis, C.G. Effects of hydrocolloids on dough
rheology and bread quality parameters in gluten-free formulations. J. Food Eng. 2007, 79, 1033–1047.
[CrossRef]
29. Matos, M.E.; Sanz, T.; Rosell, C.M. Establishing the function of proteins on the rheological and quality
properties of rice-based gluten free muffins. Food Hydrocol. 2014, 35, 150–158. [CrossRef]
30. Blasia, P.; D’ Souza, S.S.; Selmin, F.; DeLuca, P.P. Plasticizing effect of water on poly (lactide-co-glycolide).
J. Control. Release 2005, 108, 1–9. [CrossRef]
31. Aguilar, N.; Albanell, E.; Minarro, B.; Capellas, M. Chickpea and tiger nut flours as alternatives to emulsifier
and shortening in gluten-free bread. LWT-Food Sci. Technol. 2015, 62, 225–232. [CrossRef]
32. Graça, C.; Raymundo, A.; Sousa, I. Yoghurt and curd cheese addition to wheat bread dough: Impact on
in vitro starch digestibility and estimated glycemic index. Food Chem. 2021, 339, 127887. [CrossRef] [PubMed]
33. Regulation (EC) Nº 1924/2006 of the European Parliament and of the Council of 20 December 2006 on
Nutrition and Health Claims Made on Foods. Available online: http://data.europa.eu/eli/reg/2006/1924/oj
(accessed on 1 August 2020).
34. Commission Regulation (EU) No 432/2012 of 16 May 2012 Establishing a List of Permitted Health Claims
Made on Foods, Other than Those Referring to the Reduction of Disease Risk and to Children’s Development
and Health. Available online: http://data.europa.eu/eli/reg/2012/432/oj (accessed on 1 August 2020).
35. Wild, D.; Robins, G.G.; Burley, V.J.; Howdle, P.D. Evidence of high sugar intake, and low fibre and mineral
intake, in the gluten-free diet. Aliment. Pharmacol. Ther. 2010, 32, 573–581. [CrossRef] [PubMed]
36. Gambuś, H.; Gambuś, F.; Wrona, P.; Pastuszka, D.; Ziobro, R.; Nowotna, A.; Kopeć, A.; Sikora, M. Enrichment
of gluten-free rolls with amaranth and flaxseed increases the concentration of calcium and phosphorus in the
bones of rats. Pol. J. Food Nutr. Sci. 2009, 59, 349–355.
37. Litwinek, D.; Ziobro, R.; Gambuś, H.; Sikora, M. Gluten Free Bread in a Diet of Celiacs. Int. J. Celiac Dis.
2014, 2, 11–16. [CrossRef]
© 2020 by the authors. Licensee MDPI, Basel, Switzerland. This article is an open access
article distributed under the terms and conditions of the Creative Commons Attribution
(CC BY) license (http://creativecommons.org/licenses/by/4.0/).You can also read