Temporal and Spatial Variability in Surface Air Temperature and Diurnal Temperature Range in Spain over the Period 1950-2011 - MDPI
←
→
Page content transcription
If your browser does not render page correctly, please read the page content below
climate
Article
Temporal and Spatial Variability in Surface Air
Temperature and Diurnal Temperature Range in
Spain over the Period 1950–2011
Julia Bilbao *, Roberto Román                 and Argimiro De Miguel
 Atmosphere and Energy Laboratory, Science Faculty, University of Valladolid, Campus Miguel Delibes 7,
 47011-Valladolid, Spain; robertor@goa.uva.es (R.R.); argimiro@fa1.uva.es (A.D.M.)
 * Correspondence: juliab@fa1.uva.es

 Received: 20 November 2018; Accepted: 15 January 2019; Published: 19 January 2019

 Abstract: Maximum (Tmax ), minimum (Tmin ), mean (Tmean ) air temperature and diurnal temperature
 range (DTR) trends on a seasonal and annual time scale are evaluated from data recorded at
 nine Spanish weather stations during the period 1950–2011. Temporal and spatial variability in
 temperatures and in the diurnal temperature range (DTR) are presented. The non-parametric
 Theil-Sen approach and the Mann-Kendall test are used to evaluate anomaly temperature trends and
 their statistical significance, respectively. An air temperature reduction in Spain between 1950 and
 1980 emerges and significant warming is observed between 1980 and 2011. On a seasonal scale, the
 weakest trends (mostly insignificant at the 5% confidence level) are noted during autumn, while the
 strongest warming rates were found during summer and spring. The rate of change between 1950
 and 2011 in Tmax , Tmin and Tmean was 1.6 ◦ C, 1.1 ◦ C and 1.3 ◦ C, respectively. DTR trends showed
 a decrease on the Mediterranean coast and a small change in northern, Atlantic and rural areas.
 The spatial distribution of annual and seasonal trends was plotted as isoline maps and strong trend
 gradients from the south to the north of the country are observed. DTR values were negatively
 correlated with relative humidity and precipitation and positively correlated with sunshine hours.

 Keywords: surface air temperature series; DTR; anomalies; trend analysis; statistical significance;
 isoline trend maps; Spain; climate change

1. Introduction
     Various studies have confirmed global warming on regional, continental and global scales, [1].
According to the Fifth Assessment Report (AR5) of the Intergovernmental Panel for Climate Change
(IPCC), global mean surface temperature (GMST) has increased since the late 19th century, [1]. Each of
the past three decades has been increasingly warmer at the Earth’s surface than any previous decade,
with the 2000s having been the warmest.
     For instance, average combined overland and ocean temperature data were calculated by a linear
trend and showed a warming of 0.85 (0.65 to 1.06) ◦ C over the period 1880–2012 [1]. When multiple
independently produced datasets exist, the warming trend was 0.89 (0.69 to 1.08) ◦ C over the period
1901–2012 [1]. In addition, the trend and warming were 0.72 (0.49 to 0.89) ◦ C over the period 1951–2012
when based on three independently produced datasets. Evaluating temperature trends on a global
scale is essential although studying temperature variability on local and regional scales proves to be
more inclusive, since changes on temperature are not uniform and vary over space and time.
     Temperature and diurnal temperature range (DTR) are fundamental components of the climate
system and changes in their pattern can affect human health, ecosystems, plants, animals and renewable
energy systems [2]. As a result, research into temperature and DTR variability on regional and local
scales is vital.

Climate 2019, 7, 16; doi:10.3390/cli7010016                                   www.mdpi.com/journal/climate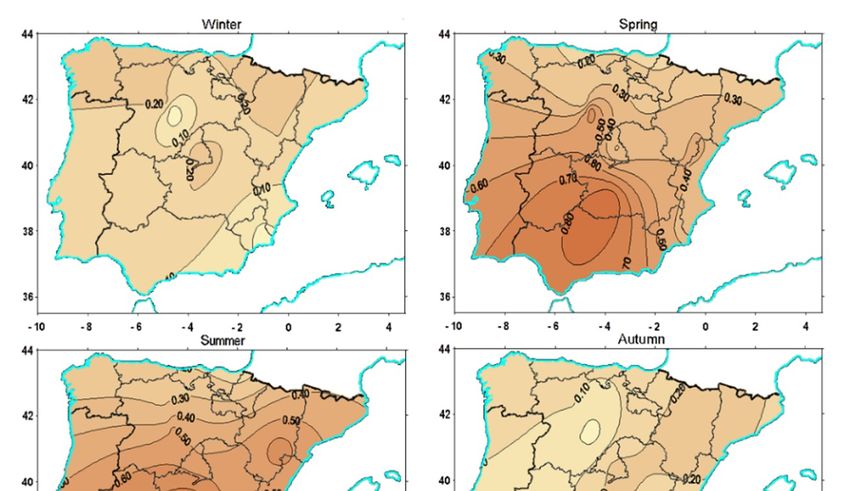
Climate 2019, 7, 16                                                                                   2 of 17

      Although air temperature change occurs on a global scale, its impact varies from region to region
and, as a consequence, studying air temperature trends is a key task in climate change research,
as suggested by Giorgi and Lionello [3].
      Despite the importance of air temperature trends, scant definitive spatial information has thus
far been published at a local scale in the continental Mediterranean area. Due to its long observation
records, Spain is well placed to monitor climate change in this area. In addition, such information
is of interest vis-à-vis gaining a better understanding of climate system change and global warming
in a country which is not densely populated country but which possesses agricultural, livestock,
industrial, tourist and renewable energy resources that may be affected by temperature changes [4].
      Numerous studies have researched temperature trends in recent years, although temperature
trends have in fact been analysed in Spain by different authors [5–11] since the mid-19th century. For
instance, annual Tmin is seen to have changed between 0.13 and 0.25 ◦ C decade−1 in the northern
Spanish Plateau for the period 1869–1992, as reported by Esteban-Parra et al. [7]. In the Balearic
Islands (Spain), Tmin increased at a rate of 0.58 ◦ C decade−1 and Tmax also increased at a rate of
0.5 ◦ C decade−1 for the period 1976–2006, as reported by Homar et al. [8]. Temperature has shown
a significant growth trend of 0.09 ± 0.04 ◦ C decade−1 since 1944 and night-time temperatures have
risen by 0.17 ± 0.04 ◦ C decade−1 while days have remained more stable, on the island of Tenerife
Island, (Spain), Martin et al. [9]. More recently, Del Rio et al. [10] analysed Tmean in Spain from 1961
to 2006, obtaining positive significant trends in spring and summer. The annual trend was between
0.1 and 0.2 ◦ C decade−1 . Del Rio et al. [11] studied and analysed the Tmean, Tmax and Tmin for the
same period in Spain, with the results showing a rate of increase around 0.3 ◦ C decade−1 in summer
and spring seasons. Tmax increased 0.37 ◦ C decade−1 and 0.43 ◦ C decade−1 in summer and spring,
respectively; for Tmin , warming was 0.34◦ C decade−1 in summer and 0.41◦ C decade−1 in spring.
      Different authors point out that special attention should be paid to rural station temperature data
since preliminary results suggest that the effect of rural heat on the increase in Tmin and Tmax is less than
the temporal variations found in city stations [7]. Some authors have attributed the causes of trends
and other variations to the Iberian Oscillation Index (IOI) and the Iberian sea surface temperature
(ISST) has been suggested to account for the different seasonal temperature behaviour, as can be seen
in Rodriguez-Puebla et al. [12].
      Kadioglu [13] obtained Tmean„ Tmax and Tmin air temperature increases at a rate of 0.063, 0.003
and 0.124 ◦ C decade−1 , respectively, over Turkey for the period 1939–1989. He also observed that
the rate of change in the Tmean was 0.019 ◦ C decade−1 between 1951 and 2010. Galdies [14] recently
reported a warming trend of 0.22 and 0.18 ◦ C decade−1 in the Tmax and Tmin , respectively for the
Maltese Islands.
      In addition, authors such as Del Rio et al. [11], Sayemuzzaman et al. [15], Ventura et al. [16],
have analysed the difference between maximum and minimum temperatures (diurnal temperature
range, DTR). Some authors have reported an increase in Tmin, since 1950 when compared to Tmax .
This represents a downward trend in DTR. Nevertheless, most studies into Spanish temperature
changes show that the maximum temperature has increased at a greater rate than the minimum
temperature. As a result, this produces an upward trend in DTR, as explained by El Kenawy et
al. [17], Del Rio [11]. Sayemuzzaman et al. [4,15] observed that maximum temperature decreased and
minimum temperature increased in North Carolina during the period 1950–2009 and also reported
that DTR decreases, concluding that the change can be associated with the positive North Atlantic
Oscillation (NAO) index during 1970–2000.
      In order to further current knowledge of DTR, the current work proposes studying the trends
of the maximum, minimum and average temperatures as well as DTR behaviour at urban and rural
measuring stations, distributed throughout Spain. The main objective is to evaluate local trends
and to draw seasonal and annual trend maps, where isolines have been traced with intervals of
0.1 ◦ C decade−1 .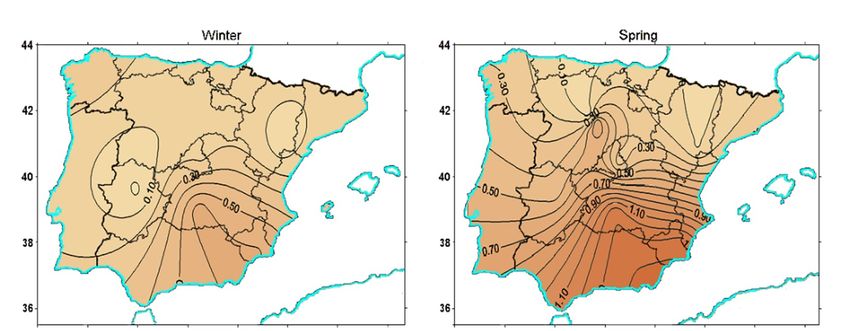
Climate 2019, 7, 16                                                                                            3 of 17

     To achieve this, long-term measured daily temperature data over a period of 62 years, from 1950
to 2011 at different weather stations were analysed. A further goal was to quantify their anomalies,
trends and diurnal temperature range at nine Spanish stations and in a temperature series that is
representative of the average of the nine locations. This average series is representative of the country
mean temperature and has been called the “Iberian Peninsula” (IP) series. Correlation analysis between
DTR and meteorological variables (precipitation, relative humidity, sunshine hours) was carried out.
A comparison of DTR trends at rural and urban stations has been performed. The present study helps
to improve current knowledge of the temporal and spatial variability of surface air temperature trends
and DTR on seasonal and annual time scales in Spain.
     In relation to previous studies, the present work introduces the following novelties: first, this work
highlights the difference between rural and urban stations from the point of view of DTR variability at
each station and minimum temperatures in summer. Second, the selected measurement stations allow
observations and comparisons to be made of the anomaly trends of global solar radiation, surface air
temperatures and sunshine hours (not shown in this manuscript) [18]. Third, it has been observed that
increases in Tmax and Tmin may be associated with surface solar radiation transition from dimming to
brightening since the 1980s [18].
     In the following sections, a description of the locations, different data control tests and the
methodology are explained in Section 2. The results and discussion are in Section 3. Finally, a summary
together with the most relevant conclusions are provided in Section 4.

2. Material and Methods

2.1. Place
     The study area is the part of Spain, located on the Iberian Peninsula, in southwest Europe at
36◦ –44◦ N and between 10◦ W and 3◦ E. and covers an area of 505,990 km2 . Its mainland is bordered to
the south and east by the Mediterranean and to the west and northwest by Portugal and the Atlantic
Ocean. The major mountain systems from west to east and starting from the north are: the Cantabrian
Mountains (across northern Spain), the Pyrenees (natural frontier with France) and the Central System.
The Iberian System (which extends from the eastern foothills of the Cantabrian Mountains to the Betic
System) and the previously mentioned Betic system (running along the southern and eastern parts of
Spain) [10]. The climate is temperate with hot summers and cold winters inland and sunny summers
and cloudy winters along the coast. The measurement stations are distributed between the Atlantic
Ocean and the Mediterranean Basin, under the influence of the Azores High pressure and the Iceland
Low. Table 1 shows the geographical characteristics of the measuring stations used in this study. The
                        Valladolid                   41.65       4.77 W        735      Urban
spatial distribution of the selected locations is also marked in Figure 1. Eleven meteorological stations
                  Villalba de los Alcores            41.81       4.93 W        848       Rural
are run by the Spanish Meteorological Agency (AEMet), [www.aemet.es] and one station, located in
                •Santiago de Compostela              42.89       8.41 W        346       Rural
the rural village of•Zaragoza
                     “Villalba(airport)
                                de los Alcores,” is41.66
                                                      run by the 1.01
                                                                 Atmosphere
                                                                      W       and
                                                                               370 EnergyRural
                                                                                          Laboratory of the
University of Valladolid
                   •Granada(De(air
                                Miguel
                                   base) et al. [19];37.14
                                                      Román, [20])  and
                                                                 3.63 W used AEMet
                                                                               690 Villanubla
                                                                                         Rural station data.

                                                                                         (•) rural stations.
             Figure 1. Spatial distribution of the selected measuring stations in Spain. (•)

2.2. Instrumentation
    All of these stations are equipped with instruments to take hourly global, G and ultraviolet solar
measurements and with meteorological variable sensors. All instruments were well calibrated on a
regular basis and instrument maintenance was performed following World Meteorological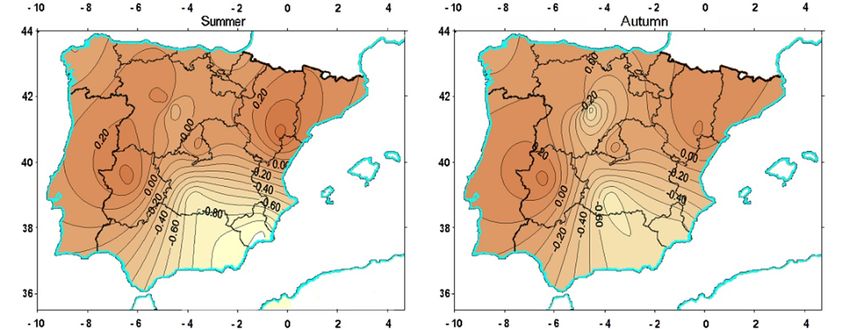
Climate 2019, 7, 16                                                                                           4 of 17

      Table 1. Geographical characteristics of the stations for the present study. The first nine stations were
      used to calculate the Iberian Peninsula (IP) time series. (•) mean rural stations.

                                              Latitude (◦ N)     Longitude (◦ )     Altitude (m)      Type
                   Ciudad Real                    38.99              3.92 W              628         Urban
             San Sebastián (Igueldo)              43.31              2.04 W              251         Rural
                     A Coruña                     43.37              8.42 W               58         Rural
          Madrid (Ciudad Universitaria)           40.45              3.72 W              664         Urban
                      Cáceres                     39.47              6.34 W              394         Urban
                      Murcia                      38.00              1.17 W              61          Urban
                      Tortosa                     40.82              0.49 E               44         Urban
                     Valladolid                   41.65              4.77 W              735         Urban
              Villalba de los Alcores             41.81              4.93 W              848         Rural
            •Santiago de Compostela               42.89              8.41 W              346         Rural
               •Zaragoza (airport)                41.66              1.01 W              370         Rural
               •Granada (air base)                37.14              3.63 W              690         Rural

2.2. Instrumentation
     All of these stations are equipped with instruments to take hourly global, G and ultraviolet
solar measurements and with meteorological variable sensors. All instruments were well calibrated
on a regular basis and instrument maintenance was performed following World Meteorological
Organization (WMO) recommendations (WMO, 2008 [21]): cleaning domes, bubble levelling of the
instruments and monitoring of desiccant state, as is explained in Román et al. [22].

2.3. Data
      In the present study, series of daily Tmax , Tmin and Tmean from nine Spanish weather stations for
the period 1950–2011, obtained from AEMet (Meteorology Spanish Agency), were initially analysed.
Weather station selection was made according to their quality, length and period covered and ensuring
they possess simultaneous records of meteorological variables, solar radiation and sunshine hours so as
to be able to compare their trends. Daily values were averaged in order to obtain monthly temperatures
and seasonal temperatures for each of the stations. Seasons were defined as follows: winter (December,
January and February), spring (March, April and May), summer (June, July and August) and autumn
(September, October and November). Mean annual temperatures were obtained by averaging the
monthly values for each year. Further information regarding the measurement uncertainty is given in
Román et al. [22].
      Some necessary data quality control tests were performed before data were used. Al the variables
were checked against empirical upper and lower limits, systematic errors, which resulted from different
sources (e.g., archiving, transcription and digitalization). This can include non-existent dates, Tmin ≥
Tmax , Tmax > 50 ◦ C, Tmin < −50 ◦ C. Further details about these tests can be seen in (El Kenawy et al. [17];
Bilbao et al. [23]; Miguel et al. [24]; Román et al. [25]). Checks were also applied in order to (1) detect,
correct, and/or remove major errors, such as aberrant (more sunshine hours recorded than the possible
maximum) or negative values; (2) confirm the consistency of calendar dates (days per month and
year); and (3) remove false zeros; (4). Daily evolution of temperatures and global solar radiation is
represented graphically. This has enabled us to detect, locate and correct data errors in relation to
mistakes caused by, for example, systematic shadows on consecutive days, lags, repeated data and
so forth. Finally, certain conditions about controlling missing data were taken into account following
(Sánchez-Lorenzo et al. [26]). The available daily temperature data for carrying out the work show
that four stations have over 30,000 daily data; for instance, Tortosa, Madrid and San Sebastián have the
oldest data; data series start in 1920 in the case of the Madrid and Tortosa stations. The number of
missing data is less than 1%. In addition, the absolutely highest maximum temperature was recorded
at Murcia and the lowest minimum at Villalba de los Alcores.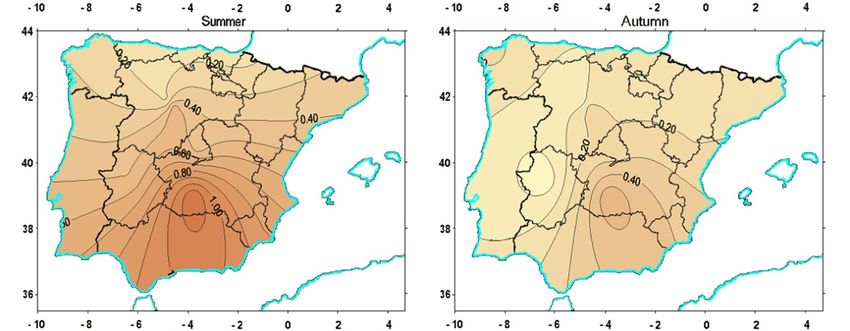
Climate 2019, 7, 16                                                                                  5 of 17

      Instrumentation and alteration of surrounding land cover might create non-homogeneity and/or
inconsistencies in meteorological data recordings (Gocic and Trajkovic, [27]). In our study, homogeneity
tests were carried out on monthly, seasonal and annual time scales. Further details about this method
are shown in Section 2.4.

2.4. Method: Temperature Anomalies and Data Homogeneity Testing
     In order to deseasonalize the temporal temperature series and to obtain averaged series, monthly
anomalies were evaluated. Anomalies provide an accurate description of climate variability and allow
for data comparisons from different climatological areas, as suggested by Galdies [14]. Anomalies of
various meteorological variables are known to be more representative than absolute values, which is
why temperature anomaly evolution was plotted as a function of time.
     Using the daily values of each daily temperature variable, the monthly average of daily series
was calculated using at least 25 daily data per month, year and location (Román et al. [22]). Temporal
monthly anomaly series are assessed considering the reference period climate norm of 1961–1990. The
anomaly (A) in month “m” and year “y” is calculated as:

                                                           1990
                                                      1
                                      Am,y = Tm,y −
                                                      N     ∑        Tm,y0                              (1)
                                                          y0 =1961

where N is the number of data used in the sum of Equation (1). Monthly T temperature anomalies were
evaluated for all months and all locations. The monthly anomalies of each variable at nine locations
were averaged and a new monthly series of anomalies, representative of the Iberian Peninsula, (IP),
was created and called the “Iberian Peninsula” series. Annual anomalies were calculated by averaging
the monthly anomalies when all twelve monthly data are available for each year (Román et al. [28]).
Winter anomalies were calculated with the January and February anomalies for a specific year, together
with the December anomaly of the previous year.
      Homogeneity of the Tmean, Tmax and Tmin anomaly series was tested, as described by (Román
et al. [22,28]). Four tests are mainly applied in order to ascertain whether the series are valid for trend
studies or whether, by contrast, they are not valid due to changes on instrumentation or measurement
problems. The null hypothesis assumes that a temporal series is homogenous. This hypothesis was
verified using the following four tests: the Standard Normal Homogeneity Test (SNHT), the Pettit test,
the Buishand test and the Von Neumann ratio, (Wijngaard et al. [29]).
      Hakuba et al. [30] considered that if the null hypothesis is rejected with a confidence of 99% by
at least three tests, then the series could be assumed inhomogeneous. The four tests were applied
to the Tmean, Tmax and Tmin series and the annual series observed a non-homogeneity around 1970,
which might be due to a change in temperature trend. Wild [31] reported a climate change in the
mid-80s in the Northern Hemisphere due to the end of “global dimming” and the start of “global
brightening.” Global dimming was a period when aerosol presence in the atmosphere increased
and global brightening corresponds to aerosol reduction in the atmosphere. No inhomogeneities
were detected for any test in the annual T series for the periods 1950–1984 (dimming) and 1985–2011
(brightening), supporting the hypothesis of a mid-1980s climate change. Homogeneity analysis was
thus performed for the same series for the periods 1950–1984 and 1985–2011. The first period evidenced
inhomogeneities in wind speed and relative humidity.
      The homogeneity of the Tmax, Tmin and Tmean monthly anomaly series was also tested using the
four tests mentioned above but in a relative manner using synthetic reference series developed with
the data from the other locations, as shown in Alexandersson and Moberg, [32]; Sánchez-Lorenzo
et al. [33]. No temperature series evidences inhomogeneities for the 1950–1984 and 1985–2011 periods,
thus indicating that all the temperature anomaly series can be considered homogeneous or at least not
inhomogeneous enough to change the series values. Detailed information and test results concerning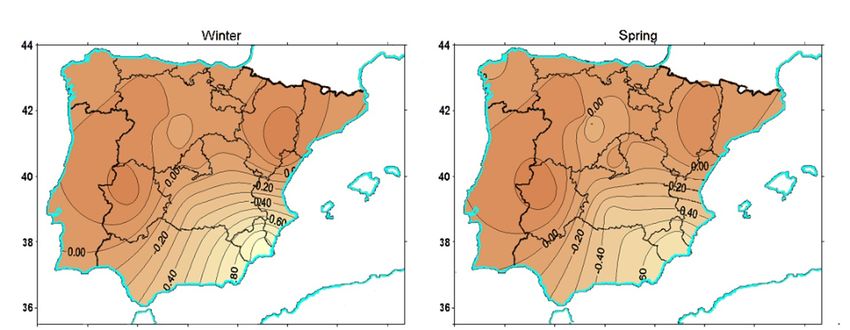
Climate 2019, 7, 16                                                                                 6 of 17

this homogeneity analysis may be found in Román [20]. Finally, results indicate that all the temperature
series can be considered homogeneous.

2.5. Theil-Sen Trend Estimator
     Different statistical estimators have been used over the world to study the climatological
temperature series. The climate variability study of data series and its analysis requires trends and
their statistical significance to be evaluated. Trend evaluations in seasonal and annual temperatures
(Tmax , Tmin and Tmean ) and DTR anomalies series were performed using the Theil-Sen (TTS ) estimator
and its 95% (α = 0.05) confidence interval (95CI) for 1950–2011. This estimator has been calculated
following the methods proposed by Sneyers, [34]; Gilbert, [35]. The results provide the most suitable
trend values due to the sensitivity of the method to extreme data, [15]. Similar tests have also been
used by Sayemuzzaman et al. [15]; Román et al. [22]; Espadafor et al. [36]; Gocic and Trajkovic, [27].
SURFER32 8 software was used for drawing the annual and seasonal trend spatial distributions of
temperatures and DTR over the Spain map. The results are in Figures 3–6 and named as temperature
and DTR anomaly isolines

2.6. The Mann-Kendall Non-Parametric Trend Test of Significance
      The Mann Kendall test is a statistical test widely used for trend analysis in climatological [11]
and hydrological time series [8]. The Mann-Kendall statistical test is frequently used to quantify the
significance of trends in meteorological time series. The advantage of the method is that normal
distribution of data is not expected. The result is seldom influenced by the fewer abnormal values and
calculation is simple. There are two advantages of using this test. First, it is a non-parametric test and
does not require data to be normally distributed. Second, the test has low sensitivity to abrupt breaks
due to inhomogeneous time series [4]. Any data reported as non-detects are included by assigning
them a common value that is smaller than the smallest measured value in the data set. According to
this test, the null hypothesis assumes there is no trend (data are independent and randomly ordered)
and this is tested against the alternative hypothesis, which assumes there is a trend [20].
      The statistical significance of each calculated trend was evaluated by the non-parametric
Mann–Kendall test, (Mann [37]; Kendall [38]) considering three types of trends: with a confidence
of 99% (p < 0.01), with a confidence of 95% but not 99% (p < 0.05) or non-significant at least at
95% confidence (p ≥ 0.05), as explained in Román et al. [28]. If the Mann–Kendall test considered
a trend to be statistically significant with at least 95% confidence, this trend was then assumed to be
only significant.

2.7. Diurnal Temperature Range Analysis
      DTR, defined as the difference between maximum and minimum temperature on a monthly
basis, has been evaluated. The monthly DTR anomaly homogeneity was tested, following the method
explained in Section 2.4 and the results indicate that DTR series can be considered homogeneous.
DTR is a measure of climate change due to its sensitivity to variations in radiative energy balance,
(Fernández-Montes et al. [39]; Wang et al. [40]). In addition, DTR decreased in most land areas since the
1950s due to diurnal changes in Tmax and Tmin (IPCC 2007, [41]). In some regions, Tmin has increased,
while Tmax has decreased, (Wang et al. [40]). Different studies show that DTR reduction depends on
meteorological variables such as cloud cover, soil moisture and precipitation. It is known that clouds
reflect sunlight and that Tmax therefore decreases. Moreover, longwave radiation increases at night
and, as a result, Tmin increases. Soil moisture reduces DTR by the surface evaporative cooling effect
on Tmax and precipitation affects DTR by increasing soil moisture, Wang et al. [40]. On a global scale,
the (IPCC 2007, [41]) reports a decrease in DTR of around 0.1 ◦ C per decade, for the period 1950–2004.
In this study, the temporal and spatial variability of annual and seasonal DTR trends of urban stations
were calculated. On a local scale, DTR trends of some new rural stations were evaluated and the results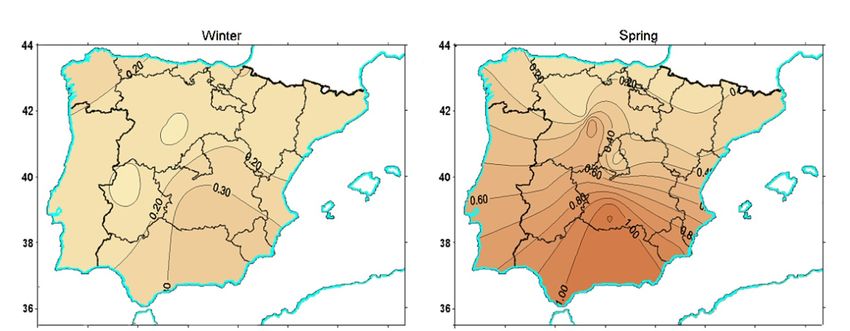
Climate 2019, 7, 16                                                                                              7 of 17

were compared with previous ones. The effects of sunshine hours, precipitation and relative humidity
on DTR change are examined.

3. Results

3.1. Temperature Long-term Trends (1950–2011)
     Linear trends in Tmax , Tmin , Tmean temperatures and DTR were assessed in Spain for the period
1950–2011 using nine weather station records. Table 2 summarizes the linear trends of temperature
variations in the data series on seasonal and annual timescales assessed at the 95% significance level.
Results show that Tmax, Tmin and Tmean temperatures have a statistically significant uptrend that
increased in the annual and seasonal scales

      Table 2. Seasonal and annual maximum (Tmax), minimum (Tmin), mean (Tmean) air temperature
      and diurnal temperature range (DTR) anomaly trends (◦ C decade−1 ) with the corresponding mean
      standard error, in Spain for the period 1950–2011. The results are significant at 99% confidence (p < 0.01),
      except Tmin in autumn.

                            Annual           Spring         Summer          Autumn           Winter
                  Tmax     0.26 ± 0.04     0.26 ± 0.07     0.36 ± 0.06     0.20 ± 0.06     0.22 ± 0.06
                  Tmin     0.17 ± 0.03     0.17 ± 0.05     0.24 ± 0.04     0.13 ± 0.05     0.14 ± 0.06
                  Tmean    0.22 ± 0.03     0.21 ± 0.06     0.30 ± 0.05     0.17 ± 0.06     0.18 ± 0.06
                  DTR      0.09 ± 0.02     0.09 ± 0.03     0.13 ± 0.02     0.06 ± 0.03     0.07 ± 0.03

      Warming was seen not to be uniform with time. Specifically, Tmax, showed stronger warming
during summer and spring than in winter and autumn. Warming in Tmin during winter and spring was
slightly higher than in autumn. For instance, our findings indicate that the annual mean temperature
has increased at a rate of 1.3 ◦ C over the whole period, which is comparable to the 1.1◦ C trend observed
for Mediterranean countries, Galdies, [14]; Del Rio et al. [11]; El Kenawy et al. [17]. Similarly, the study
domain experienced an uptrend of 1.6 ◦ C in Tmax between 1950 and 2011, which is also analogous to
the finding by Galdies, [14] in Malta. Annual Tmin showed a stronger upward trend (1.1 ◦ C) between
1950 and 2011, comparable to those of 1.1 ◦ C between 1951 and 2010 reported in Galdies, [14] for Malta
and the uptrend of 1.22 ◦ C along 87 years reported by El Kenawy et al. [17] in north-eastern Spain.
      Temporal evolution of temperatures and DTR anomalies for the period 1950–2011 is shown in
Figure 2 as bars. The dark blue lines show a low Gaussian filter of 11 years and anomalies were
calculated from the climatic norm of the 1961–1990 period. The 11-year moving line (dark line) average
shows a strong increase in Tmax , Tmin and Tmean temperatures and DTR anomalies over the last
three decades, particularly in spring, summer and annual periods. An air temperature reduction
in Spain between 1950 and 1980 emerges and significant warming is observed between 1980 and
2011. The causes of this temperature variation would be the global and “dimming” and “brightening”
phenomena as Román [20] explains with details.
      The warmest years over the whole period (1950–2011) were restricted to the past two decades.
Over this period, 1990, 1995, 1997, 2003, 2006, 2009, 2011 were identified as unusually warm years.
      Moreover, the anomalies of summer maximum temperature during 1990, 1995, 1997, 2003, 2006,
2009 and 2011 were 1.92 ◦ C, 2.19 ◦ C, 1.90 ◦ C, 1.75 ◦ C, 2.06 ◦ C, 2.14 ◦ C and 2.33 ◦ C, respectively and
were four of the ten warmest years to occur in the past ten years (2003, 2006, 2009 and 2011). In contrast,
the coldest on record were found during the earlier decades (e.g., 1950s, 1960s and 1970s).
      These results probably imply that the uptrend observed in minimum temperature over the period
(1950–2011) is largely attributed to the rapid warming in recent decades. In contrast to cold seasons, the
annual behaviour of temperature anomalies is broadly consistent with the behaviour of temperature
anomalies during warm seasons. Similarly, the temporal evolution of annual DTR anomalies is more
consistent with temperature trends in hot seasons rather than in cold seasons.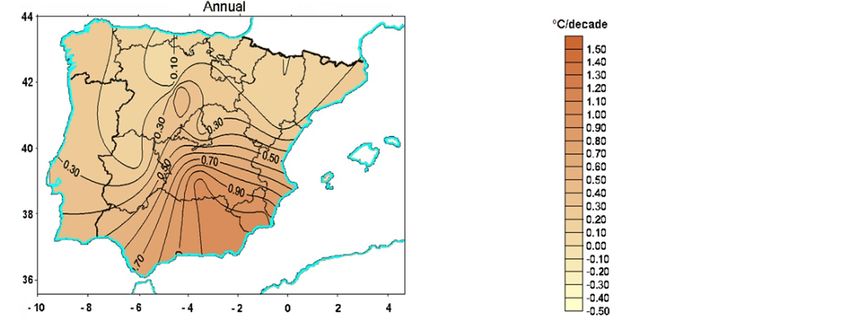
Climate 2019, 7, 16                                                                                           8 of 17

                         Maximum               Mean                   Minimum                      DTR
                 4                    4                     4                          4

                 2                    2                     2                          2
    Spring, ºC

                 0                    0                     0                          0

                 -2                   -2                    -2                        -2

                 -4                   -4                    -4                        -4
                  1950 1970   1990 2010 1950 1970 1990   2010 1950   1970 1990 2010 1950 1970         1990 2010
                 4                     4                     4                     4

                 2                    2                     2                          2
    Summer, ºC

                 0                    0                     0                          0

                 -2                   -2                    -2                        -2

                 -4                   -4                    -4                    -4
                  1950 1970   1990 2010 1950 1970 1990   2010 1950   1970 1990 2010 1950 1970         1990 2010
                 4                     4                     4                     4

                 2                    2                     2                          2
    Autumn, ºC

                 0                    0                     0                          0

                 -2                   -2                    -2                        -2

                 -4                   -4                    -4                        -4
                  1950 1970   1990 2010 1950 1970 1990   2010 1950   1970 1990 2010 1950 1970         1990 2010
                 4                     4                     4                     4

                 2                    2                     2                          2
    Winter, ºC

                 0                    0                     0                          0

                 -2                   -2                    -2                        -2

                 -4                   -4                    -4                        -4
                  1950 1970   1990 2010 1950 1970 1990   2010 1950   1970 1990 2010 1950 1970         1990 2010
                 4                     4                     4                     4

                 2                    2                     2                          2
    Annual, ºC

                 0                    0                     0                          0

                 -2                   -2                    -2                        -2

                 -4                   -4                    -4                        -4
                  1950 1970   1990 2010 1950 1970 1990   2010 1950   1970 1990 2010 1950 1970         1990 2010

      Figure 2. Seasonal and annual anomalies of maximum, mean and minimum temperatures (◦ C) and
      DTR time series for the period 1950–2011 shown as light blue bars. Dark blue lines show a low Gaussian
      Figure 2. Seasonal and annual anomalies of maximum, mean and minimum temperatures (°C) and
      filter of 11 years. The anomalies were calculated from the climatic norm of 1961–1990 period.
      DTR time series for the period 1950–2011 shown as light blue bars. Dark blue lines show a low
      Gaussianand
3.2. Seasonal     filter of 11 years.
                      Annual          The anomalies
                                Temperature  and DTRwere calculated
                                                       Trends       from the climatic norm of 1961–1990 period.
                                                               (1950–2011)
      The values
3.2. Seasonal and of seasonal
                  Annual      and annual
                           Temperature   andtrends  from 1950
                                              DTR Trends       to 2011 in Tmax as isoline maps are presented
                                                            (1950–2011)
in Figure 3. In general, spatial Tmax trends decreased to the north and northeast and increased in the
southThe  values
       of the     of seasonal
               country.  Largeand  annual
                                positive     trendscan
                                           trends    from
                                                        be 1950
                                                           seentoin2011 in Tand
                                                                    spring   max as isoline maps are presented
                                                                                  summer that are significant
in Figure  3. In general, spatial T max trends decreased to the north and northeast and increased in the
(p < 0.05) in about 70% of all areas according to the Mann-Kendall test. For Tmax trends values at
south of the country. Large positive trends can be seen in spring and summer that are significant (p
< 0.05) in about 70% of all areas according to the Mann-Kendall test. For Tmax trends values at annual

                                                                                                                   8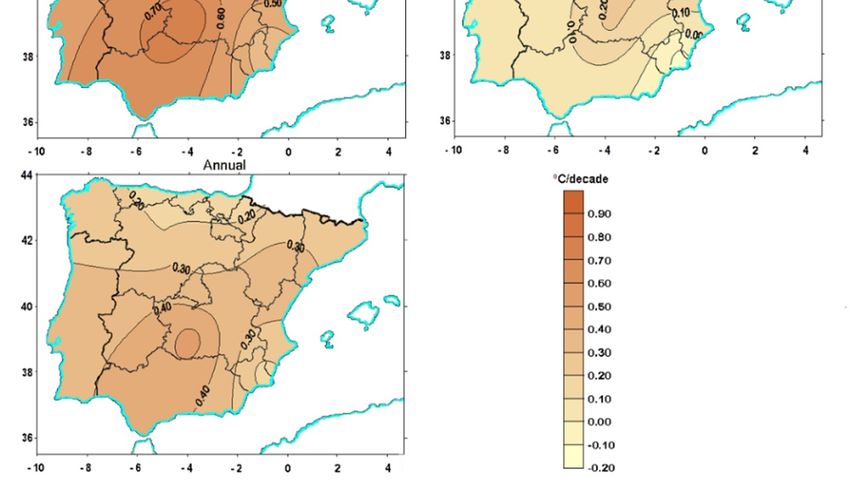
Climate 2019, 7, 16                                                                                                          9 of 17

 scale, inscale,
annual      all stations     show statistically
                   in all stations                  significant
                                      show statistically           trends at
                                                              significant        99% (p
                                                                               trends  at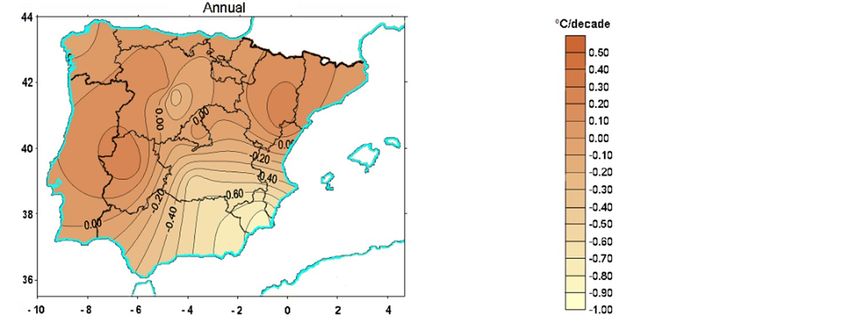
Climate 2019, 7, 16 10 of 17
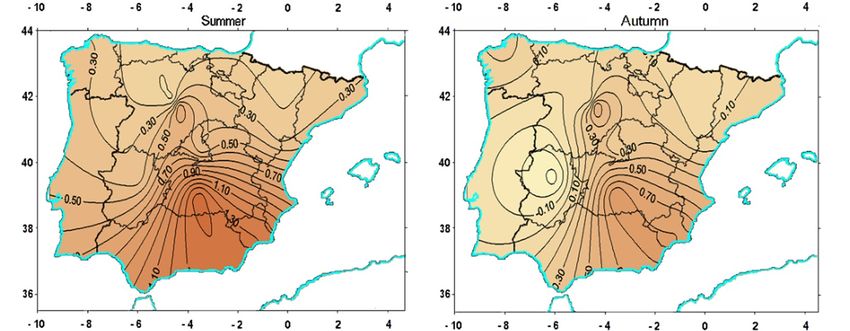
Tortosa, Valladolid and Villalba. in winter. Trend values of Tmin show a south north gradient in all
Villalba. in winter.
seasons from Trendvalues
very high valuesonofcoastal
Tmin show
sites. a south north gradient in all seasons from very high
values on coastal sites.
Figure 4. Isolines of seasonal and annual trends in minimum temperature anomalies in Spain over the
Figure 4. Isolines of seasonal and annual trends in minimum temperature anomalies in Spain over
period 1950–2011, expressed in ◦ C decade−1 . -1
the period 1950–2011, expressed in °C decade .
Rates of change in trend range from 0.1 to 1.4 ◦ C decade−1 , in spring and summer. The seasonal
Rates of change in trend range from 0.1 to 1.4 °C decade-1, in spring and summer. The seasonal
Tmin trends change in a range from 0.1 to 1.40 ◦ C decade−1 in summer and from 0.1 to 0.8 ◦ C decade−1
Tmin trends change in a range from 0.1 to 1.40 °C decade-1 in summer and from 0.1 to 0.8 °C decade-1
in autumn, as can be seen in Figure 4. Annual Tmin trends range from 0.1 to 1.0 ◦ C decade−1 and are
in autumn, as can be seen in Figure 4. Annual Tmin trends range from 0.1 to 1.0 °C decade-1 and are
more related to the increase in summer and spring.
more related to the increase in summer and spring.
The seasonal and annual trend values in Tmean over the period 1950–2011 in Spain are shown as
The seasonal and annual trend values in Tmean over the period 1950–2011 in Spain are shown as
isoline maps in Figure 5. The magnitude of trends varies among the seasons.
isoline maps in Figure 5. The magnitude of trends varies among the seasons.
Tmean shows the greatest and most widespread warming in spring and summer. The trend change
ranges from 0.1 to 1.1 ◦ C decade−1 in summer and from 0.2 to 1.1 ◦ C decade−1 in spring. Annual Tmean
trends range from 0.2 to 0.7 ◦ C decade−1 and are more related to the increase in autumn and winter.
10Climate 2019, 7, 16 11 of 17
Figure 5. Isolines of seasonal and annual trends in mean
Figure 5. mean temperature
temperature anomalies
anomalies in Spain
Spain over
over the
the
period 1950–2011, expressed in ◦ C decade− 1.
period 1950–2011, expressed in ºC -1 .
Figure 6 shows
Tmean shows thethe isolines
greatest andofmost
seasonal and annual
widespread trendsin
warming inspring
DTR overand the periodThe
summer. 1950–2011 in the
trend change
Iberian Peninsula. For DTR trends at annual scale, all stations present statistically
ranges from 0.1 to 1.1 °C decade-1 in summer and from 0.2 to 1.1 °C decade-1 in spring. Annual Tmean significant trends at
99% confidence,
trends range from except
0.2 toCaceres that is-1not
0.7 °C decade andsignificant. In addition,
are more related to theall stations
increase in trends
autumn areand
statistically
winter.
significant at 99% except Caceres and San Sebastian that are significant at 95%
Figure 6 shows the isolines of seasonal and annual trends in DTR over the period 1950–2011 (p < 0.05), in summer. in
Murcia trends
the Iberian are statistically
Peninsula. For DTR significant
trends atatannual
95% (pscale,
< 0.05);
all San Sebastian,
stations presentCaceres, Valladolid
statistically and
significant
Villalba
trends atDTR99%trends are not
confidence, significant
except Caceresandthatthe
is rest of stations In
not significant. areaddition,
significantall at 99% intrends
stations autumn.
are
Villalba trends are not statistically significant; San Sebastian and Caceres are statistically
statistically significant at 99% except Caceres and San Sebastian that are significant at 95% (p < 0.05), significant
at
in 95% (p < 0.05);
summer. Murciathe trends
rest of stations are statistically
are statistically significantsignificant
at 95% at (p99% (p < 0.01)
< 0.05); in spring. Caceres,
San Sebastian, Caceres,
Murcia, Tortosa and Valladolid are not statistically significant in winter. San
Valladolid and Villalba DTR trends are not significant and the rest of stations are significant Sebastian and Villalba
at 99%
are statistically
in autumn. significant
Villalba trendsatare 95%not(pstatistically
< 0.05); andsignificant;
Ciudad Real, SanCoruña,
Sebastian Madrid and IP are
and Caceres are statistically
statistically
significant
significant at
at 99%
95% (p (pwhich fall within the following intervals: Ciudad Real (-0.40 to -0.80 °C decade- 1), Murcia (-0.7 to -1.0
°C decade-1) and Valladolid (-0.20 to -0.70 °C decade-1). It should also be clarified that in Table 2, DTR
trends are positive because they are averaged values for IP station, which was defined at the end of
Introduction section.
Climate 2019, 7, 16 12 of 17
Figure 6. Isolines
Figure6. Isolines of
of seasonal
seasonal and
and annual
annual trends
trends in
in diurnal
diurnal temperature
temperaturerange
range(DTR)
(DTR)in
inSpain
Spain over
over the
the
period 1950–2011, expressed in ◦ C decade−-11 .
period 1950–2011, expressed in °C decade .
The significant negative trends in 75% of the area, namely the south and part of the south east
4. Discussion
up to the region of Valencia, are shown in Figure 6. The results obtained concur with other authors’
results;
4.1. DTR Del Rio etinal.
Trends [10];Stations
Rural Galdies [13]; El Kenawy et al. [17]; Fernández-Montes et al. [39]; Makouski
et al. [42]; Vose et al. [43]. Spatial DTR trends decrease over annual and seasonal periods at the stations
12
located in the south and southeast of the country. The magnitude of temporal DTR trends changes
with the season. The smallest DTR trends are obtained in winter and autumn, where trends range
from 0.20 to −0.90 ◦ C decade−1 and 0.40 to −0.70 ◦ C decade−1 , respectively. The highest negative
trends in DTR are shown in spring and summer and range from 0.20 to −0.60 ◦ C decade−1 and 0.4 to
−1.0 ◦ C decade−1 , respectively. Annual DTR trends range from 0.2 to −0.8 ◦ C decade−1 and they are
more related to the increase in Tmin. These negative DTR trends are due to the fact that stations like
Ciudad Real, Murcia, San Sebastian and Valladolid reach high negative values in seasonal and annual
DTR trends, which fall within the following intervals: Ciudad Real (−0.40 to −0.80 ◦ C decade−1 ),
Murcia (−0.7 to −1.0 ◦ C decade−1 ) and Valladolid (−0.20 to −0.70 ◦ C decade−1 ). It should also be
clarified that in Table 2, DTR trends are positive because they are averaged values for IP station, which
was defined at the end of Introduction section.Climate 2019, 7, 16 13 of 17
4. Discussion
4.1. DTR Trends in Rural Stations
DTR trend is an important climate variable and it is widely known that changes in clouds, aerosol,
sunshine hours and urbanization may affect it. In this section, the pairwise comparison between rural
and urban stations is shown in order to observed DTR differences. Table 3 shows the seasonal DTR
trends in three different areas and at four rural stations, Santiago de Compostela, Zaragoza, Granada
and Villalba, Acero et al. [44] and it observed that seasonal DTR trend values were relatively small,
almost all positive and they ranged between 0.23 and −0.08 ◦ C decade−1 . The comparison in DTR
trend values in urban and rural areas reveals that the effect of urbanization on DTR trends entails
lower DTR trend in rural areas. In addition and for clarifying the idea, the influence of urbanization
on DTR was evaluated by comparison between DTR at rural and nearby urban station. From Figure 1,
three pairs of stations selected and their DTR monthly differences calculated for each pair. The pairs of
selected stations were Santiago de Compostela and Coruña, Villalba and Valladolid and Zaragoza and
Tortosa. Finally, the statistical significance of each time series was tested by Kolmogorov-Smirnov and
t-Student tests and the results showed that the difference series were significant at 95% confidence level,
p < 0.05, where Santiago de Compostela and Coruña obtained p = 0.001; Villalba and Valladolid p = 0.04
and Zaragoza and Tortosa p = 0.02. The results indicated that the series analysed were statistically
significant with a confidence of 95% (p < 0.05) and therefore there was a difference between rural and
urban DTRs. It recommends that the estimations should be repeated using a greater number of rural
stations in order to reach definitive conclusions.
Table 3. Seasonal DTR trends (◦ C decade−1 ) at three different areas and four rural stations (*) with the
corresponding mean standard error in Spain for the period 1950–2011 The results are significant at the
0.05 level.
Area Spring Summer Autumn Winter
Centre 0.16 ± 0.06 0.25 ± 0.05 0.15 ± 0.08 0.17 ± 0.06
Atlantic 0.00 ± 0.00 −0.01 ± 0.01 −0.01 ± 0.00 0.01 ± 0.01
Mediterranean −0.29 ± 0.04 −0.20 ± 0.07 −0.11 ± 0.06 −0.22 ± 0.06
*Villalba 0.13 ± 0.04 0.23 ± 0.06 0.06 ± 0.03 0.13 ± 0.06
*Granada (air base) 0.07 ± 0.05 −0.06 ± 0.05 0.03 ± 0.04 0.22 ± 0.09
*Santiago de Compostela 0.10 ± 0.04 −0.07 ± 0.04 0.01 ± 0.01 0.01 ± 0.01
*Zaragoza (Airport) 0.00 ± 0.01 0.07 ± 0.03 −0.08 ± 0.04 0.02 ± 0.02
4.2. Causes of DTR Decreases
In an initial study, the decrease in DTR attributed to the high rate of increase in Tmin with regard
to Tmax . The possible causes of DTR variation studied by analysing the trends and correlation between
DTR and the meteorological variable values, as suggested by Wang et al. [40]. Annual DTR trends in
the Iberian Peninsula series correlated with relative humidity, precipitation and sunshine hour annual
values. Results showed that relative humidity and precipitation were negatively correlated with
DTR, with the obtained correlation coefficients being −0.88 and −0.79, respectively. The correlation
coefficient between sunshine hours and DTR was 0.57. This study found that the magnitude of DTR
decreases when precipitation and relative humidity increase. These results were compared with
Zhou et al. [45], who obtained a similar correlation coefficient for precipitation and DTR in a semi-arid
region of China, with values between −0.82 and −0.54. In addition, Zhou et al. [45] observed that DTR
and precipitation correlation may reflect the large-scale effects of increased global greenhouse gases
and aerosols (and associated changes in cloud, soil moisture and water vapour) in DTR. Although in
our case, a negative correlation between DTR and precipitation would be expected just because both
are regulated by clouds and water vapour.
DTR is considered a suitable measure of climate change because of its sensitivity to variations
in the radiative energy balance. In our results, DTR has decreased because Tmin increases more thanClimate 2019, 7, 16 14 of 17
Tmax and DTR is negative. In physical terms, DTR reduction is generally a consequence of increases in
cloud cover, relative humidity, precipitation, atmospheric gases and the optical properties of aerosol.
Clouds affect DTR because during the day they reflect sunlight, as a result of which Tmax decreases,
while at night they increase downward longwave radiation, such that Tmin increases. Soil moisture
may reduce DTR at surface by the evaporation cooling effect on Tmax . Precipitation may affect DTR
indirectly by increasing soil moisture content. Other atmospheric components, such as aerosol and
greenhouse gases may also contribute to reducing DTR, (IPCC 2007, [41]). Aerosol may affect DTR by
reflecting solar radiation and by modifying cloud properties and greenhouse gases may play a role in
altering DTR by controlling the surface energy and hydrological balance. The highest reduction of
DTR trends in summer season may be associated with the combination of the higher increasing trends
in relative humidity in some stations and high temperatures in the southeast Mediterranean area, for
example, Murcia that shows maximum in relative humidity and temperature in August.
5. Conclusions
It has been observed that Tmax , Tmin and Tmean trends increased and DTR trends decrease at
certain stations in Spain. The results also show that the difference between the DTR trends in urban
and rural stations may be due to phenomena such as the increase in the number of urbanized areas in
certain parts of the country. DTR variation is controlled by meteorological variables and anthropogenic
factors such as greenhouse gases and planned urban development. More studies investigating the
causes of DTR variations are required to complete the study.
The main aim of this study was to evaluate Tmax , Tmin , Tmean trends and DTR variability and
to obtain some estimates of the potential causes of said variability for the period of 1950–2011 over
certain stations in Spain. The main conclusions to emerge from this work are:
1. Tmax , Tmin and Tmean seasonal and annual trends were positive and Tmin obtained the highest
trend values. Seasonal and annual DTR trends decreased for the period 1950–2011, in Spain.
2. The largest increase in Tmin was observed in the NE and SE. Intense urbanization and
increasing irrigation might be causing night-time warming. This result concurs with trends found by
different authors.
3. The causes of DTR decreases were studied, correlating meteorological surface variables
and DTR trends. Decreases observed in DTR trends might be related to the influence of certain
meteorological variables and particularly to relative humidity, precipitation and sunshine hours. Data
from the three meteorological variables used for correlation analysis. Results show that sunshine
hours have a positive correlation with DTR and precipitation and relative humidity have negative
correlation with DTR. The highest reduction of DTR trends in summer season may be associated with
the combination of the higher increasing trends in relative humidity and high temperatures in the
southeast Mediterranean area.
4. Small towns and airports chosen as rural stations and their DTR trends were evaluated.
Results show that rural DTR trends were small and positive in all seasons and annual series. These
results reveal that aerosols (such as desert dust and smoke) in urban stations may have an important
influence on solar irradiation reduction, so, Tmax and DTR should decrease and DTR trend should be
more negative.
The causes of DTR decreases were studied by analysing the correlation between DTR and
meteorological surface variables. Results indicate that sunshine hours have a positive correlation with
DTR while DTR and precipitation and relative humidity evidence a negative correlation. In general,
a number of factors control DTR variations. In addition to the meteorological surface variables and
anthropogenic factors analysed in this study, other factors (e.g., boundary layer, greenhouse gases)
may also affect DTR changes. In view of the results, further analysis of the causes underlying DTR
variation is necessary. Given the importance of climate change, further research is also encouraged to
assess the impact of climate variation on the energy resources in this country.Climate 2019, 7, 16 15 of 17
Author Contributions: Conceptualization, J.B., R.R. and A.D.M.; methodology, R.R. and J.B.; software, R.R. and
A.D.M.; validation R.R., A.D.M.; formal analysis, A.D.M. and J.B.; investigation, J.B.; resources, J.B. and R.R.;
data curation, J.B., R.R. and A.D.M.; writing original draft preparation, J.B., A.D.M. and R.R.; visualization, J.B.;
supervision, J.B.; project administration, J.B.; funding acquisition, J.B., All authors participated in writing the draft.
Funding: This research was funded by Spanish Ministry of Science and Innovation for the (CGL2011-25363)
project. The authors also thank the Spanish Meteorological Agency (AEMet), www.aemet.es for making the air
temperature data available.
Conflicts of Interest: The authors declare no conflict of interest.
References
1. IPCC. Climate Change 2013: The Physical Science Basis; Contribution of Working Group I to the Fifth Assessment
Report of the Intergovernmental Panel on Climate Change; Stocker, T.F., Qin, D., Plattner, G.K., Tignor, M.,
Allen, S.K., Boschung, J., Nauels, A., Xia, Y., Bex, V., Midgley, P.M., Eds.; Cambridge University Press:
Cambridge, UK; New York, NY, USA, 2013; 1535p. [CrossRef]
2. McMichael, A.J.; Campbell-Lendrum, D.H.; Corvalán, C.F.; Ebi, K.L.; Githeko, A.K.; Scheraga, J.D.;
Woodward, A. Climate Change and Human Health: Risks and Responses; World Health Organization: Geneva,
Switzerland, 2003; ISBN 92-4-1-56248-X.
3. Giorgi, F.; Lionello, P. Climate change projections for the Mediterranean region. Glob. Planet. Chang. 2008, 63,
90–104. [CrossRef]
4. Sayemuzzaman, M.; Jha, M.K.; Mekonnen, A.; Schimmel, K.A. Subseasonal climate variability for North
Carolina, United States. Atmos. Res. 2014, 145, 69–79. [CrossRef]
5. Brunet, M.; Saladié, O.; Jones, P.D.; Sigró, J.; Moberg, A.; Aguilar, E.; Walther, A.; Lister, D.; López, D. The
development of a new daily adjusted temperature dataset for Spain (1850–2003). Int. J. Climatol. 2006, 26,
1777–1802. [CrossRef]
6. Brunet, M.; Jones, P.D.; Sigro, J.; Saladie, O.; Aguilar, E.; Moberg, A.; Della-Marta, P.M.; Lister, D.; Walther, A.;
López, D. Temporal and spatial temperature variability and change over Spain during 1850–2005. J. Geophys.
Res. 2007, 112, D12117. [CrossRef]
7. Esteban-Parra, M.J.; Rodrigo, J.S.; Castro-Diez, Y. Temperature trends and change points in the Northern
Spanish Plateau during the last 100 years. Int. J. Climatol. 1995, 15, 1031–1042. [CrossRef]
8. Homar, V.; Ramis, C.; Romero, R.; Alonso, S. Recent trends in temperature and precipitation over the Balearic
Islands (Spain). Clim. Chang. 2010, 98, 199–211. [CrossRef]
9. Martín, J.L.; Bethencourt, J.; Cuevas-Agulló, E. Assessment of global warming on the island of Tenerife,
Canary Islands (Spain). Trends in minimum, maximum and mean temperatures since 1944. Clim. Chang.
2012, 114, 343–355. [CrossRef]
10. Del Río, S.; Herrero, L.; Pinto-Comes, C.; Penas, A. Spatial analysis of mean temperature trends in Spain
over the period 1961–2006. Glob. Planet. Chang. 2011, 78, 65–75. [CrossRef]
11. Del Río, S.; Cano-Ortiz, A.; Herrero, L.; Penas, A. Recent trends in mean maximum and minimum air
temperatures over Spain (1961–2006). Theor. Appl. Climatol. 2012, 109, 605–626. [CrossRef]
12. Rodriguez-Puebla, C.; García-Casado, L.A.; Frías, M.D.; Sáenz, J.; Zubillaga, J. Trend and interannual
variations in air temperature over Iberian Peninsula. In Proceedings of the 13th Symposium on Global
Change and Climate Variations, Orlando, FL, USA, 13–17 January 2002; American Meteorological Society:
Boston, FL, USA, 2001; pp. 106–108.
13. Kadioglu, M. Trends in Surface temperature data over Turkey. Int. J. Climatol. 1997, 17, 511–520. [CrossRef]
14. Galdies, C. Temperature trends in Malta (central Mediterranean) from 1951 to 2010. Meteorol. Atmos. Phys.
2012, 117, 135–143. [CrossRef]
15. Sayemuzzaman, M.; Mekonnena, A.; Jha, M.K. Diurnal temperature range trend over North Carolina and
the associated mechanisms. Atmos. Res. 2015, 160, 99–108. [CrossRef]
16. Ventura, F.; Rossi Pisa, P.; Ardizzoni, E. Temperature and precipitation trends in Bologna (Italy) from 1952 to
1999. Atmos. Res. 2002, 61, 203–214. [CrossRef]
17. El Kenawy, A.; López-Moreno, J.I.; Stepanekc, P.; Vicente-Serrano, S.M. An assessment of the role of
homogenization protocol in the performance of daily temperature series and trends: Application to
northeastern Spain. Int. J. Climatol. 2013, 33, 87–108. [CrossRef]Climate 2019, 7, 16 16 of 17
18. Bilbao, J.; Román, R.; De Miguel, A. Global ultraviolet solar irradiation and meteorological variable trends
in Spain. In Current Trends in Energy and Sustainability; Gómez-Calvet, R., Martínez-Duart, J.M., Eds.; Real
Sociedad Española de Física: Madrid, Spain, 2015; pp. 205–222. ISBN 978-84-608-5438-8.
19. De Miguel, A.; Mateos, D.; Bilbao, J.; Román, R. Sensitivity analysis of the ratio between ultraviolet and
total short wave solar radiation to cloudiness, ozone, aerosols and precipitable water. Atmos Res. 2011, 101,
136–144. [CrossRef]
20. Román, R. Reconstrucción y Análisis de la Radiación Ultravioleta Eritemática en la Península Ibérica Desde
1950. Ph.D. Thesis, University of Valladolid, Valladolid, Spain, 2014.
21. WMO (World Meteorological Organization). Guide to Meteorological Instruments and Methods of Observation,
7th ed.; WMO Publication 8; WMO: Geneva, Switzerland, 2008.
22. Román, R.; Bilbao, J.; De Miguel, A. Reconstruction of six decades of daily total solar shortwave irradiation
in the Iberian Peninsula using sunshine duration records. Atmos. Environ. 2014, 99, 41–50. [CrossRef]
23. Bilbao, J.; De Miguel, A.; Ayuso, A.; Franco, J.A. Iso-radiation maps for tilted surfaces in the Castile and
Leon region, Spain. Energy Convers. Manag. 2003, 44, 1575–1588. [CrossRef]
24. Miguel, A.; Bilbao, J.; Román, R.; Mateos, D. Measurements and attenuation of erythemal radiation in Central
Spain. Int. J. Climatol. 2003, 32, 929–940. [CrossRef]
25. Román, R.; Antón, M.; Valenzuela, A.; Gil, J.E.; Lyamani, H.; De Miguel, A.; Olmo, F.J.; Bilbao, J.;
Alados-Arboledas, L. Evaluation of the desert dust effects on global, direct and diffuse spectral ultraviolet
irradiance. Tellus B 2013, 65, 19578. [CrossRef]
26. Sánchez-Lorenzo, A.; Brunetti, M.; Calbó, J.; Martin-Vide, J. Recent spatial and temporal variability and
trends of sunshine duration over the Iberian Peninsula from a homogenized data set. J. Geophys. Res. Atmos.
2007, 112, D20115. [CrossRef]
27. Gocic, M.; Trajkovic, S. Analysis of changes in meteorological variables using Mann-Kendall and Sen’s slope
estimator statistical tests in Serbia. Glob. Planet. Chang. 2013, 100, 172–182. [CrossRef]
28. Román, R.; Bilbao, J.; De Miguel, A. Erythemal ultraviolet irradiation trends in the Iberian Peninsula from
1950 to 2011. Atmos. Chem. Phys. 2015, 15, 375–391. [CrossRef]
29. Wijngaard, J.B.; Klein-Tank, A.M.G.; Können, G.P. Homogeneity of 20th century European daily temperature
and precipitation series. Int. J. Climatol. 2003, 23, 679–692. [CrossRef]
30. Hakuba, M.Z.; Sánchez-Lorenzo, A.; Folini, D.; Wild, M. Testing the homogeneity of short-term surface solar
radiation series in Europe. AIP Conf. Proc. 2013, 1531, 700–703.
31. Wild, M. Enlightening global dimming and brightening. Bull. Am. Meteorol. Soc. 2012, 93, 27–37. [CrossRef]
32. Alexandersson, H.; Moberg, A. Homogenization of Swedish temperature data. Part I: Homogeneity test for
linear trends. Int. J. Climatol. 1997, 17, 25–34. [CrossRef]
33. Sánchez-Lorenzo, A.; Wild, M.; Trentmann, J. Validation and stability assessment of the monthly mean
CM SAF surface solar radiation dataset over Europe against a homogenized surface dataset (1983–2005).
Remote Sens. Environ. 2013, 134, 355–366. [CrossRef]
34. Sneyers, R. On the Statistical Analysis of Series of Observations; WMO Technical Note 143, WMO No. 415,
TP-103; World Meteorological Organization: Geneva, Switzerland, 1990; p. 192.
35. Gilbert, R.O. Statistical Methods for Environmental Pollution Monitoring; Van Nostrand Company: Hoboken,
NJ, USA, 1987; 320p.
36. Espadafor, M.; Lorite, I.J.; Gavilán, P.; Berengena, J. An analysis of the tendency of reference
evapotranspiration estimates and other climate variables during the last 45 years in Southern Spain.
Agric. Water Manag. 2011, 98, 1045–1061. [CrossRef]
37. Mann, H.B. Non-parametric tests against trend. Econometrica 1945, 13, 245–259. [CrossRef]
38. Kendall, M.G. Rank Correlation Measures; Charles Griffin: London, UK, 1975.
39. Fernández-Montes, S.; Rodrigo, F.S. Trends in surface air temperatures, precipitation and combined indices
in the southeastern Iberian Peninsula (1970−2007). Clim. Res. 2015, 63, 43–60. [CrossRef]
40. Wang, F.; Zhang, C.; Peng, Y.; Zhou, H. Diurnal temperature range variation and its causes in a semiarid
region from 1957 to 2006. Int. J. Climatol. 2014, 34, 343–354. [CrossRef]
41. IPCC. IPCC Fourth Assessment Reports (AR4): Working Group I Report: Climate Change 2007, the Physical Basis
(WMO/UNEP) Report; Cambridge University Press: Cambridge, UK; New York, NY, USA, 2007.
42. Makowski, K.; Wild, M.; Ohmura, A. Diurnal temperature range over Europe between 1950 and 2005.
Atmos. Chem. Phys. 2008, 8, 6483–6498. [CrossRef]Climate 2019, 7, 16 17 of 17
43. Vose, R.S.; Easterling, D.R.; Gleason, B. Maximum and minimum temperature trends for the globe: An
update through 2004. Geophys. Res. Lett. 2005, 32, L23822. [CrossRef]
44. Acero, F.J.; Garcia, J.A.; Gallego, M.C.; Parey, S.; Dacunha-Castelle, D. Trends in summer extreme
temperatures over the Iberian Peninsula using nonurban station data. J. Geophys. Res. Atmos. 2014,
119, 39–53. [CrossRef]
45. Zhou, L.; Dai, A.; Dai, Y.; Vos, R.S.; Zou, C.H.; Tian, Y.; Chen, H. Spatial dependence of diurnal temperature
range trends on precipitation from 1950 to 2004. Clim. Dyn. 2009, 32, 429–440. [CrossRef]
© 2019 by the authors. Licensee MDPI, Basel, Switzerland. This article is an open access
article distributed under the terms and conditions of the Creative Commons Attribution
(CC BY) license (http://creativecommons.org/licenses/by/4.0/).You can also read