Investor Presentation - COVID-19 update & Results for the full year ended 31 December 2020 - PureGym

Page created by Marcus Barrett
 
CONTINUE READING
Investor Presentation - COVID-19 update & Results for the full year ended 31 December 2020 - PureGym
Investor Presentation
                COVID-19 update &
21 April 2021   Results for the full year ended 31 December 2020
                                                Investor Presentation 21 April 2021 1
Investor Presentation - COVID-19 update & Results for the full year ended 31 December 2020 - PureGym
Disclaimer
Forward-looking statements
This presentation may include forward-looking statements. All statements other than statements of historical facts included in this presentation, including those
regarding the Group's financial position, business and acquisition strategy, plans and objectives of management for future operations are forward-looking
statements. Such forward-looking statements involve known and unknown risks, uncertainties and other factors which may cause the actual results, performance
or achievements of the Group, or industry results, to be materially different from any future results, performance or achievements expressed or implied by such
forward-looking statements. Such forward-looking statements are based on numerous assumptions regarding the Group's present and future business strategies
and the environment in which the Group will operate in the future. Many factors could cause the Group's actual results, performance or achievements to differ
materially from those in the forward-looking statements. Forward-looking statements should, therefore, be construed in light of such risk factors and undue
reliance should not be placed on forward-looking statements. These forward-looking statements speak only as of the date of this presentation. The Group
expressly disclaims any obligations or undertaking, except as required by applicable law and applicable regulations to release publicly any updates or revisions to
any forward-looking statement contained herein to reflect any change in the Group's expectations with regard thereto or any changes in events, conditions or
circumstances on which any such statement is based.

Use of non-IFRS financial information
Certain parts of this report contain non-IFRS measures and ratios. We believe that these measures are useful indicators of our ability to incur and service our
indebtedness and can assist certain investors, security analysts and other interested parties in evaluating us. Because all companies do not calculate these
measures on a consistent basis, our presentation of these measures may not be comparable to measures under the same or similar names used by other
companies. Accordingly, undue reliance should not be placed on these measures in this presentation. In particular, Adjusted EBITDA and Run-Rate Adjusted EBITDA
are not measures of our financial performance or liquidity under IFRS and should not be considered as an alternative to (a) net income/(loss) for the period as a
measure of our operating performance, (b) cash flows from operating, investing and financing activities as a measure of our ability to meet our cash needs or (c)
any other measures of performance under IFRS.

                                                                                                                                        Investor Presentation 21 April 2021 2
Investor Presentation - COVID-19 update & Results for the full year ended 31 December 2020 - PureGym
Contents
1   Introduction & Overview

2   COVID-19 Update

3   Cash Flow & Liquidity

4   Financial Performance Update

5   Outlook

6   Conclusion

7   Appendix

                                   Investor Presentation 21 April 2021 3
Investor Presentation - COVID-19 update & Results for the full year ended 31 December 2020 - PureGym
Introduction & Overview                    COVID-19 update                   Cash flow & liquidity                   Financial performance                        Outlook                  Conclusion                   Appendix

           Introduction & overview
           COVID-19 update
           • Gyms in England & Switzerland open & early trading is in line with management expectations
           • Scotland opens 26 April with Wales, NI & Denmark expected to be open by mid May1
           • 1.4m members retained as at Mar 2021 (vs. 1.7m at Dec 2019)
           Current cash & liquidity position
           • £236m available liquidity as at end of December 20202
           • £231m available liquidity as at end of Q1 2021, post successful €45m bond raise2
           FY 2020 financial update
           • Results materially impacted by COVID-19, with only 63% of open trading days vs 2019
           • Effective navigation of the crisis, cash control & operational management
           • Successful £100m equity raise, £50m RCF extension & 3 year+ covenant waiver3
           • Clean audit opinion with no material uncertainty over going concern4
           Outlook
           • Immediate focus on successful reopening & reflation of the business
           • Positive perspective on post COVID-19 market dynamics for PureGym
           • 11 new sites opened in April & our high quality new site pipeline remains intact

Notes:
1.     Based on our best estimate having considered the latest government guidance in each of the geographies in which we operate
2.     Comprising cash & undrawn RCF facilities. Subject to a quarterly £30m minimum liquidity covenant test. £37m of deferred payments outstanding as at 31-Dec 2020. £41m of deferred payments (net) were outstanding at 31-Mar-2021 (comprising £47m of deferred payments outstanding, offset by £6m of Government receipts due)
3.     Leverage covenant test waived until August 2024
4.     PureGym Group received a clean & unqualified audit opinion. The Directors of many other covid impacted businesses are required to announce that they have a “material uncertainty over their ability to continue as a going concern over the next 12 months”. Given PureGym’s strong financial position & financial covenant relaxation, there is no
       material uncertainty over PureGym’s ability to continue as a going concern in the opinion of its Directors

                                                                                                                                                                                                                                                                                                  Investor Presentation 21 April 2021 4
Investor Presentation - COVID-19 update & Results for the full year ended 31 December 2020 - PureGym
COVID-19 Update
56% of the estate is now open, with remaining sites likely to be open by mid-May
                                                                         Investor Presentation 21 April 2021 5
Investor Presentation - COVID-19 update & Results for the full year ended 31 December 2020 - PureGym
Introduction & Overview                  COVID-19 update                  Cash flow & liquidity                  Financial performance      Outlook     Conclusion   Appendix

           Fully open estate across all geographies expected by mid-May1

                                                                                                 Status 20th Apr                        Jan              Feb              Mar         Apr             May          June
                                                                                                 Sites open/total sites:
                                                  England                                                240/245                                                                      12th

                                                  Scotland                                                   0/25                                                                            26th

                                                  Wales                                                       0/5                                                                                   3rd

                                                  N. Ireland                                                  0/8                                                                                     10th

                                                  Denmark                                                   0/179                                                                                    TBC

                                                 Switzerland                                               40/40                                                                            19th

                                                                                                         280/502                                 Lockdown / gyms closed                             Gyms open2

Notes:
1.     Based on our best estimate having considered the latest government guidance in each of the geographies in which we operate
2.     Subject to certain reopening restrictions, which differ by geography

                                                                                                                                                                                                                 Investor Presentation 21 April 2021 6
Investor Presentation - COVID-19 update & Results for the full year ended 31 December 2020 - PureGym
Introduction & Overview           COVID-19 update       Cash flow & liquidity           Financial performance    Outlook      Conclusion     Appendix

In the UK – the Group’s key profit engine – vaccination is
progressing very well & we are proud that PureGym has played
a small part in this
UK vaccination programme is well advanced                                                UK is doing better than pretty much all other                     PureGym is proud to be
                                                                                         countries                                                         playing its part in the roll out
Cumulative vaccination doses administered (million)                                      Cumulative vaccination doses administered per 100 residents (%)

                                                                         First dose

                                                                          Second dose

                          Firs t Dose               Secon d Dose

Source: Gov.uk analysis                                                                    Source: Financial Times analysis                                PureGym Nuneaton: COVID-19 vaccination
                                                                                                                                                           centre

                                                                                                                                                                          Investor Presentation 21 April 2021 7
Investor Presentation - COVID-19 update & Results for the full year ended 31 December 2020 - PureGym
Introduction & Overview                 COVID-19 update   Cash flow & liquidity   Financial performance   Outlook                           Conclusion          Appendix

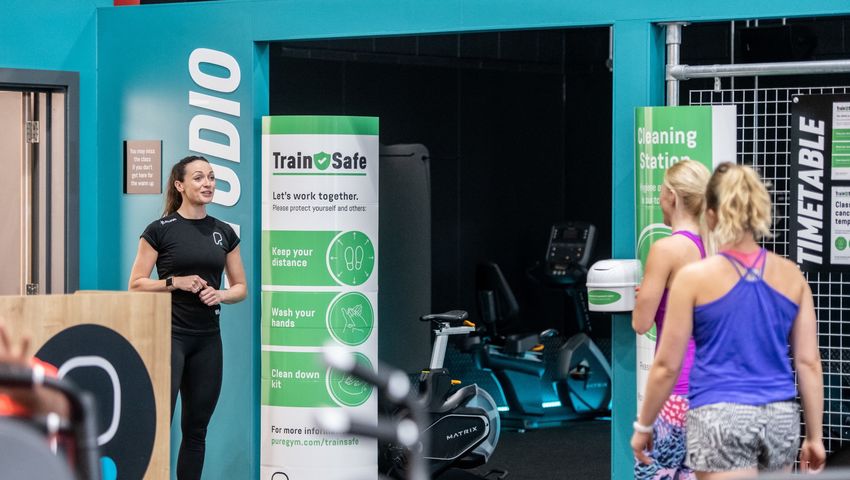
           Proven ability to operate within COVID-19 restrictions
           & manage capacity constraints well

                                                                                              Large facilities,                                                                                                               Self cleaning
                                                                                               with dedicated                                                                                                               stations coupled
                                                                                              workout areas to                                                                                                               with extensive
                                                                                               maintain social                                                                                                               staff cleaning
                                                                                                 distancing                                                                                                                      regime

                                                                                                                                                Actual usage vs potential limit (average across large box format estate1)

                                                                                              Industry leading                                      30 – 50% reduction in
                                                                                                                                                                                                                            Proven ability to

                                                                                                                           Members in the gym
                                                                                                 technology                                          maximum capacity

                                                                                                                                                                                                                              “flatten the
                                                                                              platform enables
                                                                                                 contactless                                                                                                                peak” & operate
                                                                                                                                                                                                                            within capacity
                                                                                                  entry, slot
                                                                                                bookings and                                                                                                                  constraints
                                                                                               variable pricing                                                                 Time of day

Notes:
1. Based on actual member usage data for a typical gym in 2020                                                                                                                                                         Investor Presentation 21 April 2021 8
Investor Presentation - COVID-19 update & Results for the full year ended 31 December 2020 - PureGym
Introduction & Overview   COVID-19 update   Cash flow & liquidity   Financial performance   Outlook   Conclusion   Appendix

Supporting our people
PureGym has worked hard to retain its strong culture & values                                          Virtual relay launch video still:
                                                                                                       An example of PureGym colleague engagement during lockdown
• Regular colleague communication & engagement
• Employee assistance helpline for wellbeing & financial advice
• Enhanced e-learning training platform & HR management system
• Virtual awards ceremony to recognise significant colleague achievements
• Significant investment to ensure COVID-19 safe working environment

“Shoot for the Moon” virtual relay during Q1 2021 lockdown
• Exercise based race ”to the moon & back”
• 238,855 miles in 48 days
• Improving colleague engagement, activity & mental wellbeing
• Daily posts & personal fitness achievements

• Funding provided as a gift by the partners of Leonard Green
• Hardship fund for those struggling financially as a result of the pandemic
• The Trust has supported dozens of colleagues who have faced challenging
  situations
                                                                                                                                                Investor Presentation 21 April 2021 9
Investor Presentation - COVID-19 update & Results for the full year ended 31 December 2020 - PureGym
Introduction & Overview   COVID-19 update   Cash flow & liquidity   Financial performance   Outlook      Conclusion   Appendix

Throughout 2020 & 2021 PureGym has been instrumental in
leading the presence of the industry in the UK & Europe
   Group CEO has featured                           UK MD on Instagram live with                      …. and in front of the DCMS   PureGym Group instrumental in
regularly on National TV & has                      Rishi Sunak, Chancellor of the                    Select Committee & on BBC     UK Active & Europe Active data
 appeared twice on the BBC’s                                Exchequer….                                           News                 releases on safety of the
        Question Time                                                                                                                          industry
                                                                                                                                     ”Data from 2,000 operators suggested
                                                                                                                                        the prevalence of the virus among
                                                                                                                                    visitors who had used facilities remained
                                                                                                                                    “extremely low”, at an overall rate of 1.7
                                                                                                                                    cases per 100,000 visits, measured from
                                                                                                                                     75 million visits across the UK between
                                                                                                                                             25 July to 27 December”

                                                                                                                                            Investor Presentation 21 April 2021 10
Cash Flow & Liquidity
Ample financial reserves having managed the latest lockdown extremely well
                                                                     Investor Presentation 21 April 2021 11
Introduction & Overview                  COVID-19 update                  Cash flow & liquidity                   Financial performance                     Outlook   Conclusion          Appendix

          Q1 2021 cash flow & liquidity position
          Unaudited liquidity evolution (13 weeks)

                                                  £236m1                                                                                                                                                             £39m                  £231m1

                                                                                            £31m                                                                                               £11m
                                                      91                                                                                                                                                                                      86
                                                                                                                                   £16m
     £37m of deferred                                                                                                                                                    £8m                                                                                 £41m of deferred
      payments (net)                                                                                                                                                                                                                                         payments (net),
     outstanding as at                                                                                                                                                                                                                                     comprising £47m of
       31 December                                                                      Net                                                                                                                                                                 deferred payments
                                                                                                                                                                                         Surrender                   Bond
           2020                                                                                                                                                                                                                                            outstanding & £6m
                                                                                    operational                                                                                           premium                  proceeds                                   of Government
                                                                                   burn of £2.4m                                                                                        received on                received                               receipts due as at 31
                                                                                   per week after                                                                                      exit of a site            (net of issue                                 March 2021
                                                     145                                                                                                                                                                                      145
                                                                                    Government                                                                                                                      costs)
                                                                                      support

                                            Liquidity
                                              Liquidityat                         Operational                                   Interest                      Capex, Working              Property                 Bond Tap             Liquidity
                                                                                                                                                                                                                                          Liquidityat
                                           at31-Dec-20
                                              31-Dec-20                              Burn                                                                    Capital Movement             Receipt                                      at31-Mar-21
                                                                                                                                                                                                                                          31-Mar-21
                                                                                                                                                                  & Other 2             (net of VAT)
Notes:
1. Liquidity includes Cash, undrawn Revolving Credit Facility commitments (incl £10m overdraft) & is subject to a £30m minimum liquidity test at prescribed intervals
                                                                                                                                                                                                                            Available Facilities               Cash
2. Includes committed capex, increase in deferred payments, working capital timings & small revenue collections

                                                                                                                                                                                                                                         Investor Presentation 21 April 2021 12
Introduction & Overview                  COVID-19 update                  Cash flow & liquidity                 Financial performance       Outlook      Conclusion   Appendix

             Q1 2021 underlying weekly cash burn
             Underlying operational cash burn 40% better than lockdown 1
                               Average weekly cash burn (14 weeks) – Lockdown 1 (Q2 2020)
                               £m                                                                                                                                    • £2.4m per week underlying operational burn during
                                   Unmitigated                                       Mitigation activity                                    Underlying
                                                                                                                                                                       lockdown 3:
                                   operational
                                                                         Government                       Operational cost
                                                                                                                                            operational                   ‒ 20% better than the Target previously announced
                                      burn                                                                                                     burn
                                                                           support                         compression                                                    ‒ 40% better than in lockdown 1
                                                                                                                                                                     • Capex in Q1 2021 was reduced to preserve liquidity
                                                                                                                                               (4.0)
                                                                                                                    1.8                                              • Successful bond raise and property receipt reduced
                                         (8.0)
                                                                               2.2                                                                                     overall cash burn to £0.4m per week

                               Average weekly cash burn (13 weeks) – Lockdown 3 (Q1 2021)
                               £m
                                   Unmitigated                                    Mitigation activity                                       Underlying         Capex, Working        Finance      Bond tap &               Actual total
                                   operational                                                                                              operational       Capital Movement      charges 2   Property receipt            cash burn
                                      burn                            Government                        Operational cost                       burn               & Other 1                                              (incl. financing)
                                                                        support                          compression
                                                                                                                                                                                                      3.8                     (0.4)
                                                                                                                                               (2.4)
                                                                                                                   3.1
                                                                                                                                                                    (0.6)
                                                                                                                                                                                      (1.2)
                                                                               2.5
                                        (8.0)

Notes:
1.     Includes committed Capex, Working Capital timings and small revenue benefits                                                                                                                                Investor Presentation 21 April 2021 13
2.     Based on payments falling due in the 13 week lockdown period. Average weekly finance cost across the year is £1.0m per week
2020 Financial Performance Update
Results materially impacted by COVID-19, with just 63% of open trading days vs 2019
                                                                       Investor Presentation 21 April 2021 14
Introduction & Overview                   COVID-19 update                  Cash flow & liquidity                   Financial performance                     Outlook   Conclusion     Appendix

            Group results FY 2020
         Revenue &                                                              Adjusted                                                                Group                                    Cash flow &            Senior Secured
         membership                                                             EBITDA                                                                  estate                                   liquidity              Net Debt
        Closing members                                                         Adj EBITDA                                                              Gyms in estate                           Available liquidity    SS Net Debt
        1.5m at Dec 2020                                                        £11m FY 2020                                                            492 at Dec 2020                          £236m at Dec 2020      £734m at Dec 2020
        1.7m at Dec 2019                                                        £132m FY 2019                                                           504 at Dec 2019                          £112m at Dec 2019*     £745m at Dec 2019

         Revenue                                                               Run Rate Adj EBITDA                                                       New organic gyms                        Operating cash flow
         £270m FY 2020                                                         £38m FY 2020                                                              17 FY 2020                              £11m FY 2020
         £447m FY 2019                                                         £161m FY 2019                                                             41 FY 2019*                             £101m FY 2019

                                                                                                                                                        Capex
                                                                                                                                                        £64m FY 2020
                                                                                                                                                        £92m FY 2019

Notes:
2020 represents the results of the Combined Group, including Fitness World from 14 January 2020
2019 includes the results of Fitness World on a pro forma basis, except for new organic gyms and available liquidity which is based on PureGym UK only (indicated by *)

                                                                                                                                                                                                                       Investor Presentation 21 April 2021 15
Introduction & Overview                COVID-19 update                 Cash flow & liquidity                 Financial performance                   Outlook           Conclusion      Appendix

          Strong bounce back when the business was allowed to operate
          Government COVID-19 legislation forced the group to close for an average of 37% of the trading days in 20201
                                                                                                                                                                                                                                                                  Trading
                                                                                                                                                                                                                                                                     days
                         No. of gyms 31’Dec                          Jan                   Feb                 Mar                   Apr                 May               Jun           Jul        Aug          Sep         Oct           Nov         Dec          lost1
                           England                    236                                                                 21st                                                                   25th                                    5th                         44%
                           Scotland                      25                                                               21st                                                                                 31st                                        26th      49%

                           Wales                          5                                      5/5                      21st                                                                          10th                        23rd 9th               20th      47%

                           N. Ireland                     8                                      8/8                      21st                                                            10th                                                             26th      37%

                           Denmark                    179                                                           12th                                                     11th                                                                        9th         31%

                           Switzerland 39                                                                            16th                                  11th                                                                                           22nd       19%

                                                                                                                        Lockdown / gyms                                                                                             Partial lockdown / severe        37%
                                                     492                                                                     closed
                                                                                                                                                                              Partial lockdown                   Gyms open                  restrictions
                                                       15

                                                                                                                                                                                                        8.2      8.9
                                                       10                                12.7
                                                                                                                                                                                                                              7.1
                                                                        9.5
                                                         5
                                                                                                                 (0.6)
                         Adjusted                         -
                                2
                         EBITDA (£m)                                                                                                                                       (3.1)
                                                                                                                                                                                        (0.8)                                                (4.9)       (6.7)
                                                        (5)
                                                                                                                                      (8.3)              (9.1)
                                                      (10)
Notes:
1. Weighted average based on the number of trading days lost on a gym by gym basis
2. Adjusted EBITDA is per management accounts and shown for the Combined Group on a proforma basis, as if Fitness World was acquired on 1 January 2020

                                                                                                                                                                                                                                      Investor Presentation 21 April 2021 16
Introduction & Overview                   COVID-19 update                   Cash flow & liquidity                   Financial performance                       Outlook                 Conclusion                   Appendix

           Strong member retention despite lockdowns
         Memberships being switched back on as gyms reopen                                                                                                                              Total group membership levels

         • Healthy member retention:                                                                                                                                                                                                                                                      Illustrative3
                                                                                                                                                                                                   1.7m                                 94%                 82%
                    ‒ Only 87k member reduction since December 20201                                                                                                                                  0.08
                                                                                                                                  1
         • 1.4m total group membership as at 31 March 2021 :                                                                                                                                                                             1.5m               1.4m
                                                                                                                                                                                                      0.49                                 0.08
                                                                                                                                                                                                                                                              0.07
                    ‒ 82% of December 2019 pre-COVID (on a proforma basis)
                    ‒ England reopened at 66% of 2019 on a LFL paying member basis2                                                                                                                                                        0.41               0.40
         • Solid member base from which to rebuild:
                    ‒ Younger members have a higher propensity to return
                    ‒ Median member age is 28 UK, 30 DK & 31 CH
                                                                                                                                                                                                      1.14
                    ‒ New gym openings in 2020 show that underlying demand remains                                                                                                                                                         0.97               0.94
                      strong
                    ‒ Pent up joiner demand due to lockdown
         • Revenue "turns back on" when gyms reopen
                                                                                                                                                                                                   Dec-19                               Dec-20             Mar-21             Jun-21             Sep-21            Dec-21

                                                                                                                                                                                                                             UK           Denmark                Switzerland                Illustrative3
Notes:
1. Total reported Group members (including frozen members)
2. Based on LFL clubs & excluding frozen members
3. By their nature, illustrative projections are forward-looking statements that involve risks and uncertainties because they relate to events, depend on circumstances that may or may not occur in the future and are based on a number of assumptions that are themselves subject to inherent uncertainties and risks

                                                                                                                                                                                                                                                                                              Investor Presentation 21 April 2021 17
Introduction & Overview                  COVID-19 update         Cash flow & liquidity   Financial performance   Outlook        Conclusion   Appendix

           2020 Capex
             Significant reduction in capital expenditure to preserve liquidity                                                        Group capital expenditure

            • 17 new sites opened in 2020
                                                                                                                                          £m                                           20191       2020
                ‒ 12 in the UK                                                                                                            Expansionary capital expenditure              59.8        44.1
                ‒ 5 in Denmark                                                                                                            Maintenance & refurb capital expenditure      32.2        20.1
            • 4 major refurbishments in 2020 (1 in Denmark & 3 in UK)                                                                     Total capital expenditure                     92.0        64.2
                                                                                                                                                                                      c.30% reduction in
            • 11 sites closed in Denmark as part of a planned estate quality                                                                                                          capital expenditure
              improvement programme                                                                                                                                                   across the group in
                                                                                                                                                                                       2020 to preserve
            • Despite the pandemic we have also continued to invest in our                                                                                                                  liquidity
              technology team, systems & infrastructure for the long term:
                      ‒ Progressed a group wide technology platform
                      ‒ Expanded content on our free app with over 400
                        pre-recorded workouts & classes
                      ‒ Launched exclusive live daily classes, workouts, nutrition &
                        wellbeing digital content

Notes:
1. FY19 is stated on a proforma basis for the acquisition of Fitness World

                                                                                                                                                                                     Investor Presentation 21 April 2021 18
Introduction & Overview                 COVID-19 update                 Cash flow & liquidity                 Financial performance                     Outlook                Conclusion                  Appendix

           Year end Net Debt £734m following a £100m equity injection
             Leverage: Senior Secured Net Debt1 / RR adj. EBITDA
    Standalone PureGym: a track record of deleveraging                                                                                                                                         Pro Forma (Combined Group)                                             Q4’20 Net Debt (Combined Group)

                        Organic deleveraging                                                                               Organic deleveraging                                                  Illustrative Q4’20A Senior Secured leverage                               As at 31 December 2020                     £m
                                                                                                                                                                                                   is based on £161m RR Adj. EBITDA as at
                                                                                                                                                                                                               Dec-19 Pro-Forma                                             Cash                                      91
                                      A                                           B                                                     C
                                                                                                                                                                                                                                                                            Senior Secured Sterling Notes 6.375% (430)
                                                                                                                                                                                                                      4.6x 4             4.6x 5                             Senior Secured EUR Notes 5.5%           (395)
        4.6x 2
                          4.3x
                                            4.0x              3.8x              4.0x              3.9x              3.9x                                                                                                                                                    Senior Secured Net Debt                 (734)
                                                                                                                                      3.7x              3.7x              3.6x
                                                                                                                                                                                                                                                                            Non-property leases                      (20)
                                                                                                                                                                                                                                                                            Total Net Debt                          (754)

                                                                                                                                                                                                                                                                            FY19 Pro Forma RR Adj EBITDA             161
                                                                                                                                                                                                                                                                            Illustrative leverage 5                  4.6x
                                                                                                                                                                                                                                                                                                                        6

         Nov               YE                Q1                Q2                Q3                YE                Q1                Q2                Q3                YE                                      YE ’19A             YE ‘20A
        '17A              '17A              '18A              '18A              '18A              '18A              '19A              '19A              '19A              '19A                                    Pre-COVID          Post Equity
                                                                                                                                                                                                                                      Injection

                                                                                                                                                                                               SS Net Debt £745m                        £734m
             Q1 2018: £360m SSN placing                                  Q3 2018: £30m SSN
      A     by Leonard Green & Partners for                     B        placing to finance the                      C Q2 2019: £40m bond tap3                                                  Liquidity 6         £160m               £236m
              the acquisition of PureGym                               acquisition of Soho Gyms

Notes: All years stated under IFRS; December year end.
1. Senior secured net debt defined as total senior indebtedness (excl. finance leases & supply chain financing) less cash & cash equivalents
2. Net leverage based on LTM Sep-17A Run-rate Adj. EBITDA of £78.6m, pro-forma for the acquisition by LGP
3. Proceeds not used & remained as cash on the balance sheet
4. Based on Dec-19A Senior Secured Net Debt of £745m (consisting of the Sterling Notes (£430m), the Euro Bridge Facility (£380m, converted using FX rate of EUR 1.1711 to £1) less cash (£65m) & including certain adjustments) & Dec-19A Pro-forma Run-Rate Adj. EBITDA of £161m
5. Based on Dec-20A Senior Secured Net Debt of £734m (consisting of the Sterling Notes (£430m), the Euro Notes (£395m, converted using FX rate of EUR 1.1268 to £1) less cash (£91m)) & Dec-19A Pro-forma Run-Rate Adj. EBITDA of £161m
6. Liquidity defined as cash plus available RCF facilities

                                                                                                                                                                                                                                                                                    Investor Presentation 21 April 2021 19
Outlook
Positive about the post COVID-19 market dynamics for PureGym
                                                               Investor Presentation 21 April 2021 20
Introduction & Overview   COVID-19 update   Cash flow & liquidity   Financial performance   Outlook        Conclusion      Appendix

Members are keen to get back to the gym & to take advantage
of the “sharing economics” of our facilities
Health & fitness is now more important than ever                                               Home fitness is not a long-term replacement for gyms for
• Health is currently at the forefront of consumers’ minds                                     most people
• Increased awareness of the importance of wellness &                                                            Wave 1                    Wave 1
  mindfulness, with fitness a core element                                                      100              Starts                    Ends

• Gyms help people of all ages to achieve better physical &
  mental health                                                                                  75

                                                                                                                                                     Online fitness returns to +/-
• Digitisation of exercise & availability of fitness                                             50
                                                                                                                                                     normal levels swiftly
  technology driving higher engagement
                                                                                                 25
Gyms are early players in the “sharing economy”
• Member buys the right to access for a 30-day period                                             0
• Typically a member “rents” their space in the gym for 2-8                                           Dec 2019             Apr 2020                 Aug 2020
                                                                                                          Online Fitness      Online Workouts         Online Exercise Classes
  hours per week / 8-24 hours per month
• Given average price of £20 per month…                                                        • Whilst google searches for online workouts increased by 300-400%
                                                                                                 at the height of the pandemic, they are now only 3-4% higher than
• This represents £1-£3 per hour of activity – great value!
                                                                                                 pre-pandemic levels
  …and much cheaper than trying to replicate this at home
                                                                                               • Home fitness equipment is expensive & not accessible to all
• Plus the member enjoys the benefit of getting out of
  home, being in a safe environment, socialising etc                                           • A member might use £15k-£25k worth of kit (treadmill, bike, lifting
                                                                                                 platform, dumbbells etc) on a visit to a gym
                                                                                                                                                                  Investor Presentation 21 April 2021 21
Introduction & Overview   COVID-19 update   Cash flow & liquidity     Financial performance    Outlook       Conclusion   Appendix

Continued investment in technology sets us up for success
  Integrated club & home fitness                                     Enhanced capabilities in response to                            Optimised data analytics to enhance
  services                                                           the pandemic                                                    the customer experience
                                                                    Tools to support members in timing visits, booking
           Live & on demand classes                                 slots & contactless entry                                         1   Best in class reporting

                                                                                                                                      2   Performance management

                                                                                                                                     ü    Business insights for commercial value
                                                                                                                                          (e.g. pricing, product, marketing)
   Nutritional advice         Progress tracking                     “Live” feeds of attendance & member feedback for
                                                                    monitoring & control                                             ü    Smarter business decision making

                                                                                                                                     ü    Optimises customer lifetime value

                                                                                                                                     ü    Extends core competitive advantage

                                                                                                                                                             Investor Presentation 21 April 2021 22
Introduction & Overview   COVID-19 update   Cash flow & liquidity   Financial performance   Outlook   Conclusion   Appendix

Favourable market dynamics fuel our optimistic outlook
 1     Large global gym operators have tackled COVID very effectively
       ‒ Operators have held membership through the pandemic
       ‒ Recovery in utilisation has been very rapid when gyms have been able to open
       ‒ Cost management has reduced cash burn to very low, manageable levels; many landlords have accepted revised lease terms
       ‒ Health & safety record has been worthy of note, with very little evidence to suggest COVID transmission in gyms
 2     Medium to long-term outlook is very strong for strong businesses like PureGym that will survive
       ‒ Health & fitness remains a key trend across all age groups & demographics, we believe this will be intensified by COVID
       ‒ Propensity to return to the gym when open remains very strong
       ‒ Sector has seen some supply rationalisation as smaller, less well capitalised operators have failed
       ‒ Significantly improved availability of new units on attractive lease terms as the whole retail sector has weakened
       ‒ Challenging economic outlook will favour high volume, low price operators offering flexibility & great value
 3     Digital engagement with members is value enhancing & here to stay
       ‒ Digital fitness trends have accelerated during the pandemic e.g. live on-demand classes, contactless access, virtual coaching
       ‒ Presents an opportunity to extend engagement into new areas e.g. nutrition, mindfulness/meditation
       ‒ Members now wanting to connect outside of the gym environment
       ‒ Ability for gym operators to control the health & fitness journey represents a huge opportunity
       ‒ Only scale players will be able to afford the investments necessary in technology and digital
                                                                                                                              Investor Presentation 21 April 2021 23
Introduction & Overview   COVID-19 update   Cash flow & liquidity   Financial performance   Outlook         Conclusion    Appendix

     We continue to see the emergence of a global “Premier League”

                                                                                                            500+    sites
                                                                                                             500+ Sites
                                                                                                                               “We expect low cost gyms to take share [as a result of the COVID-19
                                                                                                                               pandemic]”

                                                                                                                               “We expect well invested & well capitalized low cost gyms to prosper in
                                                                                                                               a potentially recessionary & less competitive environment”

                                                                                                                               “We believe their value proposition has become more compelling, with
                                                                                                                               the hybrid facility & digital model coming to the fore, which could
                                                                                                                               translate into larger membership bases”

                                                                                                                               “In contrast, premium facilities we expect to suffer from down trading
                                                                                                                               & more limited ancillary services (PT, classes, physio etc.) in the near
2,000+
 2,000+ Sitessites                                                                                                             term”

                                                                                                                               “Mid-market has been squeezed in previous years & we expect to feel
                                                                                                                               the balance sheet strain preventing significant investment”

    700+ sites
          700+ Sites

                                                                                 700+     sites
                                                                                 700+ Sites
                                                                                                                                                                                        August 2020

                                                                                                                                                                     Investor Presentation 21 April 2021 24
Introduction & Overview                   COVID-19 update                  Cash flow & liquidity                   Financial performance                      Outlook                 Conclusion              Appendix

           Our pre-COVID track record speaks for itself
           Gyms (number)1                                                                                                     Members (k)1                                                                                           Revenue (£m)
                                     +15.7% CAGR                                                                                                     +11.5% CAGR                                                                              +16.8% CAGR
                                                                                                504                                                                                                            1,724                                                          447

                                                                                                                                                                                            1,135
                                                                             263                                                                        927
                                                                                                                                                                         1,012                                                                                     255
                                                                                                                                    818                                                                                                                228
                                                          222                                                                                                                                                                                 198
                   170                192                                                                                                                                                                                              160

                  2016A              2017A              2018A              2019A             2019PF                                2016A              2017A              2018A              2019A             2019PF                  2016A   2017A   2018A       2019A     2019PF

           Adjusted EBITDA (£m)2                                                                                              RR Adjusted EBITDA (£m)3                                                                               Op FCF conversion (%)4
                                     +23.7% CAGR                                                                                                         +14.5% CAGR
                                                                                               132                                                                                                               161
                   30%               36%                36%                 35%
                                                                                                                                                                                                                                                      102%
                                                                                                                                                                                                                                              94%
                                                                             89                                                                                                               105                                                                 87%
                                                          81                                                                                                                95                                                         78%                                    77%
                                       71                                                                                                                85
                                                                                                                                      70
                    47

                 2016A              2017A              2018A              2019A             2019PF                                 2016A              2017A              2018A              2019A             2019PF                  2016A   2017A   2018A       2019A     2019PF

Notes: All years stated under IFRS; for 12 months ended 31 December & relate to PureGym only, except where shown as proforma for the acquisition of Fitness World
1 2016A-2019A gyms includes PureGym branded sites at year-end (excludes unconverted LAF and Soho sites). # of members excludes pre-opening members and members at unconverted LAF and Soho gyms
2 Adj. EBITDA is before pre-opening costs & adjusted for non-cash expenses
3 Calculated as Adj. EBITDA plus immature units (open for less than 36 months) EBITDA at maturity less actual contribution of immature units
4 Op. FCF calculated as Adj. EBITDA less maintenance, refurb, & corporate capex & change in NWC, but before expansion capex. Operating cash flow conversion is calculated as operating cash flow divided by Adj. EBITDA

                                                                                                                                                                                                                                                      Investor Presentation 21 April 2021 25
Conclusion
             Investor Presentation 21 April 2021 26
Introduction & Overview       COVID-19 update   Cash flow & liquidity   Financial performance   Outlook   Conclusion   Appendix

Conclusion
          1        2020 results materially impacted by COVID-19 with only 63% trading days vs 2019

                   2          Clean audit opinion for 2020 with no material uncertainty over going concern

                          3       Excellent liquidity position, £231m available as at 31 March 2021, post successful bond tap

                          4        1.4m members retained as at 31 March 2021 with revenue "turning back on" as sites reopen

                          5       Immediate focus on a successful reopening of the business

                   6          Encouraging reopening in England & Switzerland, with the rest of the estate expected to open by mid-May

          7        Many reasons to be positive about the post COVID-19 outlook for PureGym

                                                                                                                                  Investor Presentation 21 April 2021 27
Appendix
           Investor Presentation 21 April 2021 28
Introduction & Overview                  COVID-19 update                  Cash flow & liquidity                Financial performance      Outlook   Conclusion   Appendix

          Q1 2021 lockdown government support
          Government support extended (but only covers 31% of PureGym Group operational outgoings1)

        Geography                       Support                                                                     Mitigation              Total Q1 2021      Comments
                                                                                                                   (£m/week)                    (£m)

                                        Furlough                                                                          0.4                      5.5         Extended at a level in line with prior lockdowns

        UK                              Business rates                                                                    0.4                      4.8         Rates holiday extended, capped at £2m in total post June 2021

                                        Property grants                                                                   0.3                      4.0         New Q1 2021 lockdown & reopening grants

                                        Furlough                                                                          0.5                      6.6         Extended at a level in line with prior lockdowns
        Denmark
                                        Fixed overhead compensation                                                       0.8                     10.0         Extended at a level in line with prior lockdowns

                                        Furlough                                                                          0.1                      1.4         Extended at a level in line with prior lockdowns
        Switzerland
                                        Fixed overhead compensation                                                       0.1                      0.6         New Q1 2021 lockdown support

        Total                                                                                                             2.5                     32.9 2
Notes:
1. Based on £8m of unmitigated operational cost burn, excluding interest
2. As at 31 March 2021, £27m has been received in the quarter, with the remaining £6m due to be received in April / May

                                                                                                                                                                                                       Investor Presentation 21 April 2021 29
Introduction & Overview                          COVID-19 update           Cash flow & liquidity         Financial performance           Outlook         Conclusion          Appendix

           New site openings in 2020 show latent demand remains
           strong & accessible
            UK gyms1 opened since 25 July 2020
            Member levels vs targeted average

                                              110.0%

                                              100.0%

                                               90.0%

                                               80.0%
                  % of mature member target

                                               70.0%

                                               60.0%

                                               50.0%

                                               40.0%

                                               30.0%

                                               20.0%

                                               10.0%

                                                0.0%                                                                                                                                                                                       No. of
                                                       (8)      (7)     (6)        (5)        (4)      (3)     (2)        (1)    Open        1        2        3       4          5     6       7    8        9        10   11      12     weeks

                                                        Gym 1                  Gym 2                 Gym 3               Gym 4               Gym 5                 Gym 6              Gym 7         Targeted Average          Avera ge
Notes:
1. Bank has been excluded as it is a London city centre gym.

                                                                                                                                                                                                                            Investor Presentation 21 April 2021 30
Introduction & Overview                  COVID-19 update                  Cash flow & liquidity                 Financial performance                       Outlook              Conclusion          Appendix

           £236m of available liquidity to manage ongoing disruption &
           payment deferrals at end of December 2020
           Actual liquidity development & unaudited December 2020 position

                     £297m1                                                                                                                                                                                                                                                    An additional
                                                                     £1m               £278m1                    £3m                                                                                                                                                             £37m of
                                                                                                                                                                               £266m1                                              One off cash outflows                       deferrals are
                                              £20m                                                                                    £3m                                                                                                                                        due to be
                                                                                                                                                            £12m                                                                                                              settled in 2021
                                                                                                                                                                                                                                                               £236m1
                                                                                                            Group EBITDA                                Settlement of                              £17m            £2m
                         152                                                                                less interest                                  deferred
                                                                                                                                                                                                                                   £8m             £3m
                                                                                           133                    &                                     payments from              121
                                                                                                            maintenance                                  Q2 lockdown                            Group EBITDA
                                                                                                               capex                                                                                                                                              91
                                                                                                                                                                                                less interest
                                                                                                                                                                                                      &
                                                                                                                                                                                                maintenance
                                                                                                           Positive underlying                                                                     capex
                          37                                                                37              Group cash flow                                                                                                                                                      Ample liquidity
                                                                                                                                                                                                                                                                                 from which to
                                                                                                                                                                                               Reflects impact                                                                  absorb the 2021
                                                                                                                                                                                                  of 4 week                                                                       Q1 lockdown
                                                                                                                                                                                   135           England &                                                       135
                                                                                                                                                                                                    Danish
                          98                                                                98                                                                                                   lockdowns

                          10                                                                10                                                                                     10                                                                             10
                      Proforma           Interest paid          8 week net             Proforma             Sept & Oct               Growth           Settlement of           Liquidity at      Nov & Dec        Growth       Exceptional     Settlement of   Unaudited
                     liquidity at                                cash flow            liquidity at          Cash Flow                capex               deferred             30-Oct-20         Cash Flow        capex          items            deferred     liquidity at
                     30-Jun-20                                 (before interest)      28-Aug-20                                                         payments                                                                                payments      31-Dec-20

                                                                                      Undrawn Overdraft                                 Undrawn RCF                                      Cash (Drawn RCF)                   Cash
Notes:
1. Liquidity includes Cash, undrawn Revolving Credit Facility commitments & undrawn Overdraft commitments & is subject to a £30m minimum liquidity test at prescribed intervals.

                                                                                                                                                                                                                                                           Investor Presentation 21 April 2021 31
Introduction & Overview   COVID-19 update   Cash flow & liquidity   Financial performance      Outlook        Conclusion     Appendix

Group cash flow FY 2020
                                                                                                                                        Quarter ended 31 Dec     12 months ended 31 Dec
Cash flow impacted by COVID-19                                                        (£m)                                                 2020       2019          2020         2019
• Group Adjusted EBITDA impacted by closure                                           Group Adjusted EBITDA                                   (5)        23             11          89
• Maintenance & refurbishment capital expenditure                                     Movement in working capital                             (4)          8            10           4
  includes 4 major site refurbishments in 2020                                        Maintenance & refurb capital expenditure                  4        (7)          (10)        (15)
                                                                                      Group operating cash flow                               (5)         24            11          78
• Operating cash flow conversion optimised through swift                              Operating cash flow conversion                         88%      103%           103%         87%
  management action
                                                                                      Expansionary capital expenditure                       (15)      (24)           (37)        (52)
• £37m expansionary capex reflects 17 new organic gyms                                Exceptional items                                       (1)       (2)           (14)         (4)
  opened in 2020 & relates to a number of partially                                   Tax, interest, & debt issue costs                      (21)       (0)           (70)        (27)
  developed sites ahead of reopening post lockdown 3.0                                Other                                                     1       (2)             16         (4)
• Exceptional items comprise mainly transition &                                      Net cash flow before acquisition & financing           (41)       (4)           (93)         (9)
  integration costs relating to the Fitness World                                     Net investment in Fitness World                           -        (3)         (226)          (3)
  acquisition                                                                         Acquisition finance                                       -          -           263            -
                                                                                      RCF (repayment)/borrowing                              (37)          -              -           -
• Acquisition financing includes €445m SS bridge loan
                                                                                      Issue of senior secured notes                             -          -              -         41
  (c.£381m) received in Q1’20 to finance the acquisition
  of Fitness World, net of £118m repayment of Fitness                                 Finance lease capital repayments                        (1)        (1)            (6)         (1)
  World debt                                                                          Equity injection                                          1          0           101            -
                                                                                      Other financing cash flows                              (1)          0            (0)           0
• Net investment in Fitness World represents the cost of                              Net cash flow                                          (78)        (8)            38           28
  investment of £233m, net of £7m cash acquired
                                                                                                                                                       Investor Presentation 21 April 2021 32
Introduction & Overview                   COVID-19 update                  Cash flow & liquidity                  Financial performance                  Outlook    Conclusion    Appendix

           Segmental performance
                                                                                                                              Pro forma basis (£m)                                                                 Reported basis (£m)

                                                                                    Quarter ending 31 December                                        12 months ending 31 December           Quarter ending 31 December         12 months ending 31 December
                                                                                     2020              2019 Change %                                      2020        2019 Change %          2020        2019 Change %            2020       2019 Change %
          PureGym UK                                                                     38               66              (43)%                            142         255     (44)%           38         66     (43)%            142         255        (44)%
          Fitness World                                                                  35               49              (28)%                            135         193     (30)%           35          -        n/a           128           -           n/a
               Denmark                                                                   29               40              (28)%                            109         159     (31)%           29          -        n/a           103           -           n/a
               Switzerland                                                                7                7               (1)%                             25          27      (7)%            7          -        n/a            24           -           n/a
               Poland                                                                     -                2                                                 -           7                      -          -        n/a             -           -           n/a
          Total Revenue                                                                  73             115               (37)%                            277          447    (38)%           73         66      11%             270         255           4%

          PureGym UK                                                                      0               23             (99)%                                7          89     (92)%           0         23     (99)%               7          89       (92)%
          Fitness World                                                                  (6)              12            (146)%                                5          43     (88)%          (6)         -        n/a              4           -          n/a
               Denmark                                                                   (5)              11            (149)%                                6          38     (85)%          (5)         -        n/a              4           -          n/a
               Switzerland                                                               (0)               1            (106)%                               (0)          3    (105)%          (0)         -        n/a             (0)          -          n/a
               Poland                                                                      -               1                                                   -          1                      -         -        n/a               -          -          n/a
          Total Adjusted EBITDA                                                          (5)              35           (115)%                                12        132      (91)%          (5)        23    (123)%              11          89       (88)%

          PureGym UK                                                                   1%               35%                                                 5%          35%                     1%       35%                        5%         35%
          Fitness World                                                             (16)%               25%                                                 4%          22%                  (16)%         -                        3%            -
               Denmark                                                              (18)%               26%                                                 5%          24%                  (18)%         -                        4%            -
               Switzerland                                                           (1)%               14%                                               (1)%          12%                   (1)%         -                        0%            -
               Poland                                                                   -               24%                                                  -          16%                      -         -                         -            -
          Adjusted EBITDA margin                                                      (7)%              30%                                                  4%         29%                   (7)%       35%                        4%         35%

Notes:
1. The 2020 results of Poland have been excluded as the business was sold in the year and is treated as a discontinued operation in the Group financial statements                                                            Investor Presentation 21 April 2021 33
Introduction & Overview                  COVID-19 update                  Cash flow & liquidity                  Financial performance                       Outlook                 Conclusion                  Appendix

Corporate structure
                                                                                                                                                   LGP                                         Management

                                                                                                                                                                Pinnacle Topco Limited

                                                                                                                                                              Pinnacle Midco 2 Limited
                                                                             Restricted Group

                                                                                                                                                                                                                      £430m GBP Senior Secured Notes
                                                                                  £400m1 EUR Senior Secured Notes                                                  Pinnacle Bidco plc
                                                                                                                                                                                                                      Undrawn £145m GBP Revolving Credit Facility

                                                                                                                                                                  Gym Topco Limited

                                                                                                                                                                   Gym Midco Limited

                                                                                                                                                                 Gym Midco 2 Limited

                                                                                                                                                                   Gym Bidco Limited
                         Key:
                                                                                                                                                                    PureGym Limited
                                 Indirect Holdings
                                 Issuer
                                 Trading Entity                                                                                                                                                                            Pinnacle Europe Holdings
                                                                                                            US Subsidiaries                                          UK Subsidiaries
                                                                                                                                                                                                                                    Limited
                                 Guarantors
                                 Non-Guarantors                                                                                                                                                                              Fitness World Group2,3

1. EUR denominated €445 million Senior Secured Notes (converted to pounds sterling at the 31 December 2020 closing rate of €1.1128 to £1.0000)
2. The parent entity of Fitness World Group is Forward TopCo A/S
3. Material Danish and Swiss entities within the Fitness World Group have joined the material UK entities as Guarantors of the Senior Secured Notes and RCF. The Guarantors accounted for 98% of Group Run-Rate Adjusted EBITDA for the year ended 31 December 2020, and substantially all of the Group’s total assets as of 31
   December 2020

                                                                                                                                                                                                                                                                              Investor Presentation 21 April 2021 34
Introduction & Overview                  COVID-19 update                  Cash flow & liquidity                   Financial performance                      Outlook                 Conclusion                  Appendix

           Key performance indicators
                                                                                                                                                             Quarter ended 31 December                                      12 months ended 31 December
           £m                                                                                                                                                    2020A         2019A                                       2020A       2019A      2019PF
           Total number of PureGyms                                                                                                                                      274                     263                          274         263        263
           Total number of Fitness World Group Gyms                                                                                                                      218                      n/a                         218          n/a       241
           Total number of gyms                                                                                                                                          492                     263                          492         263        504
           Total number of members (‘000s)                                                                                                                             1,451                   1,135                        1,451       1,135      1,724
           Average number of members (‘000s)                                                                                                                           1,546                   1,160                        1,629       1,124         n/a
           Average number of members per gym                                                                                                                           3,052                   4,602                        3,331       4,710      3,610
           Average revenue per member per month (£)                                                                                                                    15.77                   18.84                        13.98       18.90      21.86
           Reported EBITDA (£ million)                                                                                                                                  13.0                    31.7                         87.9       125.2      209.1
           Adjusted EBITDA (£ million)                                                                                                                                  (5.3)                   22.9                         10.9        89.1      131.6
           Adjusted EBITDA margin                                                                                                                                     (7.1)%                   35.0%                         4.0%      34.9%       29.4%
           Gym Site Adjusted EBITDA (£ million)                                                                                                                           5.5                   29.0                         49.8       113.0      170.9
           Gym Site Adjusted EBITDA margin                                                                                                                              7.4%                   44.2%                       18.4%       44.3%       38.2%
           Run-Rate Adjusted EBITDA (LTM) (£ million)1                                                                                                                    n/a                     n/a                        37.7       104.5      161.2
           Operating Cash Flow (£ million)                                                                                                                              (4.6)                   23.6                         11.3        77.8      101.4
           Operating Cash Flow Conversion                                                                                                                              88.3%                  103.1%                      103.2%       87.4%       77.0%
           Senior Secured Net Debt (£ million)                                                                                                                         733.9                   378.4                        733.9       378.4      744.6
           Ratio of Senior Secured Net Debt to LTM Run-Rate Adjusted EBITDA1                                                                                              n/a                     n/a                       19.5x         3.6x       4.6x
           Ratio of LTM Run-Rate Adjusted EBITDA1 to Pro Forma Net Interest Expense                                                                                       n/a                     n/a                         0.7x        3.7x       3.1x

Note: 2020 figures represent the results of the Combined Group, including Fitness World from 14 January 2020. 2019A figures include the results of PureGym only. 2019PF figures include the combined results of PureGym and Fitness World on a pro forma basis
1.     2020 LTM Run Rate Adjusted EBITDA represents the Combined Group on a pro forma basis. The 2019PF Run Rate Adjusted EBITDA includes £4.5m of synergy benefits. Management still believe that these synergies will be delivered but, in the context of reporting on the COVID-19
       impacted year, can no longer be separated out from the underlying operations of the Combined Group

                                                                                                                                                                                                                                                                                        Investor Presentation 21 April 2021 35
Introduction & Overview                   COVID-19 update                  Cash flow & liquidity                   Financial performance                       Outlook                 Conclusion                  Appendix

           Reconciliation from Loss to Adj EBITDA & Run-Rate Adj EBITDA
                                                                                                                                        Quarter ended 31 December                                           12 months ended 31 December
           £m                                                                                                                             2020A         2019A                                             2020A       2019A      2019PF
            Loss for the year/period                                                                                                           (53.5)                   (10.6)                          (193.8)                     (26.9)                   (39.6)
            Income tax                                                                                                                          (9.4)                     3.4                            (20.8)                       3.4                      0.1
            Net finance cost                                                                                                                    13.2                     17.5                            128.5                       83.4                    114.9
            Operating loss from discontinued operation                                                                                          (0.4)                        -                            (1.8)                         -                        -
            Depreciation of property, plant & equipment                                                                                         30.3                     13.5                            113.7                       53.7                    108.9
            Amortisation of intangible fixed assets                                                                                              7.8                      0.7                             24.5                        2.9                     18.4
            Impairment of property, plant & equipment & intangible fixed assets                                                                 27.1                      0.3                             31.4                        0.3                      0.3
            (Profit) / loss on disposal of property, plant & equipment                                                                           2.5                      0.4                              2.5                        0.4                      0.2
            (Profit) / loss on lease modifications                                                                                              (0.1)                    (0.0)                            (0.1)                      (0.4)                    (0.4)
            Exceptional administrative expenses                                                                                                 (4.5)                     6.4                              3.8                        8.3                      6.2
            Reported EBITDA                                                                                                                     13.0                     31.7                             87.9                      125.2                    209.1
            Other extraordinary items                                                                                                              -                        -                                -                          -                      0.8
            Share based payment charge                                                                                                           0.1                      0.1                               0.4                       0.3                      0.3
            Pre-Opening Costs                                                                                                                   (0.0)                     1.5                              1.6                        3.5                      3.6
            Cash Rent Adjustment                                                                                                               (18.4)                   (10.4)                           (78.9)                     (39.9)                   (82.1)
            Adjusted EBITDA                                                                                                                     (5.3)                    22.9                             10.9                       89.1                    131.6
            Head office costs                                                                                                                   10.7                      6.1                             38.9                       23.9                     39.3
            Gym Site Adjusted EBITDA                                                                                                             5.5                     29.0                             49.8                      113.0                    170.9
            LTM Adjusted EBITDA1                                                                                                                 n/a                      n/a                               12.4                     89.1                    131.6
            Run-Rate Adjustment                                                                                                                  n/a                      n/a                               25.3                     15.4                     25.1
            Adjustment for synergies2                                                                                                            n/a                      n/a                                n/a                      n/a                      4.5
            Run-Rate Adjusted EBITDA (LTM)2                                                                                                      n/a                      n/a                               37.7                    104.5                    161.2
Note: 2020 figures represent the results of the Combined Group, including Fitness World from 14 January 2020. 2019A figures include the results of PureGym only. 2019PF figures include the combined results of PureGym and Fitness World on a pro forma basis
1.     2020 LTM Adjusted EBITDA represents the Combined Group on a pro forma basis
2.     The 2019PF Run Rate Adjusted EBITDA includes £4.5m of synergy benefits. Management still believe that these synergies will be delivered but, in the context of reporting on the COVID-19 impacted year, can no longer be separated out from the underlying operations of the Combined Group

                                                                                                                                                                                                                                                                                            Investor Presentation 21 April 2021 36
Introduction & Overview   COVID-19 update       Cash flow & liquidity     Financial performance            Outlook     Conclusion         Appendix

Glossary
Term                                 Definition
Adjusted EBITDA                      The profit or loss for a certain period before income tax expense, net finance cost, depreciation and impairment of property, plant & equipment & right of use assets,
                                     amortisation and impairment of intangible fixed assets, profit/loss on disposal of property, plant & equipment, profit/loss on lease modifications, exceptional administrative
                                     expenses, & other extraordinary items, after adding back Pre-Opening Costs & share based payment charges, & subtracting the Cash Rent Adjustment.
Adjusted EBITDA Margin               Adjusted EBITDA for that period divided by revenue for that period.
Average Number of Members            The average of the number of members as at the beginning of the first month & the end of every month in that period.
Average Continuous Membership        The average monthly tenure of all active & paying members, including members who have frozen their membership, as of a given point in time. This includes previous
Tenure                               memberships where the gap in membership was 30 days or less but excludes the period(s) of non-membership.
Average Initial Capital Investment   The Initial Capital Investment for all Mature Gyms for a certain period divided by the number of Mature Gyms in that period.
for Mature Gyms
Average Gym ROCE                     Gym Site Adjusted EBITDA for the relevant portfolio of gyms for that period divided by the Initial Capital Investment attributable to that portfolio of gyms.
Average Mature Gym Adjusted          Mature Gym Adjusted EBITDA for a certain period divided by the revenue attributable to Mature Gyms for that period.
EBITDA
Average Mature Gym Adjusted          Mature Gym Adjusted EBITDA for a certain period divided by the revenue attributable to Mature Gyms for that period.
EBITDA Margin
Average Mature Gym ROCE              Mature Gym Adjusted EBITDA for a certain portfolio of gyms for a certain period divided by the Initial Capital Investment attributable to that portfolio of gyms.
Average Revenue Per Member Per       Revenue for that period divided by the number of months in that period & further divided by the average number of members during that period. The average number of
Month                                members during that period is calculated as the average of the number of members as of the beginning of the first month & the end of every month in that period.
Basefit                              Refers to Basefit.ch AG, the brand that Fitness World operates under in Switzerland.
Cash Rent Adjustment                 The deduction of the cash rent payable during the period which otherwise was not reflected in EBITDA (as reported on an IFRS16 basis).
Combined Group                       Refers to Pure Gym & Fitness World.

                                                                                                                                                                                   Investor Presentation 21 April 2021 37
Introduction & Overview      COVID-19 update      Cash flow & liquidity     Financial performance        Outlook        Conclusion         Appendix

Glossary
Term                                   Definition
EBITDA                                 The profit or loss for a certain period before income tax expense, net finance cost, depreciation and impairment of property, plant & equipment & right of use assets,
                                       amortisation and impairment of intangible fixed assets, profit/loss on disposal of property, plant & equipment, profit/loss on lease modifications & exceptional
                                       administrative expenses.
Expansionary Capital Expenditure       The Initial Capital Investment & the capital costs of expanding gym sites incurred in that period, and the capital costs of investments in technology in that period.
Fitness World or Fitness World         Refers to Forward TopCo A/S & its subsidiaries.
Group
Gym Cohorts                            Groups of Pure Gym or Fitness World clubs, as applicable, that opened during a specified period.
Gym Site Adjusted EBITDA               Adjusted EBITDA for that period, excluding Head Office Costs.
Gym Site Adjusted EBITDA Margin        Gym Site Adjusted EBITDA divided by revenue for that period.
Head Office Costs                      All non-gym specific costs, other than depreciation & amortisation, related to the operation of head office functions in a given period.
Initial Capital Investment             The capital cost of bringing a new gym into operation or extending a gym, including expenditures on site fit out, fixtures, fittings & equipment & excluding the cost of any
                                       right of use property assets, ongoing maintenance & refurbishment capex.
Large Box Format (LBF)                 Large Box Format (LBF) gyms are gyms that are typically over 12,000 square feet in size.
Maintenance & Refurbishment            The total capital expenditure incurred in a period less Expansionary Capital Expenditure incurred in that period.
Capital Expenditures
Mature Gym Adjusted EBITDA             Profit for a certain period before income tax expense, net finance cost, depreciation and impairment of property, plant & equipment & right of use assets, amortisation and
                                       impairment of intangible fixed assets, profit/loss on disposal of property, plant & equipment, profit/loss on lease modifications & exceptional administrative expenses for
                                       Mature Gyms, after adding back other extraordinary items, Pre-Opening Costs for Mature Gyms & Head Office Costs & subtracting the Cash Rent Adjustment for Mature Gyms.
Mature Gym EBITDA                      profit for a certain period before income tax expense, net finance cost, depreciation and impairment of property, plant & equipment & right of use assets, amortisation and
                                       impairment of intangible fixed assets, profit/loss on disposal of property, plant & equipment, profit/loss on lease modifications, exceptional administrative expenses &
                                       Head Office Costs for Mature Gyms. Mature Gym EBITDA does not include the Cash Rent Adjustment or adjustments for Pre-Opening Costs or other extraordinary items
                                       that were added back to Adjusted EBITDA & Gym Site Adjusted EBITDA.

                                                                                                                                                                                  Investor Presentation 21 April 2021 38
Introduction & Overview   COVID-19 update     Cash flow & liquidity      Financial performance       Outlook         Conclusion        Appendix

Glossary
Term                                Definition
Mature Gyms                         The gyms that have been open as Pure Gyms for 24 months or more or as Fitness World clubs open as for 24 months or more as of the end of the relevant reporting period.
Net Debt                            Total indebtedness of the group including finance lease liabilities as reported under IAS17 (excluding property lease liabilities recognised under IFRS 16) less cash & cash
                                    equivalents.
New Gyms                            The gyms that have been open as Pure Gyms for less than 24 months or Fitness World clubs for less than 24 months as of the end of the relevant reporting period.
Number of Gyms                      The total number of gyms that are open & trading as of the specified date or the end date of the relevant period.
Operating Cash Flow                 Adjusted EBITDA plus Working Capital Cash Flow & less Maintenance & Corporate Capital Expenditure cash flows for that period.
Operating Cash Flow Conversion      The Operating Cash Flow for that period divided by Adjusted EBITDA for that period.
Pre-Opening Costs                   The total of all gym site operating costs incurred during the pre-opening periods of gyms in that period. Pre-Opening Costs primarily consist of staff & marketing expenses.
Pro Forma Run Rate Adjusted         Run Rate Adjusted EBITDA for the twelve months ended on the reporting date, after giving pro forma effect to the recent acquisition of Fitness World as if the acquisition
EBITDA                              occurred on the first day of the period & including synergies expected to be realised from the combined group.
Pro Forma Net Interest Expense      The net of interest payable/receivable for the twelve months ended on the reporting date after giving pro forma effect to borrowings as at the balance sheet date, as if
                                    those borrowings occurred on the first day of the period.
ROCE                                Adjusted EBITDA divided by Initial Capital Investment & refers to return on capital employed.
Run-Rate Adjusted                   The adjustment made to those gyms which are less than three years old at the end of the reporting period. These adjustments replace the Adjusted EBITDA earned by
                                    these sites in the last twelve month period with the projected Adjusted EBITDA for their third year of operation.
Run-Rate Adjusted EBITDA            The Adjusted EBITDA including any Run Rate Adjustment.
Senior Secured Net Debt             The total senior secured indebtedness of the group (excluding finance lease liabilities as reported under IAS17), less cash & cash equivalents.
Small Box Format (SBF)              Small Box Format (SBF) gyms are gyms that are typically 6,000-9,000 square feet in size.
Working Capital Cash Flow           Cash movements in working capital.

                                                                                                                                                                               Investor Presentation 21 April 2021 39
Investor Contact Details

                  PureGym
                  Town Centre House
                  Merrion Centre
                  Leeds LS2 8LY

                  Website: corporate.puregym.com
                  Email: ir@puregym.com
You can also read