J.P. Morgan Auto Conference Investor Presentation - NYSE: TEN - Investors
←
→
Page content transcription
If your browser does not render page correctly, please read the page content below

J.P. Morgan Auto Conference
Investor Presentation

August 13, 2019               NYSE: TEN
New York, NY

Safe Harbor

Forward-Looking Statements
This communication contains forward-looking statements. These forward-looking statements include, but are not limited to, (i) all statements, other than
statements of historical fact, included in this communication that address activities, events or developments that we expect or anticipate will or may occur in the
future or that depend on future events and (ii) statements about our future business plans and strategy and other statements that describe Tenneco’s outlook,
objectives, plans, intentions or goals, and any discussion of future operating or financial performance. These forward-looking statements are included in various
sections of this communication and the words “may,” “will,” “believe,” “should,” “could,” “plan,” “expect,” “anticipate,” “estimate,” and similar expressions (and
variations thereof) are intended to identify forward-looking statements. Forward-looking statements included in this communication concern, among other things,
benefits of the Federal-Mogul acquisition; the combined company’s plans, objectives and expectations (including the proposed separation of DRiV™ from the
Powertrain Technology business); future financial and operating results; and other statements that are not historical facts. Forward-looking statements are subject
to a number of risks and uncertainties that could cause actual results to materially differ from those described in the forward-looking statements, including the
possibility that the combined company may not complete the spin-off of DRiV from the Powertrain Technology business (or achieve some or all of the anticipated
benefits of such a spin-off); the possibility that the transaction may have an adverse impact on existing arrangements with Tenneco, including those related to
transition, manufacturing and supply services and tax matters; the ability to retain and hire key personnel and maintain relationships with customers, suppliers or
other business partners; the risk that the benefits of the transaction, including synergies, may not be fully realized or may take longer to realize than expected; the
risk that the transaction may not advance the combined company’s business strategy; the risk that the combined company may experience difficulty integrating or
separating all employees or operations; the potential diversion of Tenneco management’s attention resulting from the transaction; as well as the risk factors and
cautionary statements included in Tenneco’s periodic and current reports (Forms 10-K, 10-Q and 8-K) filed from time to time with the SEC. Given these risks and
uncertainties, investors should not place undue reliance on forward-looking statements as a prediction of actual results. Unless otherwise indicated, the forward-
looking statements in this release are made as of the date of this communication, and, except as required by law, Tenneco does not undertake any obligation, and
disclaims any obligation, to publicly disclose revisions or updates to any forward-looking statements.

In addition, please see Tenneco’s financial results press release for factors that could cause Tenneco’s future performance to vary from the expectations expressed
or implied by the forward-looking statements herein.

                                                                                                                                                                          2
Diversified Business Profile
 Combined Tenneco – 2018 Pro Forma Revenue $17.8 billion
    Product Applications                                                                                                                        Top OE Platforms (Models)
            OE                                                                                                                        6%   VW MQB/PQ35            (Golf, Octavia, Sagitar pass cars)
       CTOH &                                                         GM                         Ford
      Industrial
         18%                                                         10.8%                      10.0%                                 3%   Ford T3/P558 HD        (HD Super Duty truck)

               2018                                                                                                                   2%   Ford T3/P552 LD        (LD F-150 truck)

Aftermarket
              Pro Forma
                           OE Light
                                                                                                              VW Group                2%   GM K2XX HD             (HD Silverado and Sierra trucks)
               Revenue
   19%                     Vehicle                                                                              9.1%
                            63%                                                                                                       2%   GM D2XX/Delta          (Cruze pass car; Equinox, Verano SUV)

                                                                                                                     Daimler AG       2%   Daimler MRA            (E and C class pass cars)

                                                                       Top Customers                                    6.5%          2%   GM K2XX LD             (LD Silverado and Sierra trucks)
                                                 Other                      2018 Pro Forma
              Regions                            33.4%                         Revenue
                                                                                                                                      2%   GM C1XX/Lambda         (Traverse, Enclave and Acadia SUVs)

Rest of AP
                                                                                                                           FCA 5.2%
   5%                                                                                                                                 2%   Daimler MFA            (CLA and A-Class pass cars and GLA SUV)

                                                                                                                     Renault/Nissan   1%   Land Rover PLA-D7u (RR Sport, Discovery, Range Rover SUVs)
                           North                                                                                         3.4%
    China
     11%
                          America                                                                                                     1%   GM E2XX/Epsilon        (Malibu, Lacrosse, Regal pass cars)
               2018        44%                                                                                      Tata Motors
              Pro Forma
                                                                                                                       2.9%
                                                                                                                                      1%   BMW LU                 (X1 and Mini pass cars)
                                                                                                                    SAIC
               Revenue                                                                                              2.8%
                                                                                                             BMW                      1%   Ford C1                (Focus pass car and C-Max van)
                                                                                                             2.6%
         Europe                                                                                    Caterpillar
          37%
                                                                                              FAW
                                                                                       Toyota 2.4%   2.5%                             1%   Jaguar PLA-D7a         (Range Rover Velar and F-Pace SUVs)
                                                   NAPA/Alliance1.9%                     2.3%
                               South America
                                    3%
                                                     PSA Peugeot Citroën 2.1%
                                                                 Advance Auto Parts 2.1%
                                                                                                                                      1%   VW MLB B               (Audi A4 pass car and Audi Q5 SUV)

                                           Diversified business profile enables long-term growth
                                                                                                                                                                                                            3
Q2 Highlights

 Q2 revenue $4.5B                                                                                                          Business Highlights
  Pro forma revenue growth +1%(1) YOY,
  excluding a YOY currency headwind of -4%                                                                                 • Advanced suspension
      • DRiV™ -5%(1) YOY; including -1% from portfolio changes(3)                                                            win on the all-electric
                                                                                                                             Polestar 2 with Volvo
      • New Tenneco +4%(1) YOY
                                                                                                                           • New Carzone strategic
 Adjusted EBITDA $414M; VA EBITDA margin 11.1%                                                                               cooperation agreement
 VA EBITDA margin even(2) with last year (pro forma)                                                                         in the China aftermarket
      • Sequentially +240bps vs. Q1 on flat revenue,                                                                       • Clean Air won conquest light duty diesel
        driven by cost management and synergy capture                                                                        pick-up business in North America

                                                                                                                           • Clean Air ready to launch
 Adjusted EPS $1.20
                                                                                                                             new exhaust business on
                                                                                                                             mid-engine Corvette
(1)   Pro Forma revenue growth is measured at 2018 constant currency rates and includes FM acquisition in prior periods.
(2)   Adjusted EBITDA measured on a pro forma basis, including FM acquisition in prior periods
(3)   Q1 2019 portfolio changes include the Ohlins acquisition and the sale of the Wipers business.

                Revenue at mid-point of Q2 guidance, adjusted EBITDA margin +240bps sequentially
                                                                                                                                                                        4
Two Focused, Purpose-Built Companies

                       DRiV      TM
                                      (SpinCo)                                                          New Tenneco
                       Aftermarket and Ride Performance Company                                         Powertrain Technology Company

DRiV is a new breed of business, a more than $6 billion start-up,        The new Tenneco combines the expertise of two established
built from the combined strengths of Tenneco, Federal-Mogul and          companies to create a pure-play powertrain leader dedicated
Öhlins Racing. The company’s global scale, stable of well-respected
                                                                         to enabling cleaner mobility. By building more efficient, more
and enduring aftermarket brands and longtime partnerships with
the world’s leading OE manufacturers give DRiV a unique                  powerful and more sophisticated powertrain systems,
competitive advantage.                                                   Tenneco’s advanced solutions reduce emissions in traditional
DRiV is strategically positioned for long term growth, capitalizing on   and hybrid applications. It will realize growth from increased
secular trends such as the expansion of vehicles in operation            emission regulations, hybridization and commercial truck and
globally, as well as growth in advanced suspension, new mobility         off-highway expansion opportunities.
models and the evolution of autonomous driving.

Reporting Segments*                                                      Reporting Segments*
• Motorparts (all AM business)                                           • Clean Air
• Ride Performance (all OE business)                                     • Powertrain

 Unique strategic combination building upon the strength, depth and industry experience of the combined teams
                                                                                                          *Beginning with Q1 2019 financials   5
Separation Rationale

The DRiV spin – expected mid-2020 – will create a focused, purpose-built aftermarket and OE ride performance market leader

    STRATEGIC & OPERATIONAL FOCUS                • Benefit from global scale with our broad aftermarket product portfolio and go-
                                                   to-market capabilities to enable differentiated customer and channel support
                                                 • Total system level capabilities to serve the secular OE trends

                  STRATEGIC FLEXIBILITY          • Increased strategic flexibility to pursue growth and investment strategies,
                                                   resulting in revenue acceleration, improved profitability, and enhanced returns
                                                 • Enhanced capabilities to capitalize on emerging trends, driving further
                                                   innovation

          OPTIMAL CAPITAL STRUCTURE              • Independent equity structure, allowing it direct access to capital markets to
                                                   facilitate capitalization on unique growth opportunities
                    AND ALLOCATION

               CLEAR INVESTMENT CASE             • Provides investors distinct investment opportunities for both companies,
                                                   with specific growth, capital deployment, and product profiles
                         AND APPEALS
                                                 • Unlocks value and creates a compelling investment opportunity

                                                                                                                                     6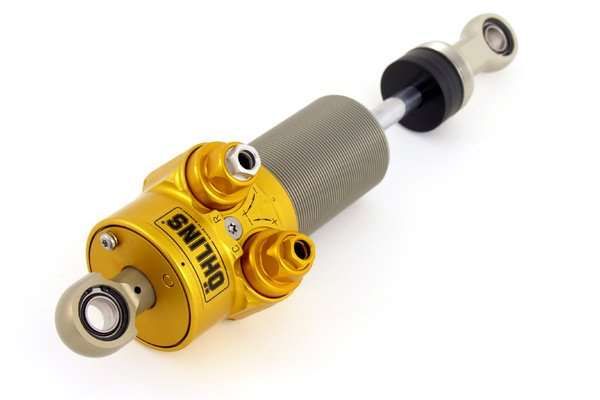
New Tenneco
Powertrain Technology Company

                                7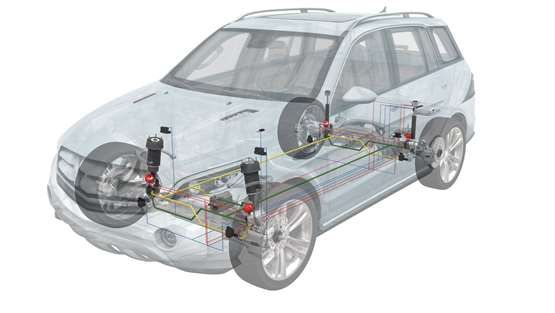
New Tenneco Overview
     Driving Progress Toward Cleaner, More Efficient Mobility

             SIZ E & SCALE                                                      GLOBAL FOOTPRINT                         PORTFOLIO OF
                                                                                                                    PRODUC TS & TECHNOLOGIES
• Pro Forma revenues of $11.4B                                        • ~50,000 global team members

• Pro Forma adjusted EBITDA of                                        • 151 manufacturing locations
  $1.1B (9.7% margin)                                                   worldwide                                                       Full Exhaust Systems
                                                                                                                                                                        System
                                                                                                           Catalytic Converters                                        Protection
• Top 3 global share in all major                                     • 22 globally networked technology
  product categories                                                    centers

                                                                                                                         Pistons             Bearings              Valves

                                                                                                                Gasoline                                 Sealing /          Ignition
                                                                                                           Particulate Filters     Electronic Valve     Heat Shields

                 Global pure-play powertrain supplier, positioned to capture significant opportunities
    * Pro Forma revenue and EBITDA includes Federal Mogul acquisition as if it occurred prior to 1/1/18                                                                                8
Revenue and Business Mix
        New Tenneco – 2018 Pro Forma Revenue $11.4 Billion
             Product Applications                                                                                                                         Top OE Platforms (Models)

                                                                                                                                                7%   VW MQB/PQ35            (Golf, Octavia, Sagitar pass cars)
              OE CTOH &
               Industrial
                  24%                                                                                                      GM                   4%   Ford T3/P558 HD        (HD Super Duty truck)
                                                                                       Other 16.3%                        14.5%
                       2018                                                                                                                     4%   Ford T3/P552 LD        (LD F-150 truck)
                     Pro Forma                        Cummins 1.8%
                      Revenue                                                                                                                   4%   GM K2XX HD             (HD Silverado, Sierra trucks)
                                     OE Light     John Deere 2.4%
                                     Vehicle                                                                                                    3%   GM D2XX/Delta          (Cruze pass car; Equinox, Verano SUV)
                                      76%
                                                                                                                                         Ford
                                                                    PSA Peugeot                                                                 3%   Daimler MRA            (E and C class pass cars)
                                                                    Citroën 2.9%                                                        12.5%

                                                                     FAW 3.2%
                                                                                                     Top Customers                              3%   GM C1XX/Lambda         (Traverse, Enclave and Acadia SUVs)

                                                                                                         2018 Pro Forma                         2%   Daimler MFA
                      Regions                                                                               Revenue
                                                                                                                                                                            (CLA and A-Class pass cars, GLA SUV)
                                                                       Toyota 3.3%
                                                                                                                                                2%   Land Rover PLA-D7u (RR Sport, Discovery, Range Rover SUVs)
Rest of AP                  North America                                 BMW
                                                                                                                                    VW Group
   5%                            41%                                      3.3%                                                        9.6%      2%   BMW LU                 (X1 and Mini pass cars)

                                                                            Tata Motors                                                         2%   GM K2XX LD             (LD Silverado and Sierra trucks)

        China
                       2018                                                    3.4%

         13%         Pro Forma                                                       SAIC
                                                                                                                           Daimler AG           1%   GM E2XX/Epsilon        (Malibu, Lacrosse, Regal pass cars)
                      Revenue                                                        3.5%
                                                                                                                              8.5%              1%   Toyota MC-M            (Sienna van and RAV4 SUV)
                                                South America                               Caterpillar
                                                     2%                                       3.9% Renault/      FCA
                       Europe
                                                                                                        Nissan
                                                                                                                 6.7%                           1%   FCA EVO/CUSW           (Jeep Cherokee SUV)
                                                                                                         4.2%
                        39%
                                                                                                                                                1%   Daimler NCV3           (Sprinter Van)

                                Expected growth in CTOH & Industrial further diversifies the business profile
                                                                                                                                                                                                                    9
What is New Tenneco?

        Tenneco Clean Air                                                                    Federal-Mogul Powertrain
                                                                                     1
  1                         2                                                       4 2 3
                                                                                       5
                                                                                         6    1              2              3
 Catalytic Converters      Full Exhaust Systems                                 1
                                                                             3    5
                                                                                6
  3                         4                                                 7                Bearings          Ignition       Valves
       Gasoline
                                                                4
  Particulate Filters        Electronic Valve                                                 4              5              6
        Diesel Particulate Filters

                   6                              2                                                                          Sealing /
                                                                                                  Pistons      System
                                                          6                                                   Protection    Heat Shields
           7                    5
 Selective Catalytic    Diesel Oxidation
     Reduction              Catalyst
                                                                                                            Key Trends
               Key Trends                             Legend                                 • CO2 / Fuel economy regulations
                                                         Tenneco Clean Air                   • Engine performance – downsized,
• Tightening emissions regulations
                                                         Federal-Mogul Powertrain              higher output engines
• Electrification / Hybridization

                          One of the largest pure powertrain suppliers with engine to tailpipe solutions,
                                addressing both greenhouse gas and criteria pollutant emissions
                                                                                                                                           10
Tightening Emissions Regulations
Regulatory-driven growth accelerates through the next decade
• Commercial Truck
– 2020-21 / 2023 – China VIa/VIb** Growth of Powertrains Under Regulation
– 2020 – India BS VI (skipping BS V) (millions) 2019 2022 2025 CAGR
– 2023-2027 – CARB & EPA Low NOx**
CT: Euro VI (equivalent) 1.4 2.1 2.7 12%
• Off-Highway Regulated Off-Hwy 2.9 4.0 5.0 10%
– 2019 – EU Stage V
– 2020 – China 4R (equiv. EU Stage 3B + DPF)
Total 4.3 6.1 7.7 10%
– 2020/2024 – India BS IV/India BS V
Source: PSR production forecast and Tenneco estimates, July 2019
• Light Vehicle
– 2017-2025 – US Tier 3
– 2017-2021 – Euro 6c/6d Real Driving Emissions
China VI Content Growth Opportunity
– 2020/2023 – China 6a/6b** • 30% Increase in Light Vehicle VA CPV vs. 2018A
– 2020 – India BS 6 (skipping BS 5) • Commercial VA CPV Expansion Higher
CTOH market expands with increasing number of vehicles under regulation
** Tenneco estimates 11Significant Growth Potential in CTOH
Americas EMEA Asia Pacific
2025 CTOH Production: 1.3 million 2025 CTOH Production: 2.1 million 2025 CTOH Production: 7.3 million
Regulated Diesel 2019: 64% Regulated Diesel 2019: 77% Regulated Diesel 2019: 30%
Regulated Diesel 2025: 70% Regulated Diesel 2025: 77% Regulated Diesel 2025: 72%
Europe 560 888 335
477 Japan/Korea
China
281 1,032
1,399 1,266
North America
441
India
1,052
Projected Regulated 2025 Units (thousands) 142
Commercial Truck South America
Off-Highway Engines
Asia Pacific production is expected to be
2x the Americas and EMEA regions
combined
CTOH regulated diesel volume expected to increase by nearly 3.5 million units by 2025, driven mainly by APAC
* Source: PSR July 2019 & Tenneco forecasts, Fuel type = Diesel, NG/LPG, excluding emissions compliance = None 12Investment Appeals
Focused Strategy Provides Content Growth and Cash Generation Opportunities
• Pure play creates focus and specialty
• Tightening emissions standards and regulations offer content opportunities globally,
particularly in commercial truck and off-highway (CTOH) markets
• Strong cash generation potential creates opportunity for long-term value creation
• Experienced management team that has had success generating value for shareholders
Global pure-play powertrain supplier, positioned to capture significant opportunities
13DRiV Incorporated
(SpinCo) Aftermarket and Ride Performance Company
14Introducing DRiV – Driving Advancements for TM
Every Vehicle, Every Ride, Every Race, Every Journey
With a world-leading stable of automotive “AROUND THE WHEEL” PRODUCT OFFERING
brands ranging from the highest level of
performance to the broadest everyday use,
DRiV is dedicated to helping drivers Top mount
Upper control arm
experience the perfect ride.
As a global leader serving both manufacturers Ball joint
Spring assembly
and the aftermarket, DRiV is dedicated to
helping its customers innovate the ride
Dampers
experience in an emerging age of shared
Hub assembly
mobility and autonomous driving. Inner and outer tie rods
SOLUTIONS PROVIDED FOR
Bushings
Brake rotors
Lower control arm
Linkages
15Serving OE and Aftermarket Customers Globally
Global Footprint with ~31,000 Team Members
TOP OE PLATFORMS (MODELS)
OE
CTOH Advance 5% VW MQB/PQ35 (Golf, Tiguan, Octavia pass cars)
8% VW Group Auto
8.2% Parts Ford 2% GM K2XX LD (LD Silverado and Sierra trucks)
OE Light 5.9% 5.5%
Vehicle 1% Ford C1 (Focus pass car, Escape and Kuga SUVs)
PRODUCT 38% GPC / NAPA
APPLICATIONS
5.3% 1% GM E2XX/Epsilon (Malibu, Lacrosse, Insignia pass cars)
GM 1% Jaguar PLA-D7a (XF and XE pass cars, F-Pace SUV)
Aftermarket 4.2%
54% 1% Suzuki Motor B (Swift and Baleno pass cars)
O'Reilly Auto Parts
TOP 3.8% 1% Ford T3/P558 HD (HD Super Duty truck)
Other
CUSTOMERS ATR
3.4%
1% VW MLB B (Audi A4 and A5 pass cars)
Rest of AP
5% 45.8% Daimler AG 1% FCA Small/SUSW (Jeep Compass)
3.0%
1% VW MQB A0 SUV (T-Cross and Arona SUVs)
China The Group
7% 2.6%
North
FCA
1% VW PQ75 (Transporter van)
America 2.5%
REGIONS 49% 1% BMW L7 (2 Series and 3 Series pass cars)
Tata Motors
2.1% 1% Daimler NCV2 (Vito and Viano vans)
Europe Autoplus 2.1%
35% ADI 2.0% 1% FCA JK/JL (Jeep Wrangler SUV)
Renault/Nissan 1.9%
AutoZone 1.7%
1% Ford B2E (Aspire pass car)
South America
4%
DRiV – 2018 pro forma revenue $6.4 billion
16
Pro Forma revenue and EBITDA includes Federal Mogul acquisition as if it occurred prior to 1/1/18Motorparts Segment:
Leading AM Product Lines, Brands and Services
PREMIER AFTERMARKET “HOUSE OF BRANDS” AFTERMARKET GROWTH OPPORTUNITIES
Products Position In all three geographic regions
• Shocks and struts North America
#1 Globally
• Suspension systems • Vehicles In Operation (VIO) tailwind – continued growth
• Steering, hubs #1 North America in vehicles aged 5 to 10 years old through 2025
• Driveline #3 EMEA
• Opportunity to recapture previous years’ channel
• Brake pads, shoes, linings conflict business loss (~$300M)
#1 North America
• Rotors and drums
• Gaskets
EMEA
#1 Globally • Share opportunity – Europe business is ~40% the size
• Seals
• Underhood service
of our North America business and there are more VIO
#3 Globally in Europe
• Ignition
Asia Pacific
• Brake pads, shoes, linings #2 EMEA
• China market growth – poised to be the largest
aftermarket in the world by 2025
• Emission control products #1 NA & EMEA
Unprecedented growth expected over next
• Suspension links, bushings, 15 years, led by China
mounts, exhaust isolators #1 South America
• Shocks and struts GLOBAL VEHICLES IN OPERATION
1950 1960 1970 1980 1990 2000 2010 2020 2025 2030
Global multi-line, multi-brand portfolio of products, services and solutions
17Ride Performance Segment:
Elevating the OE Ride Experience
The Ride Performance team is dedicated to helping drivers experience the perfect ride and delivering NVH PERFORMANCE MATERIALS
advanced suspension technologies that offer performance, comfort and the power to differentiate vehicles.
DRiVTM offers a suite of noise
vibration and harshness (NVH)
ADVANCED SUSPENSION TECHNOLOGIES solutions that are critical to electric
vehicle development.
Advanced Solutions
Monroe® Intelligent Suspension
products meet the growing
demand from manufacturers
and consumers for advanced
suspension systems.
Scalable architecture
Performance Technologies
Premium OE automotive and
motorsports performance BRAKING
products that offer enhanced
portfolios in the broader DRiV offers one of the broadest
mobility market. External Internal product portfolios of friction
valves valves products in the market,
including solutions for
zero-copper
CONVENTIONAL RIDE CONTROL friction materials.
A global leader in conventional suspension solutions, DRiVTM
sells more than 75 million OE shocks and struts globally.
18Creating a Focused, Purpose-built
Aftermarket & Ride Performance Company
INVESTMENT APPEALS
• Global reach and scale
• System level capabilities for “around the wheel”
• Diversified business profile – 54% AM / 46% OE
• Leading AM product lines, brands and services
DRiV Incorporated (SpinCo) • Capitalizing on OE secular trends for advanced suspension,
electrification/autonomous driving and mobility
• Strong Asia Pacific presence and positioning
• Countercyclical business with strong cash flow
generation potential
Unlocking value and creating a compelling investment opportunity
1920
Appendix

           21
Enterprise 2019 Outlook
As of August 6, 2019 – Q2 2019 Earnings
Full Year 2019 Outlook
Q3 Outlook Previous Current Comments
• Revenue $4.3 to $4.4B Weaker market conditions;
(VA Rev $3.55 to $3.65B) Revenue $17.7-$18.1B $17.6-$17.8B +1%* YOY vs. LV production -5%;
-$0.4B YOY FX impact (Euro @ $1.12)
– At mid-point up 3%* YOY
Value-add revenue =
Value-add (VA) revenue $14.6-14.8B
• Adj. EBITDA $390 to $410M Revenue less Substrate revenue
– Both divisions expect YOY margin VA adj. EBITDA margin 10.0-10.6% 10.4-10.6% Improve to higher end of range
improvement of ~100 bps Tighten range on weaker market
Adj. EBITDA $1,500-$1,620M $1,515-$1,565M conditions, higher margin rate
Spin Timing Interest expense $335-$355M ~$335M Improve to low end of range
• On track to complete the separation Adjusted effective tax rate 28-30% 28-30% N/C
and unlock shareholder value Cash taxes $180-$200M $180-$200M N/C
• Targeted spin timing of mid-2020
Capital expenditures(1) $730-$770M ~$730M Improve to low end of range
• Continue to evaluate additional
alternatives to further reduce D&A $660M ~$660M N/C
leverage and to accelerate the
Net debt / LTM adj. EBITDA 3.3x 3.3x N/C
separation of the businesses
(1) Excludes expenditures for software that are estimated around $30M in 2019.
* Pro Forma revenue growth is measured at 2018 constant currency rates and includes FM acquisition in prior periods
22New Tenneco 2019 Year Over Year Expectations
As of August 6, 2019 – Q2 2019 Earnings
Q3 Full Year H2 Commentary
(1%) to +1%*, Flat to (2%)*, or • Clean Air growth > Powertrain
VA REVENUE
or ~$2.1B $8.6-$8.7B • Clean Air launches increase H2 vs. H1
Prior: +1% at midpoint*
• Substrate revenue $3.0B
Prior: $2.75B
Up ~120bps** Down (40) to (60) bps** • Division margin improves
VA ADJUSTED sequentially from Q2
EBITDA MARGIN Prior: (30) to (50) bps **
$470M - $485M • $10M reduction vs. prior
CAPEX
Prior: $480M-$495M
* Pro Forma value-add revenue growth is measured at 2018 constant currency rates and includes FM acquisition in prior periods
** Measured vs. pro forma 2018 23DRiV™ 2019 Year Over Year Expectations
As of August 6, 2019 – Q2 2019 Earnings
Q3 Full Year H2 Commentary
Down ~3%*, Down 3-4%*, or Motorparts:
REVENUE • NA new business wins begin to offset channel conflict losses
or ~$1.5B $6.0-$6.1B • NA major retail customer YOY revenue declines reducing
• Continued pressure in Europe aftermarket
(Prior ~flat*)
Ride Performance:
• NA Ride Control program rationalization impacting overall
revenue growth as planned – enabling final footprint solution
• Several new programs launching in China
Up ~100 bps** Up 20 to 40 bps** • No change to full year implied EBITDA $
ADJUSTED guidance at mid point
EBITDA MARGIN (Prior: ~flat**) • Similar YOY rate improvements in Q3 / H2 as
achieved in Q2
• Maintaining disciplined cost management
• Synergies continuing to ramp, expect to
achieve full synergy run rate by end of 2019
CAPEX $250 - $260M in total • Reduced estimate to lower end of range
(Prior $250 - $275)
* Pro Forma revenue growth is measured at 2018 constant currency rates and includes FM acquisition in prior periods
** Measured vs. pro forma 2018 24Appendix: Tenneco Enterprise Financial Profile
2019 Actuals & Pro Forma 2018 and 2017 Revenue and Earnings, Recast by Segment
2017 2018 2019
($ millions) FY Q1 Q2 Q3 Q4 FY Q1 Q2
Tenneco Revenue
Clean Air $ 6,216 $ 1,756 $ 1,694 $ 1,602 $ 1,655 $ 6,707 $ 1,779 $ 1,827
Powertrain 4,573 1,260 1,243 1,122 1,112 4,737 1,175 1,133
Motorparts 3,678 903 930 867 827 3,527 797 835
Ride Performance 2,686 761 753 690 684 2,888 733 709
$ 17,153 $ 4,680 $ 4,620 $ 4,281 $ 4,278 $ 17,859 $ 4,484 $ 4,504
Value-add Revenue
Clean Air $ 4,029 $ 1,104 $ 1,073 $ 1,006 $ 1,024 $ 4,207 $ 1,073 $ 1,050
Powertrain 4,573 1,260 1,243 1,122 1,112 4,737 1,175 1,133
Motorparts 3,678 903 930 867 827 3,527 797 835
Ride Performance 2,686 761 753 690 684 2,888 733 709
$ 14,966 $ 4,028 $ 3,999 $ 3,685 $ 3,647 $ 15,359 $ 3,778 $ 3,727
Adj. EBITDA(1)
Clean Air $ 598 $ 160 $ 162 $ 149 $ 154 $ 625 $ 140 $ 168
Powertrain 563 140 148 109 135 532 116 118
Motorparts 462 108 125 118 97 448 90 126
Ride Performance 205 51 46 35 43 175 31 50
Corporate (185) (47) (39) (45) (22) (153) (50) (48)
$ 1,643 $ 412 $ 442 $ 366 $ 407 $ 1,627 $ 327 $ 414
Value-add Adj. EBITDA(1) Margin
Clean Air 14.8% 14.5% 15.1% 14.8% 15.0% 14.9% 13.0% 16.0%
Powertrain 12.3% 11.1% 11.9% 9.7% 12.1% 11.2% 9.9% 10.4%
Motorparts 12.6% 12.0% 13.4% 13.6% 11.7% 12.7% 11.3% 15.1%
Ride Performance 7.6% 6.7% 6.1% 5.1% 6.3% 6.1% 4.2% 7.1%
Tenneco Total 11.0% 10.2% 11.1% 9.9% 11.2% 10.6% 8.7% 11.1%
See US GAAP reconciliations and footnotes on pages 31 – 39.
(1) Including noncontrolling interests 25Appendix: New Tenneco Financial Profile
2019 Actuals & Pro Forma 2018 and 2017 Revenue and Earnings, Recast by Segment
2017 2018 2019
($ millions) FY Q1 Q2 Q3 Q4 FY Q1 Q2
New Tenneco Revenue
Clean Air $ 6,216 $ 1,756 $ 1,694 $ 1,602 $ 1,655 $ 6,707 $ 1,779 $ 1,827
Powertrain 4,573 1,260 1,243 1,122 1,112 4,737 1,175 1,133
$ 10,789 $ 3,016 $ 2,937 $ 2,724 $ 2,767 $ 11,444 $ 2,954 $ 2,960
Value-add Revenue
Clean Air $ 4,029 $ 1,104 $ 1,073 $ 1,006 $ 1,024 $ 4,207 $ 1,073 $ 1,050
Powertrain 4,573 1,260 1,243 1,122 1,112 4,737 1,175 1,133
$ 8,602 $ 2,364 $ 2,316 $ 2,128 $ 2,136 $ 8,944 $ 2,248 $ 2,183
(1)
Adj. EBITDA
Clean Air $ 598 $ 160 $ 162 $ 149 $ 154 $ 625 $ 140 $ 168
Powertrain 563 140 148 109 135 532 116 118
Corporate – New Tenneco (71) (15) (15) (17) (3) (50) (20) (23)
$ 1,090 $ 285 $ 295 $ 241 $ 286 $ 1,107 $ 236 $ 263
(1)
Value-add Adj. EBITDA Margin
Clean Air 14.8% 14.5% 15.1% 14.8% 15.0% 14.9% 13.0% 16.0%
Powertrain 12.3% 11.1% 11.9% 9.7% 12.1% 11.2% 9.9% 10.4%
New Tenneco Total 12.7% 12.1% 12.7% 11.3% 13.4% 12.4% 10.5% 12.0%
See US GAAP reconciliations and footnotes on pages 31 – 39.
(1) Including noncontrolling interests
26Appendix: DRiV Financial Profile TM
2019 Actuals & Pro Forma 2018 and 2017 Revenue and Earnings, Recast by Segment
2017 2018 2019
($ millions) FY Q1 Q2 Q3 Q4 FY Q1 Q2
DRiV Revenue
Motorparts $ 3,678 $ 903 $ 930 $ 867 $ 827 $ 3,527 $ 797 $ 835
Ride Performance 2,686 761 753 690 684 2,888 733 709
$ 6,364 $ 1,664 $ 1,683 $ 1,557 $ 1,511 $ 6,415 $ 1,530 $ 1,544
Adj. EBITDA(1)
Motorparts $ 462 $ 108 $ 125 $ 118 $ 97 $ 448 $ 90 $ 126
Ride Performance 205 51 46 35 43 175 31 50
Corporate - DRiV (114) (32) (24) (28) (19) (103) (30) (25)
$ 553 $ 127 $ 147 $ 125 $ 121 $ 520 $ 91 $ 151
Adj. EBITDA(1) Margin
Motorparts 12.6% 12.0% 13.4% 13.6% 11.7% 12.7% 11.3% 15.1%
Ride Performance 7.6% 6.7% 6.1% 5.1% 6.3% 6.1% 4.2% 7.1%
DRiV Total 8.7% 7.6% 8.7% 8.0% 8.0% 8.1% 5.9% 9.8%
See US GAAP reconciliations and footnotes on pages 31 – 39.
(1) Including noncontrolling interests
27Appendix:
Industry Production – YOY% Change
Major Regions Q2’19 Q3’19 FY’19 H1’19 H2’19
North America -2% 2% -2% -3% -1%
South America -2% 6% 1% -3% 5%
Europe -7% 0% -3% -6% -1%
China -16% -11% -10% -13% -6%
India -12% -6% -5% -7% -2%
Global LV Industry
-8% -2% -5% -7% -3%
Production
TEN revenue
-6% -1% -4% -6% -2%
weighted production
Source: IHS Markit July 2019 global light vehicle production forecast and Tenneco estimates.
Global 2019 light vehicle production forecast down 5% YOY
28Appendix:
Synergy Update from Federal-Mogul Acquisition (as of August 6, 2019)
Earnings Synergies Working Capital Synergies
$200M $250M
Run rate GOAL GOAL
by Q3 2020 by Q3 2020
Achieved 75% run rate of
One-time working capital
target one quarter early synergies
Run rate (Q3 2019 goal) Q2 2019
Q2 2019 ~$180M Targeted sources of savings:
~$150M Expect $200M run rate target • $125M inventory reduction
to be achieved by year-end • $125M accounts payable
GOAL:
2019, nearly one year early 50% by Q3 19 terms
Run rate GOAL:
75% by Q3 19
Goal split Achieved ~75% of goal
• $115M DRiVTM (SpinCo) • Payables on track
• $85M New Tenneco • Inventory ahead of schedule
Goal on track
Goal exceeded
E S T I M AT E D C O S T T O A C H I E V E S Y N E R G I E S O F A P P R O X I M AT E LY $ 1 5 0 M
Now expect to pull ahead earnings synergy target and achieve by year-end 2019
29Appendix:
Tenneco Projections
Tenneco’s outlook for 2019 is as of August 6, 2019. Outlook assumptions are based on projected customer production schedules, IHS
Automotive July 2019 forecasts, Power Systems Research July 2019 forecasts and Tenneco estimates. Furthermore:
• Projections are based on original equipment manufacturers’ programs that have been formally awarded to the company; programs
where the company is highly confident that it will be awarded business based on informal customer indications consistent with past
practices; and Tenneco's status as supplier for the existing programs and its relationship with customers.
• Projections are based on the anticipated pricing of each program over its life.
• Except as otherwise indicated, projections assume a fixed foreign currency value. This value is used to translate foreign business to the
U.S. dollar.
• Projections are subject to increase or decrease due to changes in customer requirements, customer and consumer preferences, the
number of vehicles actually produced by our customers, and pricing.
In addition to the information set forth herein, Tenneco’s projections are based on the type of information set forth under “Order Fulfillment”
in Item 1 – “Business” as set forth in Tenneco’s Annual Report on Form 10-K for the year ended December 31, 2018. Please see that disclosure
for further information.
Certain elements of the restructuring and related expenses, legal settlements and other unusual charges we incur from time to time
cannot be forecasted accurately and may be material. In this respect, we are not able to reconcile forecasted EBITDA (and the related
margins) on a forward-looking basis to GAAP measures without unreasonable efforts on account of these factors and other factors not in
our control.
30Q1 2018 Recast Pro Forma(2) Revenue and Adjusted EBITDA
Reconciliation of GAAP(1) to Non-GAAP Results
Pro Forma New Tenneco Pro Forma DRiV
Corporate- Ride Corporate- Pro Forma
($ millions except per share amounts) Clean Air Powertrain New Tenneco Motorparts DRiV Other/Elim
New Tenneco Performance DRiV Total Tenneco
Net sales and operating revenues $ 1,756 $ 1,260 - $ 3,016 $ 903 $ 761 - $ 1,664 - $ 4,680
Less: Substrate sales 652 - - 652 - - - - - 652
Value-add revenues (3) 1,104 1,260 - 2,364 903 761 - 1,664 - 4,028
EBIT, Earnings (Loss) before interest expense,
119 60 - 179 96 (18) - 78 (51) 206
income taxes and noncontrolling interests
Depreciation and amortization of other intangibles 37 61 - 98 24 38 - 62 - 160
Total EBITDA including noncontrolling interests (4) 156 121 - 277 120 20 - 140 (51) 366
Loss on Sale of Receivables reclass 1 1 1 3 5 - - 5 - 8
Segment change impact 2 12 (16) (2) (19) 17 (32) (34) 36 -
Total EBITDA including noncontrolling interests
159 134 (15) 278 106 37 (32) 111 (15) 374
after reclass and segment change(4)
Adjustments(2)
Restructuring and related expenses 1 - - 1 2 7 - 9 - 10
Cost reduction initiatives - - - - - 2 - 2 - 2
Acquisition advisory costs - - - - - - - - 13 13
Warranty charge - - - - - 5 - 5 - 5
Purchase price contingency - 5 - 5 - - - - - 5
Transaction related costs - - - - - - - - 1 1
Other - 1 - 1 - - - - 1 2
Adjusted EBITDA (5) $ 160 $ 140 $ (15) $ 285 $ 108 $ 51 $ (32) $ 127 $ - $ 412
Adjusted EBITDA as % of value-add revenue (6) 14.5% 11.1% 12.1% 12.0% 6.7% 7.6% 10.2%
See footnotes on slide 39 31Q2 2018 Recast Pro Forma(2) Revenue and Adjusted EBITDA
Reconciliation of GAAP(1) to Non-GAAP Results
Pro Forma New Tenneco Pro Forma DRiV
Corporate- Ride Corporate- Pro Forma
($ millions except per share amounts) Clean Air Powertrain New Tenneco Motorparts DRiV Other/Elim
New Tenneco Performance DRiV Total Tenneco
Net sales and operating revenues $ 1,694 $ 1,243 - $ 2,937 $ 930 $ 753 - $ 1,683 - $ 4,620
Less: Substrate sales 621 - - 621 - - - - - 621
Value-add revenues (3) 1,073 1,243 - 2,316 930 753 - 1,683 - 3,999
EBIT, Earnings (Loss) before interest expense,
103 70 - 173 109 (19) - 90 (65) 198
income taxes and noncontrolling interests
Depreciation and amortization of other intangibles 39 61 - 100 21 34 - 55 1 156
Total EBITDA including noncontrolling interests (4) 142 131 - 273 130 15 - 145 (64) 354
Loss on Sale of Receivables reclass - - 1 1 5 - - 5 - 6
Segment change impact 3 13 (16) - (17) 14 (24) (27) 27 -
Total EBITDA including noncontrolling interests
145 144 (15) 274 118 29 (24) 123 (37) 360
after reclass and segment change(4)
Adjustments(2)
Restructuring and related expenses 11 1 - 12 1 10 - 11 - 23
Cost reduction initiatives - - - - - 8 - 8 - 8
Acquisition advisory costs - - - - - - - - 18 18
Costs to achieve synergies 6 - - 6 1 - - 1 2 9
Environmental charge - - - - - - - - 4 4
Transaction related costs - - - - - - - - 13 13
Cost to exit a multiemployer pension plan - 5 - 5 - - - - - 5
Other - (2) - (2) 5 (1) - 4 - 2
Adjusted EBITDA (5) $ 162 $ 148 $ (15) $ 295 $ 125 $ 46 $ (24) $ 147 $ - $ 442
Adjusted EBITDA as % of value-add revenue (6) 15.1% 11.9% 12.7% 12.0%
13.4% 6.1% 8.7% 11.1%
See footnotes on slide 39 32Q3 2018 Recast Pro Forma(2) Revenue and Adjusted EBITDA
Reconciliation of GAAP(1) to Non-GAAP Results
Pro Forma New Tenneco Pro Forma DRiV
Corporate- Ride Corporate- Pro Forma
($ millions except per share amounts) Clean Air Powertrain New Tenneco Motorparts DRiV Other/Elim
New Tenneco Performance DRiV Total Tenneco
Net sales and operating revenues $ 1,602 $ 1,122 - $ 2,724 $ 867 $ 690 - $ 1,557 - $ 4,281
Less: Substrate sales 596 - - 596 - - - - - 596
Value-add revenues (3) 1,006 1,122 - 2,128 867 690 - 1,557 - 3,685
EBIT, Earnings (Loss) before interest expense,
105 21 - 126 102 28 - 130 (51) 205
income taxes and noncontrolling interests
Depreciation and amortization of other intangibles 38 62 - 100 22 35 - 57 2 159
Total EBITDA including noncontrolling interests (4) 143 83 - 226 124 63 - 187 (49) 364
Loss on Sale of Receivables reclass 1 1 1 3 5 - - 5 - 8
Segment change impact 4 13 (18) (1) (16) 16 (28) (28) 29 -
Total EBITDA including noncontrolling interests
148 97 (17) 228 113 79 (28) 164 (20) 372
after reclass and segment change(4)
Adjustments
Restructuring and related expenses 1 8 - 9 8 10 - 18 - 27
Acquisition advisory costs - - - - - - - - 12 12
Costs to achieve synergies - - - - - 1 - 1 3 4
Litigation settlement accrual - - - - - 9 - 9 1 10
Gain (loss) on sale of assets - - - - - (65) - (65) - (65)
Charge for extinguishment of dissenting
- - - - - - - - 5 5
shareholders’ shares
Other - 4 - 4 (3) 1 - (2) (1) 1
Adjusted EBITDA (5) $ 149 $ 109 $ (17) $ 241 $ 118 $ 35 $ (28) $ 125 $ - $ 366
Adjusted EBITDA as % of value-add revenue (6) 14.8% 9.7% 11.3% 12.0%
13.6% 5.1% 8.0% 9.9%
See footnotes on slide 39 33Q4 2018 Recast Pro Forma(2) Revenue and Adjusted EBITDA
Reconciliation of GAAP(1) to Non-GAAP Results
Pro Forma New Tenneco Pro Forma DRiV
Corporate- Ride Corporate- Pro Forma
($ millions except per share amounts) Clean Air Powertrain New Tenneco Motorparts DRiV Other/Elim
New Tenneco Performance DRiV Total Tenneco
Net sales and operating revenues $ 1,655 $ 1,112 - $ 2,767 $ 827 $ 684 - $ 1,511 - $ 4,278
Less: Substrate sales 631 - - 631 - - - - - 631
Value-add revenues (3) 1,024 1,112 - 2,136 827 684 - 1,511 - 3,647
EBIT, Earnings (Loss) before interest expense,
116 33 - 149 (31) (47) - (78) (102) (31)
income taxes and noncontrolling interests
Depreciation and amortization of other intangibles 40 59 - 99 29 37 - 66 - 165
Total EBITDA including noncontrolling interests (4) 156 92 - 248 (2) (10) - (12) (102) 134
Loss on Sale of Receivables reclass - - 1 1 6 1 - 7 - 8
Segment change impact 3 1 (4) - (17) 12 (19) (24) 24 -
Total EBITDA including noncontrolling interests
159 93 (3) 249 (13) 3 (19) (29) (78) 142
after reclass and segment change(4)
Adjustments(2)
Restructuring and related expenses (2) (2) - (4) 2 19 - 21 - 17
Cost reduction initiatives - - - - - - - - 8 8
Acquisition advisory costs - - - - - - - - 53 53
Costs to achieve synergies (3) - - (3) 35 10 - 45 7 49
Purchase accounting adjustments - 44 - 44 57 5 - 62 - 106
Anti-dumping duty charge - - - - 16 - - 16 - 16
Loss on debt modification - - - - - - - - 10 10
Pension charges / Stock vesting - - - - - 3 - 3 - 3
Goodwill impairment charge - - - - - 3 - 3 - 3
Adjusted EBITDA (5) $ 154 $ 135 $ (3) $ 286 $ 97 $ 43 $ (19) $ 121 $ - $ 407
Adjusted EBITDA as % of value-add revenue (6) 15.0% 12.1% 13.4% 11.7% 6.3% 8.0% 11.2%
See footnotes on slide 39 34FY 2018 Recast Pro Forma(2) Revenue and Adjusted EBITDA
Reconciliation of GAAP(1) to Non-GAAP Results
Pro Forma New Tenneco Pro Forma DRiV
Corporate- Ride Corporate- Pro Forma
($ millions except per share amounts) Clean Air Powertrain New Tenneco Motorparts DRiV Other/Elim
New Tenneco Performance DRiV Total Tenneco
Net sales and operating revenues $ 6,707 $ 4,737 - $ 11,444 $ 3,527 $ 2,888 - $ 6,415 - $ 17,859
Less: Substrate sales 2,500 - - 2,500 - - - - - 2,500
Value-add revenues (3) 4,207 4,737 - 8,944 3,527 2,888 - 6,415 - 15,359
EBIT, Earnings (Loss) before interest expense,
443 184 - 627 276 (56) - 220 (269) 578
income taxes and noncontrolling interests
Depreciation and amortization of other intangibles 154 243 - 397 96 144 - 240 3 640
Total EBITDA including noncontrolling interests (4) 597 427 - 1,024 372 88 - 460 (266) 1,218
Loss on Sale of Receivables reclass 2 2 4 8 21 1 - 22 - 30
Segment change impact 12 39 (54) (3) (69) 59 (103) (113) 116 -
Total EBITDA including noncontrolling interests
611 468 (50) 1,029 324 148 (103) 369 (150) 1,248
after reclass and segment change(4)
Adjustments(2)
Restructuring and related expenses 11 7 - 18 13 46 - 59 - 77
Cost reduction initiatives - - - - - 10 - 10 8 18
Acquisition advisory costs - - - - - - - - 96 96
Costs to achieve synergies 3 - - 3 36 11 - 47 12 62
Purchase accounting adjustments - 44 - 44 57 5 - 62 - 106
Anti-dumping duty charge - - - - 16 - - 16 - 16
Environmental charge - - - - - - - - 4 4
Warranty charge - - - - - 5 - 5 - 5
Litigation settlement accrual - - - - - 9 - 9 1 10
Loss on debt modification - - - - - - - - 10 10
Pension charges / Stock vesting - - - - - 3 - 3 - 3
Goodwill settlement charge - - - - - 3 - 3 - 3
Purchase price contingency - 5 - 5 - - - - - 5
Transaction related costs - - - - - - - - 14 14
Cost to exit a multiemployer pension plan - 5 - 5 - - - - - 5
Gain (loss) on sale of assets - - - - - (65) - (65) - (65)
Charge for extinguishment of dissenting
- - - - - - - - 5 5
shareholders’ shares
Other - 3 - 3 2 - - 2 - 5
Adjusted EBITDA (5) $ 625 $ 532 $ (50) $ 1,107 $ 448 $ 175 $ (103) $ 520 $ - $ 1,627
Adjusted EBITDA as % of value-add revenue (6) 14.9% 11.2% 12.4% 12.7% 6.1% 8.1% 10.6%
See footnotes on slide 39
35FY 2017 Recast Pro Forma(2) Revenue and Adjusted EBITDA
Reconciliation of GAAP(1) to Non-GAAP Results
Pro Forma New Tenneco Pro Forma DRiV
Corporate- Ride Corporate- Pro Forma
($ millions except per share amounts) Clean Air Powertrain New Tenneco Motorparts DRiV Other/Elim
New Tenneco Performance DRiV Total Tenneco
Net sales and operating revenues $ 6,216 $ 4,573 - $ 10,789 $ 3,678 $ 2,686 - $ 6,364 - $ 17,153
Less: Substrate sales 2,187 - - 2,187 - - - - - 2,187
Value-add revenues (3) 4,029 4,573 - 8,602 3,678 2,686 - 6,364 - 14,966
EBIT, Earnings (Loss) before interest expense,
420 234 - 654 394 (42) - 352 (272) 734
income taxes and noncontrolling interests
Depreciation and amortization of other intangibles 142 254 - 396 92 132 - 224 4 624
Total EBITDA including noncontrolling interests (4) 562 488 - 1,050 486 90 - 576 (268) 1,358
Loss on Sale of Receivables reclass 2 2 - 4 16 1 - 17 - 21
Segment change impact 7 54 (71) (10) (67) 75 (114) (106) 116 -
Total EBITDA including noncontrolling interests
571 544 (71) 1,044 435 166 (114) 487 (152) 1,379
after reclass and segment change(4)
Adjustments(2)
Restructuring and related expenses 23 16 - 39 21 23 - 44 1 84
Cost reduction initiatives 4 - - 4 3 12 - 15 3 22
Loss on debt modification - - - - - - - - 5 5
Pension charges / Stock vesting - - - - - - - - 13 13
Goodwill impairment charge - 11 - 11 4 7 - 11 - 22
Warranty settlement - - - - - 7 - 7 132 139
Gain on sale of unconsolidated JV - - - - - - - - (5) (5)
Gain from termination of customer contract - - - - - (6) - (6) - (6)
Warranty release - - - - (4) - - (4) - (4)
Release of deferred purchase price payment - - - - - (3) - (3) - (3)
EBITDA contribution of pending asset sales - (2) - (2) - - - - - (2)
Transaction related costs - 3 - 3 1 - - 1 3 7
Gain (loss) on sale of business - (3) - (3) - - - - - (3)
Gain (loss) on sale of nonconsolidated
- - - - 2 - - 2 - 2
affilates
Gain (loss) on sale of assets - (6) - (6) - (1) - (1) - (7)
Adjusted EBITDA (5) $ 598 $ 563 $ (71) $ 1,090 $ 462 $ 205 $ (114) $ 553 $ - $ 1,643
Adjusted EBITDA as % of value-add revenue (6) 14.8% 12.3% 12.7% 12.6% 7.6% 8.7% 11.0%
See footnotes on slide 39 36Q1 2019 Revenue and Adjusted EBITDA
Reconciliation of Non-GAAP Results
New Tenneco Division DRiV Division
Corporate- New Ride Corporate- Total
($ millions except percents) Clean Air Powertrain Motorparts DRiV
New Tenneco Tenneco Performance DRiV Tenneco
Net sales and operating revenues $ 1,779 $ 1,175 - $ 2,954 $ 797 $ 733 - $ 1,530 $ 4,484
Less: Substrate sales 706 - - 706 - - - - 706
Value-add revenues (3) 1,073 1,175 - 2,248 797 733 - 1,530 3,778
Adjusted EBITDA (5) $ 140 $ 116 $ (20) $ 236 $ 90 $ 31 $ (30) $ 91 $ 327
Adjusted EBITDA as % of value-add revenue (6) 13.0% 9.9% 10.5% 11.3% 4.2% 5.9% 8.7%
See reconciliations of GAAP to non-GAAP financial metrics at the segment level in Tenneco’s earnings release and attachments for first quarter 2019.
See footnotes on slide 39 37Q2 2019 Revenue and Adjusted EBITDA
Reconciliation of Non-GAAP Results
New Tenneco Division DRiV Division
Corporate- New Ride Corporate- Total
($ millions except percents) Clean Air Powertrain Motorparts DRiV
New Tenneco Tenneco Performance DRiV Tenneco
Net sales and operating revenues $ 1,827 $ 1,133 - $ 2,960 $ 835 $ 709 - $ 1,544 $ 4,504
Less: Substrate sales 777 - - 777 - - - - 777
Value-add revenues (3) 1,050 1,133 - 2,183 835 709 - 1,544 3,727
Adjusted EBITDA (5) $ 168 $ 118 $ (23) $ 263 $ 126 $ 50 $ (25) $ 151 $ 414
Adjusted EBITDA as % of value-add revenue (6) 16.0% 10.4% 12.0% 15.1% 7.1% 9.8% 11.1%
See reconciliations of GAAP to non-GAAP financial metrics at the segment level in Tenneco’s earnings release and attachments for second quarter 2019.
See footnotes on slide 39 38Footnotes to slides 31 - 38
(1) U.S. Generally Accepted Accounting Principles.
(2) Tenneco presents pro forma revenues and earnings measures to show what the company’s performance would have been had Federal-Mogul been consolidated with Tenneco for the entirety of 2017 and
2018. We believe this supplemental information is useful to investors who are trying to understand the results of the entire enterprise, including Federal-Mogul. The Motorparts segment reflects the
company’s historical Aftermarket segment plus the Motorparts aftermarket business acquired in the Federal-Mogul acquisition. The Ride Performance segment reflects the company’s historical Ride
Performance segment plus the Motorparts OE business acquired in the Federal-Mogul acquisition.
(3) Tenneco presents the above reconciliation of revenues in order to reflect value-add revenues separately from substrate sales. Substrate sales include precious metals pricing, which may be volatile.
Substrate sales occur when, at the direction of its OE customers, Tenneco purchases catalytic converters or components thereof from suppliers, uses them in its manufacturing processes and sells them as
part of the completed system. While Tenneco original equipment customers assume the risk of this volatility, it impacts reported revenue. Excluding substrate sales removes this impact. Tenneco uses this
information to analyze the trend in revenues before these factors. Tenneco believes investors find this information useful in understanding period to period comparisons in the company's revenues.
(4) EBITDA including noncontrolling interests represents income before interest expense, income taxes, noncontrolling interests and depreciation and amortization. We have also presented EBITDA including
noncontrolling interests to give effect to the reclassification of financing charges on sale of receivables that took place in the first quarter 2019 and to give effective to the impact of the segment changes
that occurred in the first quarter of 2019. EBITDA including noncontrolling interests is not a calculation based upon GAAP. The amounts included in the EBITDA including noncontrolling interests calculation,
however, are derived from amounts included in the historical statements of income data. In addition, EBITDA including noncontrolling interests should not be considered as an alternative to net income
(loss) attributable to Tenneco Inc. or operating income as an indicator of the company's operating performance, or as an alternative to operating cash flows as a measure of liquidity. Tenneco has presented
EBITDA including noncontrolling interests because it regularly reviews EBITDA including noncontrolling interests as a measure of the company's performance. In addition, Tenneco believes its investors
utilize and analyze the company's EBITDA including noncontrolling interests for similar purposes. Tenneco also believes EBITDA including noncontrolling interests assists investors in comparing a company's
performance on a consistent basis without regard to depreciation and amortization, which can vary significantly depending upon many factors. However, the EBITDA including noncontrolling interests
measure presented may not always be comparable to similarly titled measures reported by other companies due to differences in the components of the calculation.
(5) “Adjusted EBITDA” is EBITDA including noncontrolling interests (after giving effect to the reclassification and segment change described above) and is presented in order to reflect the results in a manner
that allows a better understanding of operational activities separate from the financial impact of decisions made for the long term benefit of the company and other items impacting comparability between
the periods. Similar adjustments to EBITDA including noncontrolling interests have been recorded in earlier periods, and similar types of adjustments can reasonably be expected to be recorded in future
periods. The company believes investors find the non-GAAP information helpful in understanding the ongoing performance of operations separate from items that may have a disproportionate positive or
negative impact on the company's financial results in any particular period.
(6) Tenneco presents the above reconciliation in order to reflect Adjusted EBITDA as a percent of both value-add revenues. Presenting Adjusted EBITDA as a percent of value-add revenue assists investors in
evaluating the company's operational performance without the impact of substrate sales, which can be volatile.
39You can also read