IDENTIFICATION AND PREFERENCE OF GAME STYLES IN LALIGA ASSOCIATED WITH MATCH OUTCOMES
←
→
Page content transcription
If your browser does not render page correctly, please read the page content below
International Journal of
           Environmental Research
           and Public Health

Article
Identification and Preference of Game Styles in
LaLiga Associated with Match Outcomes
Julen Castellano 1 and Miguel Pic 2, *
 1    Department of Physical Education and Sport, University of the Basque Country (UPV/EHU), Vitoria,
      48940 Leioa, Spain; julen.castellano@ehu.eus
 2    Motor Action Research Group (GIAM), University of La Laguna, 38200 San Cristóbal de La Laguna, Spain
 *    Correspondence: pic.aguilar.90@ull.es; Tel.: +34-922-319-654

 Received: 17 November 2019; Accepted: 11 December 2019; Published: 13 December 2019

 Abstract: The objective was to model the teams’ styles of play (SoPs) in elite football and relate them
 to the match result. For this, the twenty Spanish first division teams in the 2016–2017 season were
 analysed, using nine interaction performance indicators (IRi). A principal component (PC) analysis
 was applied. From two PCs four SoPs were established: deep or high-pressure defending, and
 elaborate or direct attack. The SoPs were distributed according to average performance obtained
 throughout the championship. The connection between the preferred SoP and the final result was
 estimated. Teams with elaborate offensive styles and teams defensively minded got better results.
 In addition, most of the teams showed variability in their SoP. The applications of the study are
 (1) the IRi have served to identify SoP and can be used as a reference to optimize team performance;
 (2) teams should have a varied SoP repertoire, as well as being prepared to deal with different SoPs;
 (3) particular player profiles should be connected with the desired SoP when creating the squad and
 (4) clubs should develop a varied range of SoPs at their academies.

 Keywords: match analysis; team sport; key performance indicator; interaction; match outcome

1. Introduction
       Performance indicators are a combination of variables to help understand performance in
competitions [1]. The analysis of competitive performance is a key process in having objective
information that provides feedback to the team and unveils rival weaknesses and strengths. Most of
the studies [2] have focused on the analysis of offensive variables and performance indicators such as
passes, ball possession or shots on goal. Only in some cases [3] defensive behaviours were studied
(i.e., positioning of the defensive line at the moment of ball recovery). A third alternative has been
the proposal of a repertoire of variables and indicators of both phases of the game, offensive and
defensive [4,5], which has helped to describe the variables that can tell the difference between winners
and losers or between two professional leagues from the same country [6].
       Recently, there has been an interest in investigating the description of the SoP (style of play) used
by professional football teams [7–10]. Valuing the performance of the teams from procedural variables,
indicators of third order [11], allows for a better interpretation of their performances, distinguishing it
from the final result due to the fact that the latter could be more “contaminated” by chance or arbitral
decisions with which to misinterpret bad performances despite having won or having lost unfairly
after a good team performance. In this sense, it might be interesting to know the team’s game style [12]
to design the tasks with greater precision in order to optimize their performance.
       In the study by Fernández-Navarro and colleagues (2016) [8], despite the methodological
limitations [10], after implementing the principal component technique, they estimated a total of twelve
SoPs in the Spanish first division (LaLiga) and the English Premier League. Using the same technique,

Int. J. Environ. Res. Public Health 2019, 16, 5090; doi:10.3390/ijerph16245090   www.mdpi.com/journal/ijerph
Int. J. Environ. Res. Public Health 2019, 16, 5090 2 of 13
in a study of the Chinese Superleague [10], they also distributed the teams into four SoPs (Possession,
Set Piece, Counter-attack and Transitional Play), from twenty variables that could be grouped into
five factors. Through situational variables [7] (i.e., match status, quality of opposition and venue), the
direct style was the most used in the Premier League. The quality of opposition showed influence in
all styles of play except counterattack. In the same study, while match status had a significant effect on
the eight styles, venue showed a significant effect for all styles except counterattack and maintenance.
Therefore, contextual variables had an influence on the different styles of play identified by the authors.
However, despite the fact that these proposals may be of interest, they show a parcelled description
of team performance in competition. In these works [7,8,10], only the performance in absolute terms of
each team was taken into account (i.e., number of counter-attacks, number of passes, number of shots,
etc.). In this sense, it might be wise to consider the performance of both teams to obtain relative data of
each team in each game which is much more individualized. The performance of teams is based on
the rivals’ performance and quality [13] (i.e., number of shots in target done minus the shots in target
received).
For this reason, it would be important to include the performance analysis of the opponent’s
interaction [14], being the simultaneous inter-motor skills one of the key features of the logic of football,
which supports the need to be included the interactive effects [15]. The variance that explains the
performance of teams is greater when taken in relative terms in regards to the opponent [16]. It should
therefore be noted the methodological importance of considering the variables from an interactive
point of view as a relevant procedure to address the specificity of each confrontation.
Therefore, based on these considerations, the present study proposed the following objectives:
(1) to identify team SoP of the Spanish first division LaLiga through interaction performance indicators
(IRi) and (2) to associate the SoPs to the final outcome of the match.
2. Methods
2.1. Sample
For the elaboration of this study, 373 games (of 380 of the total of the championship) played in the
2016–2017 season of the Spanish first division (LaLiga) were analysed. For reasons unrelated to the
investigation (i.e., technical errors), seven matches could not be included in the study. The records
of the twenty teams involved in the competition gave rise to a total of 731 team performances. The
data has been treated in accordance with the Declaration of Helsinki, having been granted the consent
of the club to access the data and having received permission from the Ethics Committee on Human
Beings (CEISH) of the University of the Basque Country (UPV/EHU).
2.2. Variables and Interaction Performance Indicators
The nine IRi were configured from 14 variables, which included offensive, defensive and
conditional behaviours of the teams. These variables collect information about the four moments of
play [17], that is, ball possession and nonpossession of the ball, as well as its transitions. Most of them
have been used in previous studies [4,6,18], proving valid to discriminate performances, although not
in the actual version of interaction.
The offensive performance variables were the total percentage of possession, as well as possession
at the own field and the rival field, similar to that proposed in previous studies. In addition, the total
number of attacks and counterattacks carried out by teams were also included. Finally, total dribbling
and successful dribbling were also included, as well as the total number of passes made and those
passes made forward.
Among the variables that were collected, the game performance in the defence phase was included,
both the total ball recoveries and those made in the opponent’s half [8]. In addition, as has been
previously used [18], the average height of the defence was also considered. Finally, as a conditional
variable, the total distance covered by the team was considered.Int. J. Environ. Res. Public Health 2019, 16, 5090 3 of 13
The performance variables of the team were converted into percentage values. From these
variables, the IRi was configured, for which the subtraction between the IR value of one team and the
IR of the other was made for the match in which they faced each other (Table 1). In this sense, data
more adjusted to the specificity of each match was analysed, as opposed to the procedure of adding
all the performance values of each team, independently of the performance of the rival team and the
specific match.
Table 1. Definition of variables, formulas and codes of performance indicators in interaction (IRi).
Definition Formula IRi Code
((POS total [A]/(POS total [A] + POS total [B]))
Difference in the percentage of ball possession
*100) − ((POS total [B]/(POS total [A] + POS %POS
(POS) between teams
total [B])) *100)
Difference in the percentage of ball possession ((POS own half of the field [A]/POS
in own half of the field with respect to the total total[A])*100) − ((POS own half of the field %POSp
between teams [B]/POS total[B])*100)
Difference in the percentage of ball possession ((POS rival half of the field [A]/POS total
in rival half of the field with respect to the total [A])*100) − ((POS rival (half of the) field %POSr
between teams [B]/POS total [B])*100)
Percentage of counterattacks with respect to the
total attacks (without dead ball actions (BP)), ((Counterattacks [A]/nº of total attacks [A])
understanding as counterattacks the attacks *100) − (Counterattacks [B]/nº of total attacks %CON
with a maximum duration of at least 20 s and in [B]) *100)
which the ball advances at more than 3 m/s
Percentage of recoveries in rival (half of the)
((Recoveries in rival half of the field [A]/Total
field (losses of the rival team in own field) with
Recoveries [A])*100) − ((Recoveries in rival %REC
respect to the total recoveries (total losses of the
half of the field [B]/Total recoveries [B])*100)
rival team)
Percentage of forward passes with respect to ((Forward passes [A]/Total passes[A]) *100) −
%PAS
total passes by the team ((Forward passes [B]/Total passes [B]) *100)
((Total dribbles [A]/(Total dribbles[A]+ Total
Percentage of successful dribbling and total
dribbles [B]))*100) − ((Total dribbles [B]/(Total %DRI
dribbling by the team (A or B)
dribbles [A]+ Total dribbles [B]))*100)
Percentage of space between the last defence ((spatial depth of defense [A]/100) *100) −
%ALT
(goalkeeper is not included) and the goal line ((spatial depth of defense [B]/100) *100)
Percentage of distance covered (KM) by the
((KM [A]/(KM [A]+ KM [B])*100) − ((KM
team with respect to the distance covered by %KM
[B]/(KM [A]+ KM [B])*100)
both teams
Note: [A] is team A and [B] is team B.
2.3. Procedure
The data was obtained using InStat® (www.instatfootball.com) and Tracab® , the latter managed by
the application Mediacoach® (http://mediacoach.es/). The reports were exported into Excel (Microsoft
Corporation, Redmond, WA, USA), and a matrix made and later analysed. Both types of data offered
by these companies in professional football have already been used in previous works [6,9,10], the
event system has given reliable figures [9]. Furthermore, using the Bland−Altman method, some
previous agreement between measures was done comparing Opta® versus InStat® data. The results
showed a bias or systematic error of 5.6 passes (Confidence Intervals 95%: 4.85/6.42; Standard Deviation
479.90 ± 112.4/474.26 ± 113.7), upper (27.1 passes, CI 95%: 25.7/28.4) and lower (−15.8 passes, CI 95%:
−17.1/−14.4) limits of agreement; and for recoveries, the systematic error was −0.8 recoveries (CI 95%:
−1.31/−0.25; SD 53.06 ± 8.4/53.84 ± 9.1) with upper (13.8 recoveries, CI 95%: 12.9/14.7) and lower (−15.3
recoveries, CI 95%: −16.2/−14.4) limits of agreement. Through the application of intraclass correlation
coefficient (95%); “good” results were achieved for recoveries (0.787) and “excellent” for passes (0.997).Int. J. Environ. Res. Public Health 2019, 16, 5090 4 of 13
For all the analyses, the statistical package IBM SPSS Statistics v24.0 for Windows (SPSS, Chicago,
IL, USA) was used. After confirming that the data complied with the criterion of normality applying
Shapiro−Wilks [19], acceptable levels of statistical significance were established (p < 0.05).
2.4. Data Analysis
First, the mean values of the nine IRi were calculated for each of the teams and classified in
quartiles. A principal component analysis (PCA) with orthogonal rotation (Varimax) was implemented
from the mean values. This technique allows to reduce the data, grouping the indicators into a smaller
number of components [8,9]. In this way, the IRi with higher values in each component were chosen to
distinguish the SoPs given in professional football. The value of Kaiser−Meyer−Olkin (KMO) was
calculated to verify the suitability of the sample [20], this value being >0.5. The Bartlett’s sphericity
test was significant (p < 0.001). The principal axis method was used to extract the components [8,9].
Components with a self-value less than 1 were not preserved for extraction [21]. This is due to the
notion that any component that shows a self-value greater than 1 represents a proportion of variance
greater than that provided by any variable. The PCA was applied with a Varimax rotation to identify
that the components or factors were not highly correlated. This ensures that each main component
provides different information.
To interpret the components, the absolute values of the coefficients were taken. The correlation
coefficients were considered [22] as trivial (r < 0.1), small (0.1 ≤ r < 0.3), moderate (0.3 ≤ r < 0.5), long
(0.5 ≤ r < 0.7), very long (0.7 ≤ r < 0.9), almost perfect (r ≥ 0.9) and perfect (r = 1). In the present
study, only indicators with a value higher than 0.7 (positive or negative) were considered to define this
component [23].
The matches were then classified according to the sign and value assigned to each of the previously
generated components; thus revealing the defensive and offensive SoP. Multivariate discriminant
analyses were applied [4] starting from p-value (p < 0.05), using the stepwise method to address the
identity of the styles using Wilks’ Lambda [24].
Finally, Chi-square statistic was applied, and interpreted from the adjusted residuals (ar) to know
the association between the SoPs and the result (win, lose and draw), for the set of SoPs (χ2 ) and for
each one of the teams, in particular considering the preferred SoP (χ2 PS, style of play more used by
teams), being 1 when the team used its medium or preferred SoP and 0 when the team did not play its
preferred SoP.
3. Results
The mean values and standard deviations of the estimated IRi for each team during the whole
championship are shown in Table 2. The values were coloured according to the quartile where they
were located: dark means that this value is in Q1, dark grey in Q2, light grey in Q3 and white in Q4.
Table 3 shows the self-values of each main component, as well as the explained and accumulated
variance. The first two factors explained almost 80% of the total variance.
The result of the orthogonal rotation analysis of the two main components (Table 4) showed the
most important IRi in each of the components. Only IRi with values greater than 0.7 were chosen to
define the component. In addition, the IRi will show a positive or negative influence on the component.
Within the first component, positive %CON (% of counterattacks) and %PAS (% of forward passes)
showed a positive value, while %POS (possession percentage) and %DRI (% of successful dribbles)
were negative. Regarding the second component, positive IRi of %POSr (% possession in rival half of
the field), %REC (% of recoveries in rival half of the field) and %ALT (% of the space that is left behind
the defensive line with respect to the field as a whole) and negative value of %POSp (% possession in
own half of the field) were presented. In Table 4, the correlations between IRi are found. The variables
%POSr and %ALT had a high positive correlation. At the same time, %POSp had a high negative
correlation with %POSr and %ALT, as well as %POS that had a high and negative correlation with the
percentage of passes made going forward ratio with respect to that of the rival (%PAS).Int. J. Environ. Res. Public Health 2019, 16, 5090 5 of 13
Table 2. Average values (standard deviation) of interaction performance indicators for each team
in LaLiga.
Equipo %POS %POSp %POSr %CON %DRI %REC %PASES %KM %ALT
R. Madrid 11.2(14.9) −1.0(14.3) 1.0(14.3) 0.2(8.1) 9.3(15.3) 1.0(13.4) −1.6(3.8) −1.8(1.8) 3.3(6.2)
Barcelona 29.8(15.6) −8.8(17.6) 8.8(17.6) −7.5(8.1) 26.1(14.5) 4.3(16.6) −6.5(5.3) −1.1(1.9) 7.0(8.3)
Atlético −4.2(18.8) −2.5(12.7) 2.5(12.7) 1.7(9.5) −0.7(19.0) 1.5(11.5) 1.6(5.0) 1.6(1.6) −0.1(6.3)
Sevilla 14.8(15.2) −1.7(12.8) 1.7(12.8) −4.2(8.7) 3.3(20.7) −3.2(13.0) −5.4(4.5) 0.2(1.8) 0.1(6.0)
Villarreal −2.2(18.9) 7.8(12.8) −7.8(12.8) 0.1(8.4) −3.1(18.3) −4.7(12.4) −1.8(5.0) −0.6(1.5) −2.8(7.2)
R. Sociedad 12.8(13.7) −2.3(12.8) 2.3(12.8) −3.2(7.3) 4.0(16.2) 3.7(13.6) −2.3(4.2) 0.1(1.6) 2.2(5.4)
Athletic 3.9(15.7) −8.6(11.0) 8.6(11.0) 0.9(8.5) −4.1(23.5) 10.1(10.4) −0.7(4.8) 0.4(1.7) 5.2(4.9)
Espanyol −13.7(15.5) 6.2(13.3) −6.2(13.3) 4.6(8.1) −7.6(21.0) −7.6(10.5) 3.6(4.6) 2.4(1.5) −4.3(4.5)
Alavés −8.3(18.5) 9.9(13.3) −9.9(13.3) 2.9(8.1) −4.0(17.0) −4.9(10.8) 1.2(5.6) 0.2(1.5) −5.4(5.7)
Eibar 0.1(16.6) −5.0(11.1) 5.0(11.1) 1.9(7.2) −9.4(18.0) 9.8(11.3) 0.1(5.3) 0.3(2.0) 2.7(4.4)
Málaga −6.1(17.2) −3.3(15.4) 3.3(15.4) 3.5(7.7) −5.4(21.8) 0.6(11.5) 3.4(5.7) 0.5(1.7) 0.2(6.8)
Valencia −4.0(17.4) −1.9(13.8) 1.9(13.8) −1.2(9.2) 3.0(18.3) 0.4(13.1) 0.4(4.7) 0.1(1.9) 0.4(6.3)
Celta 4.8(18.4) 1.3(10.2) −1.3(10.2) −1.8(7.0) −4.4(17.8) 0.6(8.9) −2.7(6.1) −2.1(1.4) −2.6(4.2)
Las Palmas 13.1(19.4) 2.6(13.6) −2.6(13.6) −6.9(10.9) 16.4(17.5) −9.8(15.9) −3.5(5.2) −0.9(1.7) −0.4(7.2)
R.Betis 0.1(16.0) 2.3(11.8) −2.3(11.8) 1.0(7.8) −1.6(15.0) 0.2(11.6) −0.9(4.5) 0.6(1.8) −0.4(5.5)
La Coruña −6.1(18.4) 2.3(14.0) −2.3(14.0) 2.3(10.3) −2.3(20.4) −3.1(9.3) 1.4(5.0) −1.0(1.4) −1.9(6.6)
Leganés −10.9(15.6) −4.3(11.9) 4.3(11.9) 1.7(7.8) −9.0(16.9) 0.2(9.9) 2.7(5.3) 0.9(1.6) 0.2(5.0)
Sporting −9.9(16.6) 0.8(10.3) −0.8(10.3) −0.5(6.4) −10.4(18.9) 4.7(8.1) 4.3(6.1) 1.1(1.6) −1.0(5.8)
Osasuna −16.8(14.5) 4.1(15.2) −4.1(15.2) 4.2(8.9) −7.9(15.8) −1.7(9.9) 4.4(5.3) −0.3(1.8) −1.0(6.2)
Granada −8.2(18.4) 2.0(13.4) −2.0(13.4) 0.3(8.0) 8.1(19.6) −2.0(12.1) 2.3(5.5) −0.9(2.0) −1.2(4.9)
Note: %POS is possession percentage, %POSp is % possession in own half of the field, %POSr is % possession in
rival half of the field, %CON is % of counterattacks, %REC is % of recoveries in rival half of the field, %PAS is % of
forward passes, %DRI is % of successful dribbles, %ALT is % of the space that is left behind the defensive line with
respect to the field as a whole and %KM is % of the distance covered. The values were coloured according to the
quartile where they were located (dark means that this value is in Q1, dark grey in Q2, light grey in Q3 and white
in Q4).
Table 3. Eigenvalues for components and total variance explained.
Extraction Sums of Rotation Sums of
Initial Eigenvalues
Squared Loadings Squared Loadings
Component
% % % % % %
Total Total Total
Variance Cumulative Variance Cumulative Variance Cumulative
1 4.7 51.82 51.82 4.67 51.82 51.82 3.82 42.49 42.49
2 2.5 27.93 79.74 2.51 27.93 79.74 3.35 37.26 79.74
3 0.67 7.44 87.18
4 0.46 5.10 92.28
5 0.30 3.34 95.66
6 0.20 2.25 97.90
7 0.15 1.66 99.56
8 0.04 0.43 99.99
9 0.001 0.01 100.0
Table 4. Rotated principal components (PC) matrix Varimax, loadings of each IRi (indicator of each
interactive performance) and Pearson correlation matrix between IRi.
PC Pearson
IRi
1 2 %POSp %POSr %CON %DRI %REC %PAS %KM %ALT
%POS −0.910 0.342 −0.42 # 0.42 # −0.62 # 0.56 # 0.25 # −0.83 # −0.29 # 0.67 #
%POSp 0.126 −0.959 −1.00 # 0.27 # −0.26 # −0.59 # 0.28 # 0.03 −0.81 #
%POSr −0.137 0.953 −0.27 # 0.26 # 0.59 # −0.28 # −0.03 0.81 #
%CON 0.877 −0.181 −0.37 # −0.14 # 0.51 # 0.26 # −0.42 #
%DRI −0.853 0.102 0.06 −0.44 # −0.28 # 0.37 #
%REC 0.111 0.863 −0.09 * −0.04 0.65 #
%PAS 0.931 −0.170 0.27 # −0.44 #
%KM 0.657 0.174 −0.12 #
%ALT −0.390 0.750
Note: %POS is possession percentage, %POSp is % possession in own half of the field, %POSr is % possession in
rival half of the field, %CON is % of counterattacks, %REC is % of recoveries in rival half of the field, %PAS is % of
forward passes, %DRI is % of successful dribbles, %ALT is % of the space that is left behind the defensive line with
respect to the field as a whole, and %KM is % of the distance covered. * p < 0.05, # p < 0.01.Int. J. Environ. Res. Public Health 2019, 16, 5090 6 of 13
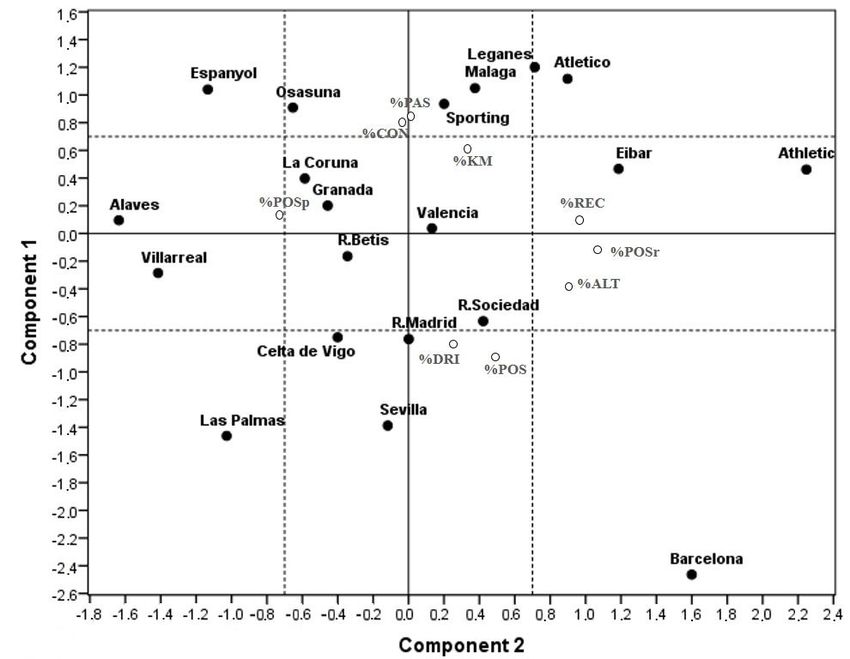
Figure 1 shows the distribution of the nine IRi in the two main estimated components, only %KM
(% of the distance covered) did not provide information in any components. From this, four SoPs were
identified. Two SoPs for representing the offensive phase: direct attack or DA versus elaborate attack
or EA, and another two SoP for the defensive phase: deep defending or DD versus high-pressure
Int. J. Environ. Res. Public Health 2020, 17, x 7 of 13
defence or HD. Quadrant I, identified as direct attack and deep defending (DA/DD), is constructed
with positive
constructed values
with of component
positive values of 1component
in the %PAS and
1 in the%CON
%PAS variables,
and %CON and negativeand
variables, values of the
negative
%POSp variable of component 2 (top-left of Figure 1). Quadrant II (top-right
values of the %POSp variable of component 2 (top-left of Figure 1). Quadrant II (top-right of Figure of Figure 1), direct
attack
1), directand high-pressure
attack defendingdefending
and high-pressure (DA/HD),(DA/HD),
would have positive
would havevalues in the
positive %POSr,
values in the%REC%POSr,and
%ALT variables of component 2 and in %PAS and %CON variables
%REC and %ALT variables of component 2 and in %PAS and %CON variables of component 1. In of component 1. In quadrant
III (bottom-right
quadrant of Figure 1),
III (bottom-right of elaborate
Figure 1),attack and high-pressure
elaborate defending (EA/HD),
attack and high-pressure defending variables
(EA/HD), with
positive values
variables in component
with positive values in2 component
(%REC, %POSr and %ALT)
2 (%REC, %POSr and
and negative
%ALT) and in component 1 for %POS.
negative in component
Finally, quadrant IV (bottom-left of Figure 1), elaborate attack and deep
1 for %POS. Finally, quadrant IV (bottom-left of Figure 1), elaborate attack and deep defending defending (EA/DD), with
negative values in component 2 (%POSp) and in component 1 (%POS).
(EA/DD), with negative values in component 2 (%POSp) and in component 1 (%POS). Average values Average values of the IRi
obtained
of in all theinmatches
the IRi obtained played played
all the matches duringduring
the championship distributed
the championship the teams
distributed into into
the teams the four
the
quadrants, as shown in Figure 1. While most teams showed an unequivocal
four quadrants, as shown in Figure 1. While most teams showed an unequivocal location reference location reference style,
teamsteams
style, like La Coruña,
like Valencia,
La Coruña, R. BetisR.and
Valencia, Granada
Betis were placed
and Granada werein the centre
placed in the ofcentre
the figure (i.e.,
of the close
figure
to 0 close
(i.e., in thetotwo
0 incomponents); this couldthis
the two components); be interpreted as not having
could be interpreted anhaving
as not SoP. an SoP.
IRidistribution
Figure1.1.IRi
Figure distributionasasthe
theaverage
averageposition
positionofofeach
eachteam
teamthrough
throughthethetwo
twoprincipal
principalcomponents.
components.
Note:%POS
Note: %POSisispossession
possessionpercentage,
percentage,%POSp
%POSpisis%%possession
possessionininown
ownhalf
halfofofthe
thefield,
field,%POSr
%POSrisis%%
possession in rival half of the field, %CON is % of counterattacks, %REC is %
possession in rival half of the field, %CON is % of counterattacks, %REC is % of recoveries inof recoveries inrival
rival
half of the field, %PAS is % of forward passes, %DRI is % of successful dribbles,
half of the field, %PAS is % of forward passes, %DRI is % of successful dribbles, %ALT is % of the%ALT is % of the
spacethat
space thatisisleft
leftbehind
behindthe
thedefensive
defensiveline
linewith
withrespect
respecttotothe
thefield
fieldas
asaawhole,
whole,andand%KM%KMisis%%of ofthe
the
distancecovered.
distance covered.
Through discriminant analysis, Wilks’ Lambda statistics was applied (p < 0.001), which measures
the deviations produced by groups with respect to total deviations, fluctuating between 1, when there
is no discriminant capacity of the variables, and 0, when they are entirely discriminant. The centres
of the groups (centroids) were equal, justified by values lower than 0.3, confirming the singularity of
each SoP.Int. J. Environ. Res. Public Health 2019, 16, 5090 7 of 13
Through discriminant analysis, Wilks’ Lambda statistics was applied (p < 0.001), which measures
the deviations produced by groups with respect to total deviations, fluctuating between 1, when there
is no discriminant capacity of the variables, and 0, when they are entirely discriminant. The centres of
the groups (centroids) were equal, justified by values lower than 0.3, confirming the singularity of
each SoP.
Finally, the association between the SoP and the result (win, lose or draw) is shown in Table 5.
There were statistically significant differences taking the SoPs as a whole into account (p < 0.014;
df = 6). The teams that played their games in quadrant II (DA/HD) lost (n = 90, ar = 3.0), while those in
quadrant IV (EA/DD) won more than expected (n = 90, ar = 3.0). Only Espanyol showed a connection
between the SoP and the result of the match (p < 0.005). Of all their matches (n = 38) when they did
not use their preferred SoP (n = 25) they only won six games (ar = −2.7) and lost twelve (ar = 3.0).
However, when they played their preferred style (quadrant I) in fifteen matches they won nine times
(ar = 2.7) and did not lose any (ar = −3.0). Regarding the preferred style, it should be highlighted that
in most of the matches, the teams played in the nonpreferred quadrants (n = 428, 57.2%), compared
with those played in the preferred style (n = 318, 42.5%), although there was an association between the
use of a preferred style and the result of the match (p < 0.008; df = 6). There was a particular negative
connection when using the preferred SoP, a draw (n = 67, ar = −1.4) and losing (n = 109, ar = −1.9) and
positive with winning (n = 142, ar = 3.1).
Table 5 distribution of wins, losses and draws depending on each team’s style of play.Int. J. Environ. Res. Public Health 2019, 16, 5090 8 of 13
Table 5. Distribution of wins, losses and draws depending on each team’s style of play.
I II III IV
Average Quadrat
Team Ranking Pts D W L D W L D W L D W L p(χ2 ) p(χ2 PS)
R. Madrid 1 93 III 1 3 3 1 1 1 10 1 1 13 1 0.095 0.632
Barcelona 2 90 III 4 17 4 2 11 0.301 0.301
Atlético 3 78 II 2 8 1 3 8 5 4 3 4 0.089 0.083
Sevilla 4 72 IV 1 2 1 2 2 4 8 1 4 10 3 0.356 0.887
Villarreal 5 67 IV 3 4 3 1 2 1 3 2 3 13 3 0.222 0.075
R. Sociedad 6 64 III 2 2 2 3 3 5 5 2 10 4 0.539 0.590
Athletic 7 63 II 4 2 1 10 6 5 4 4 0.112 0.248
Espanyol 8 56 I 4 9 8 4 5 3 1 3 1 0.247 0.005
Alavés 9 55 I 5 11 4 2 1 1 1 1 5 2 4 0.421 0.065
Eibar 10 54 II 2 4 2 2 5 4 2 6 1 2 1 0.631 0.483
Málaga 11 46 II 4 4 5 4 5 2 3 5 0.247 0.894
Valencia 12 46 II 2 4 2 1 7 4 3 2 2 6 0.097 0.281
Celta 13 45 IV 1 1 4 1 5 1 2 5 4 8 7 0.768 0.248
Las Palmas 14 39 IV 1 2 3 5 2 5 4 6 11 0.635 0.629
R.Betis 15 39 I 2 5 5 2 1 5 2 2 6 3 2 3 0.726 0.336
La Coruña 16 36 I 6 5 6 2 1 2 1 2 5 2 4 0.629 0.376
Leganés 17 35 II 6 2 2 3 3 11 1 1 4 1 2 2 0.203 0.248
Sporting * 18 31 II 2 1 5 6 4 9 6 2 2 0.097 0.699
Osasuna * 19 22 I 5 3 7 3 1 12 1 2 1 3 0.666 0.162
Granada * 20 20 I 2 4 1 2 8 1 7 3 2 7 0.586 0.455
Total 46 72 64 41 41 94 47 64 72 41 90 59 0.014 0.008
Note: L is losing, D is drawing and W is winning. * Relegated teams. Ranking is the position in the classification at the end of the season. Average quadrant refers to the location of the
mean value of the two components; p-values (χ2 , is the chi-square between the result achieved by the teams in each quadrant, while p-values (χ2 PS, chi-square for the preferred style of
play) reflects the association between the result and the preferred style. The victories that were achieved in their preferred style of play (quadrant) are bold.Int. J. Environ. Res. Public Health 2019, 16, 5090 9 of 13
4. Discussion
The objective of the present study was to model the Spanish first division teams’ SoPs based on
interaction performance indicators (IRi), to later evaluate their connection with the match outcomes.
The analysis of principal components explained almost 80% of the total variance, allowing to distinguish
four SoPs (DA/DD, DA/HD, EA/HD and EA/DD), and which was the predominant or referent (taking
the average value) for each team of LaLiga. However, it should be noted that the strategic proposal of
the teams varied during matches. The second conclusion of the study was that the elaborate attack
style (quadrant IV) had a greater association with winning (n = 90, ar = 3.0), just the opposite of what
happened in matches where teams used quadrant II, whose IRi values are opposed to those of quadrant
IV. In addition, the preferred style of each team showed a greater correlation with success (p = 0.008).
Unlike previous works on the Spanish League, in two different seasons, 2006–2007 and
2010–2011 [8], the Chinese Super League in the 2016–2017 season [10] and the Greek Superliga
in the 2013–2014 season [9], where from 19, 20 and 62 variables; 6, 5 and 8 factors or dimensions
were obtained, resulting in 12, 4 and 8 SoPs, respectively. In the current work, with nine IRi only
two components or factors have been obtained, from which four SoPs have been proposed. It should
be underlined that with only two factors almost 80% of the variance was explained, however, in the
same previous studies the first two components reached an explanatory power [8–10] of 54%, 40% and
52%, respectively. The IRi have made a more clarifying modelling possible, probably because of the
methodological approach, through the interactive relationships of confrontation in competition [15]. In
this exploratory model that has been proposed from the nine IRi, it should be noted that %KM had no
weight in any component so it was not representative of any SoPs, highlighting, probably, conditional
aspects are not so relevant in team sports such as football [25].
In quadrant I, the teams (i.e., Espanyol, Osasuna and Alavés) deployed an SoP DA/DD (Direct/Deep
in attack/defence, respectively), using in particular %PAS and %CON, with greater possession in their
half than the rival (%POSp) with less dribbling (%DRI). Considering offensive sequences that are short
and direct, that is, quick attacks with a low number of passes [1,2], are more effective than longer
possessions, the SoP of the teams placed in this quadrant try to exploit their strengths. Nevertheless,
the effectiveness of this type of attack has a high connection with the place and the context where
the ball is recovered, that is, starting in more offensive zones and in favourable interactional contexts
appears to be more effective [2].
The teams found in quadrant II played with a SoP DA/HD (Direct/Pressure). These SoPs showed
higher values than those of their rivals in %PAS and %CON for some teams (i.e., Sporting, Leganés,
Málaga and Atlético), while others (i.e., Eibar and Athletic) also added superiority in %REC, %ALT
and %POSr (IRi that configure component 1). The positioning of the defensive line is a factor that has
already been previously studied [18], proposing a predictive model based on linear regression, through
the advance of defensive and offensive lines when the team had less quality, played at home and was
losing on the scoreboard [3]. This factor had been studied to compare the teams placed in the upper half
of the table with respect to those in the lower half of two professional leagues of the same country [6].
This variable showed a certain degree of sensitivity, the best-ranked teams had their defence high,
although it may be because the best-ranked teams also had more ball possession [7] and, therefore,
were most of the time in the attack phase. Recently, it has been found [2] that regaining possession in
more offensive zones through pressing could improve the effectiveness of the offensive phase. On the
other hand, although some of the teams with this SoP (i.e., Sporting and Leganés) showed no interest
in using an elaborate style, but they also showed that they covered more distance than their rivals did.
Placed in quadrant III, only three teams (R. Sociedad, R. Madrid and Barcelona) showed an SoP
EA/HD (Elaborated/Pressing), where in addition to higher values than their rivals in the IRi of %POS,
%ALT, %POSr and %REC, showed lower values with respect to their opponents in %CON and %PAS.
Recovering the ball closer to the opponent’s goal increases the chance of scoring [26]. In addition,
although the %KM indicator has not been part of any of the components, these teams could have
a lower physical requirement associated with high-pressure defending [27]. It would be in a senseInt. J. Environ. Res. Public Health 2019, 16, 5090 10 of 13
logical that the use of EA/HD would require playing in smaller spaces and therefore, the importance of
%KM could be relativized. Thus, if something distinguishes this style, it would be the high importance
of the synchronization [28] and the great technical repertoire of the players [29], compared with styles
in which a greater distance could be more valued (i.e., Espanyol, Atlético, Sporting, Leganés and R.
Betis, in the current study).
Finally, in quadrant IV, where teams are grouped with Elaborate Attack and Deep Defending
(EA/DD), they had higher values than their rivals in %POS and were lower in variables such as %REC
and %ALT. The SoP that is placed in this quadrant could be understood as those teams that even having
had control of the ball have not had control of the match. In spite of having had more possession
than their rivals, they have done so in their own half, hence the offensive-progression index has not
benefitted, this is understood as pass efficiency (i.e., ratio shots/passes), which is considered a key
aspect in the good performance of a team [30].
Similar to that found in previous works [8,10], this study points out the importance of variability
in the styles of play used by teams during competition. Although the average values in the IRi placed
each team in a single quadrant or preferential SoP, the reality of the interaction forced the teams to adapt
to the context, that is, level of the opponent, location, current score, and so forth. [9]. The intra-team
variability shown during the championship could be explained by the property of degeneracy or
redundancy of a complex adaptive system when the teams behave in a collective duel as is football.
This redundancy comes to represent the idea that structurally different components of the system (i.e.,
changes to team line-up throughout the championship) like players that can play a similar role—even
not being identical—with respect to the context. This is a synergistic feature of team behaviour, where
the rival counts, mainly, needing to adapt to the particularity of that match [31], having repercussions
on the variability experienced by players depending on the match, for example, in the physical demand.
The results of the present study suggest that there is a strategic coherence in team SoP, where each
preferential behaviour is located. We focus our attention on the average values, but the variability in
the SoP used by the teams during the championship must not be forgotten, sometimes as a result of
the coach dismissal. While there is a particularity in the teams’ style of play, arising from a source of
strategic order pre-established and agreed between the coaching staff and players, during the match it
may be changed for different reasons that contextualize the teams “needs” in that particular moment.
This variability in the SoPs highlights the need to reorient the organization of the training process to
develop a unique style of play, one’s own (i.e., consolidation of strategic fidelity to optimize a unique
way of competing), towards the need to prepare the team to be able to develop flexible, adaptable
and varied SoPs to deal with the particular dynamics intra- and inter-matches (i.e., deal with different
rivals or changes in the score, sending-offs, etc.).
A relevant aspect of the study is the study of the association between the SoP deployed during
the competition by teams and match outcome. When teams did not play their preferred SoP they also
won (or tied) and, on the contrary, lost when they played in the style that they know “best”. The reality
is that most teams deployed a nonpreferred style, 56.4% compared with 42.6% who did, either because
they decided or because they were forced to do so. Only Espanyol offered a significant connection
(p = 0.005) between their preferred SoP (quadrant I) and victories, of 15 games played in their style
they won nine (ar = 2.7) and lost none (ar = −3).
With the exception of Atlético (with a SoP DA/HD), the most successful teams in LaLiga (fourth
quartile of the points distributed in the championship, with >64 points, the top six that gave them
the possibility to play the following year in Europe), were located in quadrants III (EA/HD) and
IV (EA/DD). The IRi that best represented the SoPs were ball possession (%POS, and %POSr with
positive values and %POSp with negative values) and a deep defensive line (%ALT). Probably with
the intention of avoiding a comeback or once ahead on the scoreboard. The ball possession indicator
is important depending on the league, although it is associated with success in the Bundesliga [32],
Spanish League [6] and Premier League [33], or in international tournaments such as the WorldInt. J. Environ. Res. Public Health 2019, 16, 5090 11 of 13
Cup [34]. Furthermore, it seems that football is evolving towards the possession game, due to an
increase in the number and efficiency in passing [35], mainly in players on their defensive line [36].
In the lower part of the table, teams that obtained the first quartile of the distributed points (Int. J. Environ. Res. Public Health 2019, 16, 5090 12 of 13
References
1. Hughes, M.; Franks, I. Analysis of passing sequences, shots and goals in soccer. J. Sports Sci. 2005, 23,
509–514. [CrossRef] [PubMed]
2. Sarmento, H.; Figueiredo, A.; Lago-Peñas, C.; Milanovic, Z.; Barbosa, A.; Tadeu, P.; Bradley, P.S. The Influence
of tactical and situational variables on offensive sequences during elite football matches. J. Strength Cond.
Res. 2018, 32, 2331–2339. [CrossRef] [PubMed]
3. Santos, P.; Lago-Peñas, C.; García-García, O. The influence of situational variables on defensive positioning
in professional soccer. Int. J. Perform. Anal. Sport 2017, 17, 212–219. [CrossRef]
4. Castellano, J.; Casamichana, D.; Lago-Peñas, C. The use of match statistics that discriminate between
successful and unsuccessful soccer teams. J. Hum. Kinet. 2012, 31, 139–147. [CrossRef]
5. Lago-Ballesteros, J.; Lago-Peñas, C. Performance in team sports: Identifying the keys to success in soccer. J.
Hum. Kinet. 2010, 25, 85–91. [CrossRef]
6. Castellano, J.; Casamichana, D. What are the differences between first and second divisions of Spanish
football teams? Int. J. Perform. Anal. Sport 2015, 15, 135–146. [CrossRef]
7. Fernández-Navarro, J.; Fradua, L.; Zubillaga, A.; McRobert, A.P. Influence of contextual variables on styles
of play in soccer. Int. J. Perform. Anal. Sport 2018, 18, 1–14. [CrossRef]
8. Fernández-Navarro, J.; Fradua, L.; Zubillaga, A.; Ford, P.R.; McRobert, A.P. Attacking and defensive styles of
play in soccer: Analysis of Spanish and English elite teams. J. Sport Sci. 2016, 34, 2195–2204. [CrossRef]
9. Gómez, M.A.; Mitrotasios, M.; Armatas, V.; Lago-Peñas, C. Analysis of playing styles according to team
quality and match location in Greek professional soccer. Int. J. Perform. Anal. Sport 2018, 18, 986–997.
[CrossRef]
10. Lago-Peñas, C.; Gómez-Ruano, M.; Yang, G. Styles of play in professional soccer: An approach of the Chinese
Soccer Super League. Int. J. Perform. Anal. Sport 2018, 17, 1073–1084. [CrossRef]
11. Courneya, K.; Chelladurai, P. A model of performance measures in baseball. J. Sport Exerc. Psychol. 1991, 13,
16–25. [CrossRef]
12. Hewitt, A.; Greenham, G.; Norton, K. Game style in soccer: What is it and can we quantify it? Int. J. Perform.
Anal. Sport 2016, 16, 355–372. [CrossRef]
13. Lago-Peñas, C.; Gómez-Ruano, M.; Megías-Navarro, D.; Pollard, R. Home advantage in football: Examining
the effect of scoring first on match outcome in the five major European leagues. Int. J. Perform. Anal. Sport
2016, 16, 411–421. [CrossRef]
14. Tenga, A.; Mortensholm, A.; O’Donoghue, P. Opposition interaction in creating penetration during match
play in elite soccer: Evidence from UEFA champions league matches. Int. J. Perform. Anal. Sport 2017, 17,
802–812. [CrossRef]
15. O’Donoghue, P. Interacting Performances Theory. Int. J. Perform. Anal. Sport 2009, 9, 26–46. [CrossRef]
16. Pappalardo, L.; Cintia, P. Quantifying the relation between performance and success in soccer. Adv. Complex
Syst. 2018, 21, 1750014. [CrossRef]
17. Gollan, S.; Katia, F.; Norton, K. Characterising game styles in the English Premier League using the “moments
of play” framework. Int. J. Perform. Anal. Sport 2018, 18, 998–1009. [CrossRef]
18. Castellano, J.; Alvarez-Pastor, D. Defensive use of the interaction space in soccer. RICYDE Rev. Int. Cienc.
Deporte 2013, 9, 126–136. [CrossRef]
19. Ghasemi, A.; Zahediasl, S. Normality tests for statistical analysis: A guide for non-statisticians. Int. J.
Endocrinol. 2012, 10, 486–489. [CrossRef]
20. Bartlett, M.S. A note on multiplying factors for various chi-squared approximations. J. R. Stat. Soc. B 1954,
16, 296–298.
21. Kaiser, H.F. The application of electronic computers to factor analysis. Educ. Psychol. Meas. 1960, 20, 141–151.
[CrossRef]
22. Hopkins, W.G. A New View of Statistics. Internet Society for Sport Science, 2000. Available online:
http://www.sportsci.org/resource/stats/ (accessed on 8 January 2018).
23. Williams, S.; Trewartha, G.; Cross, M.J.; Kemp, S.P.; Stokes, K.A. Monitoring what matters: A systematic
process for selecting training-load measures. Int. J. Perform. Anal. Sport 2017, 12, 101–106. [CrossRef]Int. J. Environ. Res. Public Health 2019, 16, 5090 13 of 13
24. Carling, C.; Le Gall, F.; McCall, A.; Nédélec, M.; Dupont, G. Squad management, injury and match
performance in a professional soccer team over a Championship winning season. Eur. J. Sport Sci. 2015, 15,
573–582. [CrossRef] [PubMed]
25. Carling, C. Interpreting physical performance in professional soccer match-play: Should we be more
pragmatic in our approach? Sports Med. 2013, 43, 655–663. [CrossRef] [PubMed]
26. Tenga, A.; Holme, I.; Ronglan, L.T.; Bahr, R. Effects of match location on playing tactics for goal scoring in
Norwegian professional soccer. J. Sport Sci. 2010, 33, 89–108.
27. Low, B.; Boas, G.V.; Meyer, L.; Lizaso, E.; Hoitz, F.; Leite, N.; Gonçalves, B. Exploring the effects of
deep-defending vs high-press on footballers’ tactical behaviour, physical and physiological performance: A
pilot study. Mot. Rev. Educ. Fis. 2018, 24, 1–7. [CrossRef]
28. Pic, M. Temporal consistencies in two champion teams of European football? Retos 2018, 34, 94–99.
29. Liu, H.; Yi, H.; Gimenez, J.-V.; Gomez, M.A.; Lago-Peñas, C. Performance profiles of football teams in the
UEFA Champions League considering situational efficiency. Int. J. Perform. Anal. Sport 2015, 15, 371–390.
[CrossRef]
30. Collet, C. The possession game? A comparative analysis of ball retention and team success in European and
international football, 2007–2010. J. Sports Sci. 2013, 31, 123–136. [CrossRef]
31. Castellano, J.; Alvarez-Pastor, D.; Figueira, B.; Coutinho, D.; Sampaio, J. Identifying the effects from the
quality of opposition in a Football team positioning strategy. Int. J. Perform. Anal. Sport 2013, 13, 822–832.
[CrossRef]
32. Konefal, M.; Chmura, P.; Zajac, ˛ T.; Chmura, J.; Kowalczuk, E.; Andrzejewski, M. Evolution of technical
activity in various playing positions, in relation to match outcomes in professional soccer. Biol. Sport 2019,
36, 181–189. [CrossRef] [PubMed]
33. Aquino, R.; Garganta, J.; Manechini, J.P.V.; Bedo, B.L.S.; Puggina, E.F. Effects of match situational variables
on possession: The case of England Premier League season 2015/16. Motriz 2017, 23, 6–11. [CrossRef]
34. Kempe, M.; Vogelbein, M.; Memmert, D.; Nopp, S. Possession vs. direct play: Evaluating tactical behavior in
Elite Soccer. Int. J. Sports Sci. 2014, 4, 35–41.
35. Bush, M.; Barnes, C.; Archer, D.T.; Hogg, B.; Bradley, P.S. Evolution of match performance parameters
for various playing positions in the English Premier League. Hum. Mov. Sci. 2015, 39, 1–11. [CrossRef]
[PubMed]
36. Morgans, R.; Adams, D.; Mullen, R.; Sacramento, J.; McLellan, C.; Williams, M. A Comparison of Physical
and Technical Match Performance of a Team Competing in the English Championship League and Then the
English Premier League following Promotion. Int. J. Sports Sci. Coach. 2015, 10, 543–549. [CrossRef]
© 2019 by the authors. Licensee MDPI, Basel, Switzerland. This article is an open access
article distributed under the terms and conditions of the Creative Commons Attribution
(CC BY) license (http://creativecommons.org/licenses/by/4.0/).You can also read