ALASKA 2021 - Area Wide Optimization Program - Individual Program Background Information - ASDWA
←
→
Page content transcription
If your browser does not render page correctly, please read the page content below
Area Wide Optimization Program

      Individual Program
   Background Information
         ALASKA 2021
Name of Agency: Alaska Department of Environmental Conservation--Drinking
Water Program

Official Recognition of AWOP
Please provide the AWOP start date and describe any official recognition of AWOP in agency
newsletters, web pages, awards programs, annual meetings, etc.

Program Started in 2000 and slowly increased scope until about 2015/2016. At its
peak the program had several staff fully trained to conduct CPEs and at least one
training CPE per year was scheduled. Status component inspections (SCIs) of the
majority of our surface water treatment systems were conducted. Since then, the
program activity has significantly decreased due to numerous factors, including
staff changes, retirements, and State funding constraints. We are trying to
maintain and slowly build up capacity as resources allow.

Official Adoption of AWOP Goals
Please describe when and how AWOP goals were adopted by your agency and communicated to the
water systems.

No current AWOP goals have been officially adopted.

National Optimization Goals adopted by your PWSS Program – Check all that apply:
(refer to Attachment I for descriptions of the NOLT optimization goals.)

Water Treatment Plants

   Microbial (Turbidity): Raw Water____ Individual Settled____ CFE__X__ IFE__X__

   Post BW w/FTW__X__ Post BW wo/FTW____ Disinfection (CT) __X__

   DBPs (TTHM/HAA5): Plant Effluent____ Enhanced Coagulation __X__ Disinfection __X__
Chloramine Application: Ammonia Control____ Dosing (Chlorine & Ammonia) ____

Distribution Systems

   Individual Site DBPs ____ Long Term System DBPs____ Tank Operations____

   Secondary Disinfection, Free Chlorine ____

   Secondary Disinfection, Chloramines (monochloramine, Ammonia & Nitrite) ____

Description of Current AWOP Team Members and Responsibilities
Please provide the name, position/title, description of AWOP duties and approximate FTE that each
team member spends on AWOP. Also indicate who serves as the AWOP team lead/point of contact.
Example: Nevel O. Meter, District Engineer, PBT trainer, ~ 0.3 FTE

NAME:                                       RESPONSIBLE FOR:

Johnny Mendez, P.E.                                  Informal Program Technical Lead/POC
Engineer II                                          Represent AK in Reg. 10 AWOP
Fairbanks Engineering Coordinator                    Participate in inspections (CPE, SCI)

DW Engineers State Wide (11) Technical Assistance
                                                     Participate in inspections (CPE, SCI)

Description of Former AWOP Team Members:
Please provide the name of former AWOP team members, and their reason for leaving the team. This
information is for historical purposes and also to support networking as AWOP continues to expand.

NAME:                                       REASON for LEAVING the AWOP:
Vanessa Wike, P.E. Working for Engineering Consulting Firm
Lee Johnson, P.E. Retired
Scott Forgue, P.E. Retired
For Your Program, Please Provide the Following (if available):
Inventory of State-Wide Treatment Facilities1, ** Number
Rapid rate filtration treatment plants2,3 74
Utilizing static settling without tubes or plates
Utilizing static settling with tubes or plates 14
Utilizing sludge blanket clarification (upflow, pulsator) 1
Utilizing contact adsorption clarification 2
Utilizing sludge recirculation (including ballasted clarification)
Utilizing DAF, or other alternative clarification process
Utilizing direct/in-line filtration 57
Utilizing packaged filtration (package plants)
Slow sand filter plants 2
Diatomaceous earth filter plants 1
Membrane treatment plants 28
Bag or cartridge filtration plants 84
Primary disinfectant
Free chlorine 189
Chloramines
Ozone 2
UV 14
Secondary disinfectantFree chlorine 16
Chloramines 2
1
Limited to surface water treatment plants (includes surface, GUDI, blended sources).
2
All surface water treatment plants, except cartridge, membrane and slow sand.
3
When a plant utilizes multiple treatment processes or configurations identified below, please
include them all in this inventory, e.g., a package plant that utilizes a CAC will be included as a rapid
rate plant using CAC and packaged filtration.
**The numbers provided above are estimates, based on our limited, but
improving, tracking
**AK considers package plants conventional, and pressure sand filters as direct
filtration
AWOP Vision:
Please describe the vision for your AWOP
To promote adoption of optimization treatment goals in order to improve public health protection.
Participate in AWOP activities when possible to maintain proficiency, support staff training and
professional growth, so we can provide better technical assistance and technology transfer to our public
water systems.
Status Component Implementation:
Please describe status component activities that are implemented in your agency, e.g., (are water
systems ranked according to public health risk and how is this information used; how is water system
data integrity ensured):
Currently focusing on improving and maintaining inventory of surface water treatment systems as they
are modified or newly constructed. Although COVID-19 has hampered travel for the past year and a half.
Targeted Performance Improvement (TPI) Implementation:
Please list all activities that are implemented as TPI activities in your state, e.g., CPEs, PBT, Enhanced
Sanitary Surveys, technical assistance, other):
Covid-19 has limited travel and we have focused on Technical assistance that can be delivered via long-
distance.AWOP Maintenance Component Implementation: Integrate Please check the following areas where AWOP has been integrated into the PWSS Program: Plan Reviews __X__ Permitting __X___ Capacity Development_____ Operator Training___ __ Technical Assistance __X___ DWSRF Prioritization_____ Enforcement_____ Sanitary Surveys____ Other(identify)________________________________________________________ Enhance Please describe any AWOP enhancements that have been implemented in your program. One example could include modifying status component criteria Have begun promoting optimization goals for new surface water membrane treatment plants. Have also promoted reporting of disinfection CT by providing tailored spreadsheets to operators so they can more easily calculate daily CT in their Monthly Operator Reports. Sustain Please describe any activities that you implement to sustain your agency’s AWOP. Some examples could include efforts to promote and incentivize AWOP (e.g., publish regular newsletter, awards program, AWOP participation = higher ranking for grant/loan funding, etc.). Continue to participate in Region 10 AWOP meetings/workshops as time/resources allow. Look into options/opportunities for training up engineering staff in conducting CPEs. Lessons Learned: Please list “lessons learned” that you feel would be helpful to other programs, e.g., how to build and maintain internal support, how to integrate AWOP into your PWSS program, etc). If you are new to AWOP, please list a question or concern you’d like to know more about. Our knowledge of systems, increases each time we can perform a status component inspection. Our staff have learned the importance and need to improve/promote data quality in monitoring data provided by water systems. Improving our knowledge of the operational status of systems can help us
in the future to target our efforts at technical assistance based on, for instance, PWSs that are ready for
optimization tools, and systems that may need significant help just meet minimum regulatory
requirements.

            Area Wide Optimization Program
Individual Program
Background Information
2021Name of Agency: Drinking Water Services is in the Center for Health Protection of the Public Health Division within the Oregon Health Authority. Official Recognition of AWOP Please provide the AWOP start date and describe any official recognition of AWOP in agency newsletters, web pages, awards programs, annual meetings, etc. Oregon's program started in 2003. AWOP activities are included as part of our Capacity Development Work Plan and are reported on in the Annual State Capacity Development Program Implementation Report to EPA R10 each year. AWOP staff are routinely engaged to develop enhancement to primacy program implementation activities and operator training in order to promote optimization as a tool to ensure on-going compliance. There is a website that addresses optimization at www.healthoregon.org/swt. Official Adoption of AWOP Goals Please describe when and how AWOP goals were adopted by your agency and communicated to the water systems. AWOP goals were adopted in 2003 and communicated via direct mailings, conference presentations, and trainings provided by DWS Staff. The goals are also communicated during water system surveys, which include the following questions concerning turbidity monitoring:
National Optimization Goals adopted by your PWSS Program – Check all that apply:
(refer to Attachment I for descriptions of the NOLT optimization goals.)

Water Treatment Plants

   Microbial (Turbidity): Raw Water__X__ Individual Settled__X__ CFE___XX_ IFE____

   Post BW w/FTW__X__ Post BW wo/FTW_X___ Disinfection (CT) __X__

   DBPs (TTHM/HAA5): Plant Effluent____ Enhanced Coagulation____ Disinfection____
Chloramine Application: Ammonia Control____ Dosing (Chlorine & Ammonia) ____

Distribution Systems

   Individual Site DBPs ____ Long Term System DBPs____ Tank Operations____

   Secondary Disinfection, Free Chlorine ____

   Secondary Disinfection, Chloramines (monochloramine, Ammonia & Nitrite) ____

Modifications to the national goals or other optimization goals utilized by your Agency:

Please describe any modified AWOP goals and/or any additional optimization goals adopted by your
agency and communicated to the water systems.

There are draft optimization goals and guidelines for slow sand filters on-line at:

www.oregon.gov/oha/PH/HEALTHYENVIRONMENTS/DRINKINGWATER/OPERATIONS/TREATMENT/Docu
ments/slowsand/draftoptgoals.pdf

Optimization goals for conventional and direct filtration plants are on-line at:

www.oregon.gov/oha/PH/HEALTHYENVIRONMENTS/DRINKINGWATER/OPERATIONS/TREATMENT/Docu
ments/AWOPFactSheetOct2009.pdf

The conventional and direct filtration goals are summarized in the table below:
Description of Current AWOP Team Members and Responsibilities
        Please provide the name, position/title, description of AWOP duties and approximate FTE that each
        team member spends on AWOP. Also indicate who serves as the AWOP team lead/point of contact.
        Example: Nevel O. Meter, District Engineer, PBT trainer, ~ 0.3 FTE

                (Note that if you submitted this information in 2019, that information is being provided and if
                there are no changes, simply indicate “no change” in this section.)

        Note changes – Since the 2019 National AWOP Meeting Joe Carlson (Data Management and Compliance
        Assurance Unit Manager) retired and the position was subsequently filled by Samina Panwhar. James
        Nusrala has also retired as of July 16, 2021 and his position is currently vacant. Finally, Phebe Howe was
        hired in October 2020 to take over the role of Capacity Development Coordinator from Debra Lambeth,
        who remains within DWS, but focused on the State Revolving Loan Fund (SRF) and related
        Environmental Review responsibilities associated with SRF loans.

                              Drinking Water Services Manager (effective February 6, 2017).
                              Oversees the entire Drinking Water Services program in support of AWOP activities.
David Emme
Tony Fields                   Planning Protection and Certification Unit Manager.
                              Oversees the Capacity Development and Operator Certification programs (among others) in
                              support of AWOP activities.
Kari Salis                    Technical Services Unit – Region 1 Manager.
                              Oversees the activities field staff in Region 1, the AWOP Coordinator, and the Region 1 Core
                              AWOP Team members in support of AWOP activities.
Casey Lyon                    Technical Services Unit – Region 2 Manager.
                              Oversees the activities of field staff in Region 2, including the Region 2 Core AWOP Team member
                              in support of AWOP activities.
Samina Panwhar                Data Management and Compliance Assurance Unit Manager.
                              Oversees enforcement and compliance functions and the entry and management of data housed
                              in SDWIS/STATE, which is used to develop AWOP program reports and Status Component Scores.
Phebe Howe (new to this       Natural Resource Specialist 3
role January 2021)            Capacity Development Coordinator.
                              Integrates AWOP activities into the Capacity Development Program
Evan Hofeld                   Environmental Engineer 3
(AWOP Coordinator - 0.25      Develops/Maintains the Status Component, PBT, and other operator training opportunities.
FTE)
Vacant                        Environmental Engineer 3
(AWOP Core Team               AWOP Core Team Member – Region 1.
Member - 0.25 FTE) – (fmly    Oversees development of Technical On-site Assistance Process, contributes to on-line resources,
James Nusrala)                and participates in AWOP field events and operator trainings.
Jay MacPherson                Environmental Engineer 3
(AWOP Core Team               AWOP Core Team Member – Region 2.
Member - 0.25 FTE)            Contributes to the Technical On-site Assistance Process and participates in AWOP field events and
                              operator trainings.
Rebecca Templin               Environmental Engineer 3
(AWOP Core Team               AWOP Core Team Member – Region 2.
Member - 0.25 FTE)
Contributes to the Technical On-site Assistance Process and participates in AWOP field events and
operator trainings.
Description of Former AWOP Team Members:
Please provide the name of former AWOP team members, and their reason for leaving the team. This
information is for historical purposes and also to support networking as AWOP continues to expand.
(Note that if you submitted this information in 2019, that information is being provided and if there are
no changes, simply indicate “no change” in this section.)
1. Of note is the retirement of Joseph Carlson and James Nusrala since the
2019 National AWOP meeting.
NAME: REASON for LEAVING the AWOP:
James Nusrala, AWOP Core Team Member Retired July 16, 2021
Debra Lambeth Shifted responsibilities from Capacity
Development Coordinator at the end of 2020 to
focus on the State Revolving Loan Fund (SRF)
and related Environmental Review
responsibilities associated with SRF loans
Joseph Carlson, Data Management and Compliance Retired since the 2019 National AWOP meeting.
Assurance Unit Manager
Dave Leland, Drinking
Water Services Manager Retired after 34 years in December 2016
Fred Kalish, AWOP Core Team Member Retired July 1, 2015
Casey Lyon, AWOP Core Team Member Became Region 1 Technical Services Manager in
2014 – he is still involved in AWOP as much as
he can.
Chris Hughes, Unit Manger Retired in 2011.
George Waun, Capacity Development and AWOP Left State Employment in 2008.
Coordinator
Shane Phelps, AWOP Core Team Member Left State Employment prior to 2008.
Brian Rigwood, AWOP Core Team Member Left State Employment prior to 2008.2. Inventory of State-wide Treatment Facilities:
Inventory of State-Wide Treatment Facilities1 Number
Rapid rate filtration treatment plants2,3 105
Utilizing static settling without tubes or plates Unknown
Utilizing static settling with tubes or plates Unknown
Utilizing sludge blanket clarification (upflow, pulsator) Unknown
Utilizing contact adsorption clarification Unknown
Utilizing sludge recirculation (including ballasted clarification) Unknown
Utilizing DAF, or other alternative clarification process Unknown
28
(77 of 105 rapid rate plants
have some type of clarification
process (e.g., static basin,
Utilizing direct/in-line filtration CAC, tube, plate, etc.)
Utilizing packaged filtration (package plants) Unknown
Slow sand filter plants 31
Diatomaceous earth filter plants 1
Membrane treatment plants 42
Bag or cartridge filtration plants 52 (includes 1 bag filter)Total Number of Filtration Plants (SW or GU sources) 231
Primary disinfectant*
Free chlorine 262**
Chloramines 0
Ozone 5
UV 23
Secondary disinfectant
Free chlorine 262
Chloramines 3
*Disinfection data is a count of disinfection treatment process codes in SDWIS/STATE for SW/GU system (excludes
consecutive systems). Some plants may be counted for more than one disinfection process as some plants may have multiple
oxidants used for primary disinfection depending upon the target pathogen.
**Includes treatment plants with gas chlorine, sodium hypochlorite, and mixed oxidants.
1
Limited to surface water treatment plants (includes surface, GUDI, blended sources).
2
All surface water treatment plants, except cartridge, membrane and slow sand.
3
When a plant utilizes multiple treatment processes or configurations identified below, please include
them all in this inventory, e.g., a package plant that utilizes a CAC will be included as a rapid rate plant
using CAC and packaged filtration.AWOP Vision:
Please describe the vision for your AWOP
The object of Oregon’s Area Wide Optimization Program is to educate water system operators in
optimization principles with the goal of improving public health protection. This is accomplished by
imparting an understanding of not only the basics of water treatment and the multiple barrier concepts,
but also providing the opportunity and incentive to learn and engage in optimizing treatment beyond
regulatory standards and using data to monitor performance and identify areas for improvement.
The long-term vision is to have all conventional and direct filtration plants meet the optimization goals.
Status Component Implementation:
Please describe status component activities that are implemented in your agency, e.g., (are water
systems ranked according to public health risk and how is this information used; how is water system
data integrity ensured):
In general, systems with higher status component scores are prioritized when scheduling on-site
assistance activities, however, on-site assistance may also be provided upon request.
Status component scores are determined as follows:
• All data used to develop status component scores is housed in SDWIS/STATE.
• The data housed in SDWIS/STATE includes:
o Filter type code;
o Population served;
o Maximum daily combined filter effluent turbidity data reported by water
systems on the monthly operating report (along with compliance turbidity data
and CT parameters).
o Violations;
o A score entered based on information gathered during water system surveys and
treatment plant inspections; and
o TOC data.
• A Microsoft Access database is used to extract the data, calculate and archive system
scores, and generate reports.
• A factor is applied to the data extracted from SDWIS/STATE and the sum of the factors is
used to generate the status component scores. These factors are shown in the status
component criteria shown on the following page.• Medium sized systems are weighted more than very large or very small systems, as they
are deemed to have somewhat limited technical or managerial capacity, but enough
capacity to effectively use information provided by AWOP team members to improve
treatment performance and resolve performance limiting factors.• An example of the list of ranked water systems is shown below, with those systems
having the highest status component scores appearing at the top of the list:
Targeted Performance Improvement (TPI) Implementation:
Please list all activities that are implemented as TPI activities in your state, e.g., CPEs, PBT, Enhanced
Sanitary Surveys, technical assistance, other):
Oregon's TPI activities include:
• Conducting CPEs, on-site technical assistance site visits, and data integrity audits
• Offering the following classes at least once each year worth 0.6 CEU each:
o Essentials of Surface Water Treatment
o Slow Sand Filtration
o Conventional and Direct Filtration
• Conducting PBT (a total of 32 hours of instruction (3.2 CEU) for operators of
conventional and direct filtration plants)
• Provide outreach and information through conference presentations, direct mailings,
and a website (www.healthoregon.org/swt).
• Completing work on implementing slow sand and membrane filtration optimization
goals.
In general, systems with higher status component scores are prioritized when scheduling on-site
assistance activities, however, on-site assistance may also be provided when requested by a water
system.
COVID-19 and Wildfires in 2020 have had an adverse impact on these activities and the “Essentials of
Surface Water Treatment” class was offered for virtual training (the class was pre-recorded and
presented with a live moderator) on only two occasions 2020.AWOP Maintenance Component Implementation: Integrate Please check the following areas where AWOP has been integrated into the PWSS Program: Plan Reviews__X___ Permitting_____ Capacity Development__X___ Operator Training__X___ Technical Assistance__X___ DWSRF Prioritization_____ Enforcement__X___ Sanitary Surveys__X__ Other(identify)________________________________________________________ Enhance Please describe any AWOP enhancements that have been implemented in your program. One example could include modifying status component criteria The following enhancements/tools have been made since the 2017 National AWOP meeting:
1. Enhancements have been made to the water system survey (sanitary survey) process for
membrane filtration and the plan review process was modified to include a calculated LRV using
current operating conditions (termed “LRVambient”).
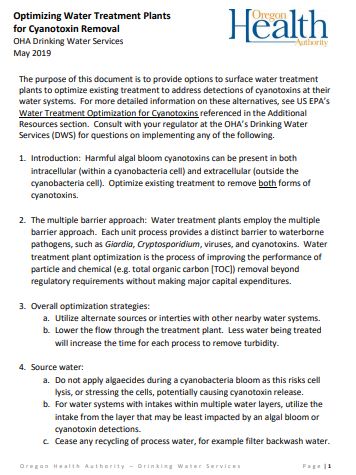
2. Optimization guidance has been developed for treating
cyanotoxins. This guidance titled “Optimizing Water
Treatment Plants for Cyanotoxin Removal” was completed
in May of 2019 and posted, along with USEPA’s Water
Treatment Optimization for Cyanotoxins guidance and the
CyanoTox spreadsheet, to our website at the following
links:
• Optimizing Toxin Removal - All surface water
systems can take steps at their treatment plants to
increase the removal efficiency of cyanotoxins.
• EPA Water Treatment Optimization for Cyanotoxins
• American Water Works Association CyanoTOX
Spreadsheet for Cyanotoxin Removal Rate
Calculation
3. In the fall of 2020 and the spring of 2021, optimization guidance was developed for treating
waters after a wildfire. This guidance was posted on our website at:
• Optimizing Filtration After a Wildfire - February 2021Sustain
Please describe any activities that you implement to sustain your agency’s AWOP. Some examples
could include efforts to promote and incentivize AWOP (e.g., publish regular newsletter, awards
program, AWOP participation = higher ranking for grant/loan funding, etc.).
The knowledge and experience gained as a result of participation in the Region 10 AWOP group has
had a positive impact in sustaining support for AWOP enhancing the following program areas:
Plan Review:
Efforts to optimize conventional, direct, membrane and slow sand filtration systems has led to a
better understanding and review of construction plans among plan review staff. AWOP Core Team
members have been instrumental in revising plan review forms and procedures as a result of the
knowledge and experience gained through participation in AWOP activities.
Capacity Development:
AWOP activities are written into the Capacity Development Work Plan. AWOP Core Team Members
have been instrumental in the development of financial and managerial capacity outreach materials.
Operator Training:
Classes and PBT developed and offered by AWOP staff are used by operators to gain CEU’s that go
towards their operator certification CEU requirements. Operators are also able to obtain CEU's by
attending conference presentations presented by AWOP staff.
Information learned through AWOP is going to be more routinely disseminated through the Drinking
Water Services on-line publication “The Pipeline”. The most recent example of one of these articles
is on-line at the link below:
• Establishing SCADA alarm setpoints for optimization and compliance assurance (4/15/21)
•
Enforcement:
AWOP core team members have recently completed two Comprehensive Performance Evaluations
(CPEs) in late 2013 and early 2015, one of which was required under ESWTRLT1 for individual filter
effluent turbidity exceedances. The training AWOP staff received as a result of participating in AWOP
Region 10 events has prepared Oregon staff to be able to complete these CPE’s in a thorough much
more effective manner.Lessons Learned: Please list “lessons learned” that you feel would be helpful to other programs, e.g., how to build and maintain internal support, how to integrate AWOP into your PWSS program, etc). If you are new to AWOP, please list a question or concern you’d like to know more about. The following lessons have been learned in implementing AWOP in Oregon: 1. Obtain clear expectations and performance measures or benchmarks from management; 2. Ensure criteria used for benchmarks or performance measures are relatively easy to track and can be sustained; 3. Ensure the integrity of turbidity and other status component data early on in the process; 4. Involve as many drinking water staff as possible; 5. Include AWOP as a part of all-staff meetings; 6. Integration into Capacity Development Programs helps to sustain funding and management support for AWOP activities. 7. Attending regular regional meetings and participating in multi-state trainings is crucial to keeping on top of new developments and learning innovative ways to implement AWOP activities. Although implementing these recommendations in Oregon has not been without its challenges, they are important to ensure a more sustainable program that can better serve the overall drinking water program in responding to natural disasters such as wildfires and adapting to pandemic-related budgetary constraints and staffing changes.
Attachment I: Optimization Goals Adopted by the NOLT

    Category                     Goal                 Applies to                               Description

                    Minimum Data Monitoring Goal      Rapid Rate
    Microbial                                          Filtration   ― Record maximum daily raw water turbidity.
                        Raw Water Turbidity              Plants

                                                                    ― Settled water turbidity ≤ 2 NTU in 95% of readings when the
                                                                    annual average raw turbidity is > 10 NTU. Optimization is based
                                                                    on the daily maximum values recorded from all readings.
                                                                    ― Settled water turbidity ≤ 1 NTU in 95% of readings when the
                    Individual Sedimentation Basin                  annual average raw turbidity is ≤ 10 NTU. Optimization is based
                                                      Rapid Rate
    Microbial                                          Filtration   on the daily maximum values recorded from all readings.
                     Performance and Monitoring
                               Goals                     Plants

                                                                    ― Record individual sedimentation basin effluent turbidity
                                                                    readings at intervals of 4-hours or less if taking grab samples, or
                                                                    15 minutes or less for continuous monitoring.

                                                                    ― Combined filter effluent turbidity ≤ 0.10 NTU in 95% of
                                                                    readings. Optimization is based on the daily maximum values
                                                                    recorded from all readings.
                                                                    ― Individual filter effluent turbidity ≤ 0.10 NTU in 95% of
                                                                    readings (excluding 15-minute period following filter backwash).
                                                                    Optimization is based on the daily maximum values recorded
                                                                    from all readings.
                                                                    ―Post backwash individual filter effluent turbidity for filters
                    Individual and Combined Filter                  without filter-to-waste capability: Maximum individual filter
                                                      Rapid Rate    effluent turbidity following backwash ≤ 0.30 NTU and achieve ≤
    Microbial                                          Filtration   0.10 NTU within 15 minutes.
                     Performance and Monitoring
                               Goals                     Plants     ―Post backwash individual filter effluent turbidity for filters
                                                                    with filter-to-waste capability: Minimize individual filter effluent
                                                                    turbidity during filter-to-waste period and record maximum
                                                                    value. Return the filter to service at ≤ 0.10 NTU.

                                                                    ― Record individual and combined filter effluent turbidity
                                                                    readings at intervals of 1-minute or less for continuous
                                                                    monitoring.

                                                                    ―Meet CT requirements to achieve inactivation of Giardia and
                             Disinfection                           viruses plus a system-specific factor of safety.
                                                      Rapid Rate
    Microbial                                          Filtration
                     Performance and Monitoring
                                                         Plants
                               Goals
                                                                    ― Record disinfectant residual, temperature, and pH at
                                                                    maximum daily flow for CT calculations.

                                                       Surface      ―System Specific Targets: Could be a discrete value or range
                      Plant Effluent Disinfection
                                                      Water and     that is based on a running annual average. Recommended goal
                          Byproducts (DBPs)
 Disinfection By-                                                   value/range should be 30% to 50% of long term LRAA goals (e.g.,
                                                     Groundwater
     Product                                                        20-30 ppb for TTHM, 15-20 ppb for HAA5).
                     Performance and Monitoring       Under the
                               Goals                     Direct
                                                     Influence of
Surface ―Collect quarterly TTHM and HAA5 samples at the plant
Water Plants effluent and distribution system compliance sites.
―Meet Stage 1 D/DBP Rule TOC removal requirements for
Surface enhanced coagulation, which are based on source water
Water and alkalinity and TOC levels, or an alternative compliance criterion,
Enhanced Coagulation Groundwater as a running annual average (RAA) of the performance ratio
Disinfection By- Under the (actual TOC removal/required TOC removal) plus a factor of
Product Performance and Monitoring Direct safety of 10% (or performance ratio ≥ 1.1).
Goals Influence of
Surface
Water Plants ―Collect monthly total organic carbon samples for raw and
treated water (only applies to parent systems).
Surface ―Meet CT requirements to achieve inactivation of Giardia and
Water and viruses plus a system-specific factor of safety.
Groundwater
Disinfection
Disinfection By- Under the
Product Performance and Monitoring Goal Direct
Influence of ―Record disinfection residual, temperature, and pH at
Surface maximum daily flow for CT calculations (only applies to parent
Water Plants systems).
―Individual Site Goal: Quarterly Maximum Locational Running
Annual Average TTHM/HAA5 values not to exceed 70/50 ppb.
Parent and ―Long-Term System Goal: Average of Maximum Locational
Consecutive Running Annual Average TTHM/HAA5 values not to exceed
Disinfection Byproducts 60/40 ppb (the average of the last 8 quarters cannot exceed
Water
Distribution 60/40 ppb).
Performance and Monitoring Systems that
System
Goals Utilize any
Secondary
Disinfectant ―For systems in compliance with the TTHM and HAA5 MCLs,
collect quarterly DBP samples at all compliance locations; for
systems not in compliance, collect monthly samples.
―Maintain ≥ 0.20 mg/L free chlorine residual at all monitoring
sites in the distribution system, at all times.
Parent and
Consecutive
Disinfection Water ―Monitoring should be performed at least monthly, but more
Free Chlorine frequently at critical times (i.e., summer months).
Systems that
Distribution Performance and Monitoring Utilize Free
System Goals ―Sample locations should include bacteriological and DBP
Chlorine as a
Secondary compliance sites, all distribution system entry points (e.g., plant
Disinfectant effluent, consecutive system connections), all tanks (preferably
while draining), and identified critical sites base on investigative
sampling (minimum of one critical site in each quadrant of the
system, four sites total).
―Maintain a detectable free ammonia residual in the plant
Parent and effluent ≤ 0.10 mg/L as NH3-N.
Disinfection: Ammonia Control Consecutive
Plants that Water
Utilize Performance and Monitoring Systems that
Chloramine ―Monitor free ammonia at least once per day in the plant
Goals Utilize
effluent.
Chloramine
as a • The monitoring frequency may be adjusted based on the
variability observed over an extended period of time.Secondary • Free ammonia may be monitored in the source water
Disinfectant periodically (e.g., once per week) to assess variability.
Parent and
Consecutive
Water
―Maintain a chlorine-to-nitrogen mass ratio between 4.5:1 and
Plants that Operational Guideline Systems that
5.0:1 (or chlorine-to-ammonia mass ratio between 3.7:1 and
Utilize Utilize
Chlorine and Ammonia Dosing 4.1:1), which should result in a detectable free ammonia in the
Chloramine Chloramine
plant effluent that is ≤ 0.10 mg/L as NH3-N.
as a
Secondary
Disinfectant
―Maintain ≥ 1.50 mg/L monochloramine residual at all
monitoring sites in the distribution system, at all times, to
provide a disinfection barrier against both microbial
contamination and nitrification prevention.
Parent and ―Monitor monochloramine, free ammonia, and nitrite in the
Consecutive distribution system and at the entry points (to establish a
Disinfection: Monochloramine Water baseline).
Chloramine and Nitrification-Related Systems that
Parameters • Monochloramine and free ammonia should be monitored
Distribution Utilize
System Chloramine at all sample locations.
Performance and Monitoring
as a • Nitrite should be monitored at sample locations where
Goals
Secondary monochloramine is ≤ 1.50 mg/L; nitrate may also be
Disinfectant monitored, to further assess nitrification.
• Sample locations should include bacteriological and DBP
compliance sites, all distribution system entry points (e.g.,
plant effluent, consecutive system connections), all tanks
(preferably while draining), and identified critical sites base
on investigative sampling (minimum of one critical site in
each quadrant of the system, four sites total).
• Monitoring should be done at least monthly, but more
frequently at critical times (e.g., summer months).
Parent and
Consecutive
―Maintain an average turnover time < 5 days; or establish and
Water
maintain a water turnover rate at each storage facility.
Operational Guidelines Systems that
Distribution ―Maintain good mixing (i.e., Performance Ratio ≥ 1) at all times;
Contain
System Tank Operations for tanks where the PR cannot be calculated, adequate mixing
Storage
(i.e., uniform water quality) should be confirmed by alternate
Tanks (any
means (e.g., tank profiling/water quality sampling).
secondary
disinfectant)Area Wide Optimization Program
WASHINGTONIndividual Program
Background Information
2021Name of Agency: Washington State Dept of Health-Office of Drinking Water
Official Recognition of AWOP
Please provide the AWOP start date and describe any official recognition of AWOP in agency
newsletters, web pages, awards programs, annual meetings, etc.
Start date: 2001.
The Covid-19 pandemic of the past 18 months significantly impacted our program. During 2020, and into
2021, multiple ODW staff were reassigned to contribute to DOH’s response, chiefly in case investigation
and contact tracing. During this period, our in-person AWOP trainings and meetings were cancelled due
to social distancing requirements. We continued outreach to individual systems and are presently
working with two of the large-system PBT participants to evaluate jar test modifications and
enhancements.
During the period, we started a new semi-monthly water newsletter, focusing on subjects of interest to
surface water operators, engineers, and ODW staff. We intend to address, on average, two hot topics
(e.g. seasonally relevant) per edition. The first edition, covered SCADA and HAB and contained “interest
photos” from a couple of systems. Other new or updated/revised documents on optimization-specific
topics, included:
Adjust Operations for Cold Weather (DOH 331-649) – a fact sheet
Calculating Chemical Dose-Liquid Alum (DOH 331-650) – a worksheet (revised)
Dealing with Algal Blooms: Time to Make a Plan (DOH 331-654) - Guidance
Diatomaceous Earth (DE) Optimization Goals (DOH 331-648) - Guidance
Filter Backwash (DOH 331-624) – Operational Tips
Monitoring Surface Water Treatment Processes (DOH 331-620) - Guidance
Slow Sand Optimization Goals (DOH 331-601) – Guidance (updated)
Standard Operating Procedures for WTPs (DOH 331-647) - FAQs
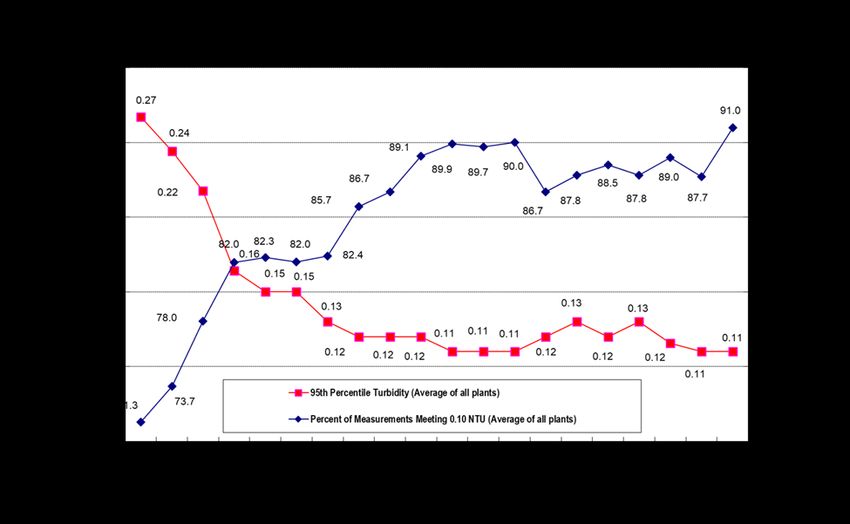
Our “X-graph,” updated for the 2020 operating year (see below), was recently published on our website.We are currently making final preparations for releasing treatment optimization program “TOP” awards to systems which have continuously met the TOP performance criteria goals. Official Adoption of AWOP Goals Please describe when and how AWOP goals were adopted by your agency and communicated to the water systems. Goals were formally adopted in 2003. A letter and laminated poster containing the goals was sent to every rapid rate filter plant. Treatment Optimization Program (TOP) (wa.gov)
National Optimization Goals adopted by your PWSS Program – Check all that apply:
(refer to Attachment I for descriptions of the NOLT optimization goals.)

Water Treatment Plants

   Microbial (Turbidity): Raw Water____ Individual Settled _X_ CFE_X_ IFE__X_

   Post BW w/FTW_X_ Post BW wo/FTW_X_ Disinfection (CT) _X__

   DBPs (TTHM/HAA5): Plant Effluent____ Enhanced Coagulation____ Disinfection____

   Chloramine Application: Ammonia Control____ Dosing (Chlorine & Ammonia) ____

Distribution Systems

   Individual Site DBPs ____ Long Term System DBPs____ Tank Operations____

   Secondary Disinfection, Free Chlorine ____

   Secondary Disinfection, Chloramines (monochloramine, Ammonia & Nitrite) ____

Modifications to the national goals or other optimization goals utilized by your Agency:

Please describe any modified AWOP goals and/or any additional optimization goals adopted by your
agency and communicated to the water systems.

We track and analyze max daily CFE reported by 100% of our rapid rate surface water systems on their
MORs. Data is used to monitor performance, target follow-up, and as basis for our Treatment
Optimization Program recognition awards.

Description of Current AWOP Team Members and Responsibilities
Please provide the name, position/title, description of AWOP duties and approximate FTE that each
team member spends on AWOP. Also indicate who serves as the AWOP team lead/point of contact.
Example: Nevel O. Meter, District Engineer, PBT trainer, ~ 0.3 FTE

(Note that if you submitted this information in 2019, that information is being provided and if there are
no changes, simply indicate “no change” in this section.)

    1. AWOP Team Co-Leader - Nancy Feagin: Program oversight and reporting, Data
       collection, management and evaluation, Coordination of regional and HQ staff, data
       integrity activities and training, represent WA in Region 10 AWOP; ~0.8 FTE
    2. AWOP Team Co-Leader - Stephen Baker: Technical Assistance, CPE consultant,
       Operator coaching, Represent WA in Region 10 AWOP; ~0.7 FTE
    3. Regional Engineers & Surface Water Specialists: Technical assistance, data integrity, CPE
       participant:
           a. Russsell Mau, Jeff Johnson; Eastern Regional Office; ~0.1 FTE/ea
           b. Nick Fitzgerald; Southwest Regional Office; ~0.1 FTE
           c. Jolyn Leslie; Northwest Regional Office ~0.2 FTE
    4. Other regional engineers: Technical assistance, data integrity, CPE participant; ~0.4 FTE
       in total
    5. Technical support: Steve Deem; ~0.1 FTE
    6. Data entry: Kerry Herd; ~0.1 FTE
    7. Management Sponsor: Derek Pell

Description of Former AWOP Team Members:
Please provide the name of former AWOP team members, and their reason for leaving the team. This
information is for historical purposes and also to support networking as AWOP continues to expand.

(Note that if you submitted this information in 2019, that information is being provided and if there are
no changes, simply indicate “no change” in this section.)

    3. Teresa Walker, Southwest Regional Office – Retired from state service
    4. Nathan Ikehara, technical assistance & data integrity – Now regional engineer in Eastern
       Regional Office, ODW
    5. Sam Perry, technical assistance & training – Now at EPA R.10
Inventory of State-Wide Treatment Facilities1 Number
Rapid rate filtration treatment plants2,3 57
Utilizing static settling without tubes or plates 7
Utilizing static settling with tubes or plates 16
Utilizing sludge blanket clarification (upflow, pulsator) 0
Utilizing contact adsorption clarification 19
Utilizing sludge recirculation (including ballasted clarification) 2
Utilizing DAF, or other alternative clarification process 2
Utilizing direct/in-line filtration
Utilizing packaged filtration (package plants) 35
Slow sand filter plants 19
Diatomaceous earth filter plants 5
Membrane treatment plants 14
Bag or cartridge filtration plants 34
Primary disinfectant
Free chlorine 132
Chloramines 0
Ozone 4
UV 5
Secondary disinfectant
Free chlorine
Chloramines 1
1
Limited to surface water treatment plants (includes surface, GUDI, blended sources).
2
All surface water treatment plants, except cartridge, membrane and slow sand.
3
When a plant utilizes multiple treatment processes or configurations identified below, please include
them all in this inventory, e.g., a package plant that utilizes a CAC will be included as a rapid rate plant
using CAC and packaged filtration.AWOP Vision:
Please describe the vision for your AWOP
• Protect public health and reduce the risk of waterborne disease by assuring that surface
water treatment systems are properly designed, constructed, operated and maintained.
• All systems meet regulatory requirements and understand that compliance with regulatory
requirements is the minimum performance level to attain.
• Surface water systems produce and provide optimal water quality from their facilities.Status Component Implementation:
Please describe status component activities that are implemented in your agency, e.g., (are water
systems ranked according to public health risk and how is this information used; how is water system
data integrity ensured):
We use maximum daily CFE data to rank systems into three groups:
Category 1 – meet optimization goals. 95th % CFE ≤ 0.10 NTU and Max CFE ≤ 0.30 NTU
Category 2 – 95th % CFE ≤ 0.20 NTU and Max CFE = 0.31 - 0.80 NTU or 95th % CFE = 0.11 - 0.20 NTU and
Max CFE ≤ 0.80 NTU
Category 3 - Category 3 - 95th % CFE > 0.20 NTU or Max CFE > 0.80 NTU
Category 1 plants are considered for our recognition program
Category 2 plants are targeted for technical assistance and training, including PBT and CPEs
Category 3 plants are targeted for compliance action – these often have violations.
Targeted Performance Improvement (TPI) Implementation:
Please list all activities that are implemented as TPI activities in your state, e.g., CPEs, PBT, Enhanced
Sanitary Surveys, technical assistance, other):
• CPE
• PBT*
• CTA*
• Training
• Sanitary Survey
• Recognition (Awards) Program
*All on-site AWOP enhancement activities temporarily put on hold for 2020-2021, as ODW staff assisted
during DOH’s Covid-19 pandemic response.AWOP Maintenance Component Implementation:
Integrate
Please check the following areas where AWOP has been integrated into the PWSS Program:
Plan Reviews_X__ Permitting_____ Capacity Development__X___ Operator Training_X__
Technical Assistance_X__ DWSRF Prioritization_X____ Enforcement_____ Sanitary Surveys_X_
Other(identify)________________________________________________________
Enhance
Please describe any AWOP enhancements that have been implemented in your program. One
example could include modifying status component criteria
• Published slow sand filtration optimization guidelines
• Distributed DE filtration optimization guidelines
• Notified systems re: required mandatory back-up for certified operator position
• Coordinated SCADA reliability with minimum staffing requirementsSustain
Please describe any activities that you implement to sustain your agency’s AWOP. Some examples
could include efforts to promote and incentivize AWOP (e.g., publish regular newsletter, awards
program, AWOP participation = higher ranking for grant/loan funding, etc.).
• Awards program
• Presentations and reports to internal staff and management
• Articles in regular internal and external newsletters
• Presentations at local conferences and training
Lessons Learned:
Please list “lessons learned” that you feel would be helpful to other programs, e.g., how to build and
maintain internal support, how to integrate AWOP into your PWSS program, etc). If you are new to
AWOP, please list a question or concern you’d like to know more about.
We have found that the most effective strategy for Category 2 (nearly optimized) systems is to help
them achieve optimized performance using training and technical assistance.
The most effective strategy for Category 3 (bottom-performing) systems appears to be best achieved: 1)
through restructuring; 2) by replacement of surface water with a different type of source (groundwater
or purchased) or; 3) through the development of a more community-appropriate and sustainable
technology such as membrane or slow sand filtration. Category 3 plants are typically found to be
serving a service population of 3300, or less.Attachment I: Optimization Goals Adopted by the NOLT
Category Goal Applies to Description
Minimum Data Monitoring Goal Rapid Rate
Microbial Filtration ― Record maximum daily raw water turbidity.
Raw Water Turbidity Plants
― Settled water turbidity ≤ 2 NTU in 95% of readings when the
annual average raw turbidity is > 10 NTU. Optimization is based
on the daily maximum values recorded from all readings.
― Settled water turbidity ≤ 1 NTU in 95% of readings when the
Individual Sedimentation Basin annual average raw turbidity is ≤ 10 NTU. Optimization is based
Rapid Rate
Microbial Filtration on the daily maximum values recorded from all readings.
Performance and Monitoring
Goals Plants
― Record individual sedimentation basin effluent turbidity
readings at intervals of 4-hours or less if taking grab samples, or
15 minutes or less for continuous monitoring.
― Combined filter effluent turbidity ≤ 0.10 NTU in 95% of
readings. Optimization is based on the daily maximum values
recorded from all readings.
― Individual filter effluent turbidity ≤ 0.10 NTU in 95% of
readings (excluding 15-minute period following filter backwash).
Optimization is based on the daily maximum values recorded
from all readings.
―Post backwash individual filter effluent turbidity for filters
Individual and Combined Filter without filter-to-waste capability: Maximum individual filter
Rapid Rate effluent turbidity following backwash ≤ 0.30 NTU and achieve ≤
Microbial Filtration 0.10 NTU within 15 minutes.
Performance and Monitoring
Goals Plants ―Post backwash individual filter effluent turbidity for filters
with filter-to-waste capability: Minimize individual filter effluent
turbidity during filter-to-waste period and record maximum
value. Return the filter to service at ≤ 0.10 NTU.
― Record individual and combined filter effluent turbidity
readings at intervals of 1-minute or less for continuous
monitoring.
―Meet CT requirements to achieve inactivation of Giardia and
viruses plus a system-specific factor of safety.
Disinfection
Rapid Rate
Microbial Filtration
Performance and Monitoring
Goals Plants
― Record disinfectant residual, temperature, and pH at
maximum daily flow for CT calculations.
Surface ―System Specific Targets: Could be a discrete value or range
Water and that is based on a running annual average. Recommended goal
Plant Effluent Disinfection Groundwater value/range should be 30% to 50% of long term LRAA goals (e.g.,
Byproducts (DBPs) 20-30 ppb for TTHM, 15-20 ppb for HAA5).
Disinfection By- Under the
Product Direct
Performance and Monitoring
Goals Influence of
Surface ―Collect quarterly TTHM and HAA5 samples at the plant
Water Plants effluent and distribution system compliance sites.―Meet Stage 1 D/DBP Rule TOC removal requirements for
Surface enhanced coagulation, which are based on source water
Water and alkalinity and TOC levels, or an alternative compliance criterion,
Enhanced Coagulation Groundwater as a running annual average (RAA) of the performance ratio
Disinfection By- Under the (actual TOC removal/required TOC removal) plus a factor of
Product Performance and Monitoring Direct safety of 10% (or performance ratio ≥ 1.1).
Goals Influence of
Surface
Water Plants ―Collect monthly total organic carbon samples for raw and
treated water (only applies to parent systems).
Surface ―Meet CT requirements to achieve inactivation of Giardia and
Water and viruses plus a system-specific factor of safety.
Groundwater
Disinfection
Disinfection By- Under the
Product Performance and Monitoring Goal Direct
Influence of ―Record disinfection residual, temperature, and pH at
Surface maximum daily flow for CT calculations (only applies to parent
Water Plants systems).
―Individual Site Goal: Quarterly Maximum Locational Running
Annual Average TTHM/HAA5 values not to exceed 70/50 ppb.
Parent and ―Long-Term System Goal: Average of Maximum Locational
Consecutive Running Annual Average TTHM/HAA5 values not to exceed
Disinfection Byproducts 60/40 ppb (the average of the last 8 quarters cannot exceed
Water
Distribution 60/40 ppb).
Performance and Monitoring Systems that
System
Goals Utilize any
Secondary
Disinfectant ―For systems in compliance with the TTHM and HAA5 MCLs,
collect quarterly DBP samples at all compliance locations; for
systems not in compliance, collect monthly samples.
―Maintain ≥ 0.20 mg/L free chlorine residual at all monitoring
sites in the distribution system, at all times.
Parent and
Consecutive
Disinfection Water ―Monitoring should be performed at least monthly, but more
Free Chlorine frequently at critical times (i.e., summer months).
Systems that
Distribution Performance and Monitoring Utilize Free
System ―Sample locations should include bacteriological and DBP
Goals Chlorine as a
Secondary compliance sites, all distribution system entry points (e.g., plant
Disinfectant effluent, consecutive system connections), all tanks (preferably
while draining), and identified critical sites base on investigative
sampling (minimum of one critical site in each quadrant of the
system, four sites total).
―Maintain a detectable free ammonia residual in the plant
Parent and effluent ≤ 0.10 mg/L as NH3-N.
Consecutive
Water
Disinfection: Ammonia Control
Plants that Systems that
Utilize Utilize ―Monitor free ammonia at least once per day in the plant
Performance and Monitoring
Chloramine Chloramine effluent.
Goals
as a
Secondary • The monitoring frequency may be adjusted based on the
variability observed over an extended period of time.
Disinfectant
• Free ammonia may be monitored in the source water
periodically (e.g., once per week) to assess variability.Parent and
Consecutive
Water
―Maintain a chlorine-to-nitrogen mass ratio between 4.5:1 and
Plants that Operational Guideline Systems that
5.0:1 (or chlorine-to-ammonia mass ratio between 3.7:1 and
Utilize Utilize
Chlorine and Ammonia Dosing 4.1:1), which should result in a detectable free ammonia in the
Chloramine Chloramine
plant effluent that is ≤ 0.10 mg/L as NH3-N.
as a
Secondary
Disinfectant
―Maintain ≥ 1.50 mg/L monochloramine residual at all
monitoring sites in the distribution system, at all times, to
provide a disinfection barrier against both microbial
contamination and nitrification prevention.
Parent and ―Monitor monochloramine, free ammonia, and nitrite in the
Consecutive distribution system and at the entry points (to establish a
Disinfection: Monochloramine Water baseline).
and Nitrification-Related
Chloramine Systems that
Parameters • Monochloramine and free ammonia should be monitored
Distribution Utilize
System Chloramine at all sample locations.
Performance and Monitoring
as a • Nitrite should be monitored at sample locations where
Goals
Secondary monochloramine is ≤ 1.50 mg/L; nitrate may also be
Disinfectant monitored, to further assess nitrification.
• Sample locations should include bacteriological and DBP
compliance sites, all distribution system entry points (e.g.,
plant effluent, consecutive system connections), all tanks
(preferably while draining), and identified critical sites base
on investigative sampling (minimum of one critical site in
each quadrant of the system, four sites total).
• Monitoring should be done at least monthly, but more
frequently at critical times (e.g., summer months).
Parent and
Consecutive
―Maintain an average turnover time < 5 days; or establish and
Water
maintain a water turnover rate at each storage facility.
Operational Guidelines Systems that
Distribution ―Maintain good mixing (i.e., Performance Ratio ≥ 1) at all times;
Contain
System Tank Operations for tanks where the PR cannot be calculated, adequate mixing
Storage
(i.e., uniform water quality) should be confirmed by alternate
Tanks (any
means (e.g., tank profiling/water quality sampling).
secondary
disinfectant)You can also read