Hydrodynamics of tropical tidal lake waters, Lake Siombak, Medan, Indonesia
←
→
Page content transcription
If your browser does not render page correctly, please read the page content below
Hydrodynamics of tropical tidal lake waters, Lake
Siombak, Medan, Indonesia
1,2Ahmad Muhtadi, 3Fredinan Yulianda, 3Mennofatria Boer, 3Majariana
Krisanti, 4Aldiano Rahmadya, 5Santoso
1
 Doctoral Program in Aquatic Resources Management, Graduate School of IPB University,
 Bogor, Indonesia; 2 Aquatic Resources Management, Faculty of Agriculture, University of
 Sumatera Utara, Medan, Indonesia; 3 Aquatic Resources Management, Faculty of
 Fisheries and Marine Sciences, IPB University, Bogor, Indonesia; 4 Research Center for
 Limnology, Indonesian Institute Science, Cibonong, Indonesia; 5 Master Sciences in
 Marine Sciences & Technology, Graduate School of IPB University, Bogor, Indonesia.
 Corresponding author: A. Muhtadi, ahmad.muhtadi@usu.ac.id

 Abstract. Lake Siombak is one of the tidal lakes found in Indonesia. This lake is unique because it is
 affected by sea tides, 6 km from the coast. This study aims to provide a detailed picture of the
 hydrodynamic characteristics and profiles of temperature and salinity of the lake Siombak. The primary
 data collected were tidal data measured every hour for 15 days at the mouth of the lake. The depth
 measurements were performed using the Garmin 585 echosounder. Measurements of temperature and
 salinity were conducted using a thermometer and refractometer at depths decreasing by 1 m, perpendicular
 to the mouth of the lake to the east. The temperature and salinity data were representing the rainy and
 dry seasons. Tidal measurements at Lake Siombak were diurnal mixed. From the tidal measurement results
 in Lake Siombak, the highest water level elevation (HAT) obtained was 2.66 m during the rainy season and
 2.23 m during the dry season. The lowest water level (LAT) was -0.43 m during the rainy season and
 -0.04 m during the dry season. Mean Sea Levels (MSL) measured were 1.12 m during the rainy season
 and 1.1 m during the dry season. The highest water level at full moon or neap tide (HHWL) was 2.34 m
 during the rainy season and 1.95 m during the dry season, with the lowest water level at full moon (LLWL)
 of -0.11 m during the rainy season and 0.24 m during drought. This difference in elevation results in
 differences in lake depth, and other morphometric parameters, but also in temperature and salinity. Thus,
 there are dynamics and fluctuations in the characteristics of the lake waters on a daily or monthly basis
 (tidal cycle), and even seasonal fluctuations (rain and dry seasons).
 Key Words: bathymetry, coastal lake, Medan, morphometry, water level.

Introduction. A tidal lake is a coastal lake with water conditions influenced by the
dynamics of tides. However, in Indonesia, the term is very rare to find because related
publications are hardly found, and this type of lake is rare. ‘Tidal lake’ is another term for
a coastal lake or coastal lagoon (Kjerfve 1994; Tagliapietra et al 2010). The coastal lagoon
is a lake with waters directly connected to the sea by the effects of tides, waves, rivers,
and wind (Kjerfve 1994; Tagliapietra et al 2010). Furthermore, Kjerfve (1994) states that
the body of water is connected to the ocean through a narrow door/channel (inlet), which
is choked, restricted, and 'leaky'. Thus, the condition of the aquatic environment is very
dynamic and fluctuating due to the influence of tidal dynamics (Tagliapietra et al 2010;
Muhtadi et al 2017).
 Some tidal lakes in the world include Lagoa dos Patos and Lagoa de Araruama,
Brazil, Lake St. Lucia, South Africa, the Coorong, Australia, Lake Songkla, Thailand, Laguna
de Terminos, Mexico, Pontchartrain Lake, USA, Mississippi Sound, USA, and Wadden Zee,
The Netherlands-Denmark (Kjerfve 1994). Some tropical tidal lakes examples are Lake
Chilika, India (Mahanty et al 2016), Nokue Lagoon, Benin (Zandagba et al 2016), Teluk
Belukar Lagoon (Nias-Indonesia) (Hasudungan et al 2008), and Lake Siombak, in Medan
City, North Sumatra Province (Muhtadi et al 2017).

AACL Bioflux, 2020, Volume 13, Issue 4.
http://www.bioflux.com.ro/aacl
 2014
Lake Siombak is a tidal lake located on the coast of Medan City, North Sumatra
Province, Indonesia. The lake was formed from the sand dredging construction of the
Belawan-Medan-Tanjung Morawa (Belmera) toll road in the late 1980s (Muhtadi et al
2016). This lake is unique because the flow of rivers entering the lake through the Belmera
River along 7.5 km from Belawan (Malacca Strait) is still affected by tides. The existence
of tidal dynamics certainly affects the dynamics of the lake water level (discharge/volume),
water quality (physics and chemistry) (Kjerfve 1994; Elshemy et al 2016; Zandagba et al
2016; Muhtadi et al 2017), and aquatic organisms (flora and fauna) (Jaikumar et al 2011;
Reis-Filho et al 2011; Muhtadi et al 2016; Pérez-Ruzafa et al 2019). Therefore, aquatic
organisms that inhabit Lake Siombak are unique and distinctive. The uniqueness of Lake
Siombak ecosystem can be seen from the presence of mangroves growing on various sides
of the lake border, such as Nipah (Nypa frutican), mangrove apple (Sonneratia caseolaris),
and others, with a total of 14 species (Leidonald et al 2019; Muhtadi et al 2020a). Some
aquatic organisms found in Lake Siombak include brackish organisms, such as mullet
(Osteomugil engeli), striped-nose halfbeak (Zenarchopterus buffonis), Indo Pacific tarpon
(Megalops cyprinoides), rice fish (Oryzias javanicus), mudskipper (Periopthalmonodon
schlosseri), milkfish (Chanos chanos), shrimp (Parapenaeopsis coromandelica), and
mangrove crabs (Scylla serrata), while freshwater fish found consist of tilapia (Oreochromis
niloticus and Oreochromis mossambicus), Panchax minnow (Aplocheilus panchax), catfish
(Clarias bathracus), snakehead (Channa striata), and shortfin eel (Anguilla bicolor)
(Muhtadi et al 2016; Leidonald et al 2019).
 Thus, the uniqueness of the lake has the potential to be developed for fisheries and
ecotourism. Therefore, to maintain the preservation of the tidal lake, proper management
efforts are needed. In the framework of planning and implementing management
strategies, it is necessary to study an understanding of the physical, chemical, geological,
and ecological dynamics of the tidal lake (Kjerfve 1994). The study related to water
dynamics is the first step in determining appropriate and sustainable management. For this
reason, this study aims to describe in detail the characteristics of the dynamics of the
waters of Lake Siombak, based on the influence of tides.

Material and Method

Study sites. The research was carried out in Lake Siombak, Medan City, North Sumatra
Province, Indonesia (Figure 1). The tools used in this study were GPS Garmin Oregon 65
with an accuracy up to 3 m, Garmin 585 echosounder, and a boat. Tidal data collection
was carried out in February 2019 (representing the dry season) and compiled from the
results of the study done by Muhtadi et al (2017). Furthermore, temperature, salinity and
discharge data were conducted from September 2018 to August 2019.

Data collection and processing. Tidal data retrieval was done by reading the scale on
the tide staff submerged in seawater once every hour, within 15 days. The tide staff can
reach the highest and lowest tide levels. They were easily observed and still flooded at
minimum ebb tides. The tidal staff installation must be perpendicular and unchanging
(fixed) (Lisnawati et al 2013).
 Lake mapping was done by tracking the edge of the lake using the Global Positioning
System (GPS), assisted with digitization from Google Earth. Bathymetry survey was done
by measuring depth using an echo sounder placed in the hull of the boat. Mapping was
done by making a path that could represent all waters. On this track, depth data were
recorded at a distance of 3 m. The measurements were tabulated.
 Temperature and salinity are measured from the surface to the bottom of the water
at 1 m intervals. Temperature was determined using a thermometer and salinity was
measured with a refractometer. Water sampling for temperature and salinity
measurements was done using Van Dorn water samples. 9 sampling points of temperature
and salinity were established from the west (inlet/outlet) to the east (Figure 1). The water
discharge was determined by measuring the current in and out at the inlet/outlet of the
lake. The instrument used to measure the current was a flow meter. Flow measurements

AACL Bioflux, 2020, Volume 13, Issue 4.
http://www.bioflux.com.ro/aacl
 2015
were carried out on the surface, middle and bottom of the waters and on the edges and
middle of the mouth of the lake.

 Figure 1. Research Location, Lake Siombak, Medan Indonesia

Data analysis. Data analysis includes tide and water level measurements, bathymetry,
morphometry, water discharge and water retention time, spatial and temporal distribution,
vertical salinity and temperature.
 To find out the type of tides, calculations to obtain the numbers or tidal constants
(Tidal Constant/Formzahl) were performed by using the admiralty method formula as
follows (Dietrich 1963):

 AK1 + AO1
F=
 AM2 + AS2

Where: F - Formzahl or tidal constants; AK1 - amplitude from the average small single tidal
waves affected by moon and sun declination; AO1 - amplitude from a small single daily
tidal wave affected by solar declination; AM2 - amplitude from the average small double
daily tidal wave influenced by the moon; AS2 - amplitude of the average small double daily
tidal wave of affected by the sun.
 For bathymetry, data rows were represented by measurement stations, while data
columns were represented by data identity (ID), time of collection, coordinates, altitude,
and water depth. Table data were converted into a spatial form and processed using the
ArcMap Geographic Information System (GIS) program equipped with the 3D Analyst
extension (Ridoan et al 2016). The basic map used the Indonesian Fine Map of Indonesia
from 2018. Furthermore, the analyzed data included lake morphometry representing
surface and subsurface (Hakanson 1981).
 Lake morphometry was measured following Hakanson (1981), by surface and sub-
surface dimensions. The surface dimensions consist of: maximum length (Lmax), expressed
in meters and obtained by measuring the farthest distance between two lakeside stations;

AACL Bioflux, 2020, Volume 13, Issue 4.
http://www.bioflux.com.ro/aacl
 2016
the effective maximum length (Le), expressed in meters and obtained by measuring the
farthest distance between two stations on the surface of the lake without crossing the
island; the maximum width (Wmax), expressed in meters and obtained by measuring the
distance of the two furthest stations on the edge of the surface of the lake that are drawn
perpendicular to Lm; the maximum effective width (We), expressed in meters and obtained
by measuring the distance of the two furthest stations on the edge of the lake surface that
is drawn perpendicular to Le; surface area (Ao), expressed in hectares is the surface area
of the lake. The surface area on the bathymetry map is the area of the polygon using the
ArcMap program. The shoreline length (SL), expressed in meters or kilometers is the
circumference of the lake. SL is measured from a bathymetry map using ArcMap software.
The average width (W ̅ ) is expressed in meters, and it is the ratio between the surface area
of the lake (Ao) with the maximum length, presented in the following formula:

̅ = Ao/Lmax
W

Where: W ̅ - average width (m); Ao - lake surface area (m2); Lmax - maximum length (m).
 The shoreline development index (SDI) is an index illustrating the relationship
between SL and surface area. If SDI is higher than 2, then the shape of the water body is
irregular. If SDI is between 1 and 2, the shape of the water body is an ellipse (subcircular)
and if the SDI is close to 1, it indicates a regular circle shape. The SDI is calculated as
follows:

 SL
SDI =
 √22 x Ao
 2

 7

Where: SDI - shoreline development index; SL - the lenght of coastline (m); Ao - the lake
surface area (m2).
 The subsurface dimension values, including the total volume of lake water (V),
expressed in m3, are represented by the amount of water held by the lake. The volume
calculated using the Maximum Depth (Zmax) feature expressed in meters is the depth of
the lake at the deepest station. Direct measurement was done by echosounder. The
average depth ( ̅ ) is obtained from the average depth measurement in the lake. The
relative depth is calculated in terms of the equation:

 Zmax x √n
Zr = x100%
 20 x √Ao

Where: Zr - relative depth (m); Zmax - maximum depth (m); Ao - lake surface area (m2); n
- number of contours.
 Average slope (S ̅) is expressed in % and describes the extent of shallow water:

 1 1 1 Zmax
S̅ = x ( xLo + L1 + ⋯ + Ln − 1 + xLn) x × 100
 n 2 2 Ao

Where: S̅ - average slope (%); L - length of the circumference of each contour (m); n -
number of contours in the map; Zmax - maximum depth (m); Ao - lake surface area (m2).
 The development of lake volume (Volume Development/VD) is a measure that
describes the basic shape of a lake in general. If the value is less than 1, the lake has a
somewhat conical shape, while if it is higher than 1, the shape is flattened. The
development of lake volume is calculated in the form of an equation:

 Ao x Z̅
VD =
 1
 x(Zmax x Ao)
 3

AACL Bioflux, 2020, Volume 13, Issue 4.
http://www.bioflux.com.ro/aacl
 2017
Where: Ao - lake surface area (m2); ̅ - average depth (m); Zmax - maximum depth (m).
 Water discharge (Q) is the volume of water that flows during a specified time
interval. Discharge measurements are made at high tide (water in) and at low tide (water
out) in the same channel, at a door for water that permits circulation in and from the
Waterfall River. Discharge (Q), expressed in m3 s-1, is the volume of water that flows during
a specified time interval. Discharge is calculated by the following formula (Wetzel 2001):

Q=AxV

Where: Q - water discharge (m3 hour-1); A - area of cross section of water channel (m2);
V - current speed (m s-1).
 Water retention time (Rt), expressed in days, is the retention time of water in a
lake. Rt is calculated as follows (Wetzel 2001):

Rt=V/Q

Where: Rt - water retention time (hours); V - total volume (m3); Q - water discharge (m3
s-1).
 The distribution and dynamics of temperature and salinity are presented in a
transverse profile. Temperature and salinity profiles are processed using ODV (Ocean Data
View).

Results and Discussion

Tide and water level. Tidal characteristics at Lake Siombak refer to semi diurnal tides in
the rainy season (F value=0.21) and mixed, mainly semi diurnal tides in the dry season (F
value=0.29). Thus, in the rainy season in Lake Siombak, there are 2 high tides and 2 low
tides daily, with relatively the same height. In the dry season the mixture of the 2 types is
prominent. Tides in this lake are influenced by the tides of the Pacific Ocean, entering from
the South China Sea (Wyrtki 1961) through the Belawan coast.
 Tidal measurements in Lake Siombak showed a highest water level elevation (HAT)
of 2.66 m when it rains and 2.23 m during the dry season. The lowest water level (LAT) is
-0.43 m during rainy season and -0.04 m during dry season. MSL measured is 1.12 m
when it rains and 1.1 m during the dry season. The highest water level during full tide or
dead moon (HHWL) is 2.34 m during rainy season and 1.95 m during dry season. The
lowest water during full tide or dead moon (LLWL) is -0.11 m during rainy season and 0.24
m during drought. Thus, on a daily or monthly basis (tidal cycle), including seasonal
elevation, changes occur at Lake Siombak. In detail, the water elevation characteristics at
Lake Siombak are presented in Table 1 and a description of the daily dynamics for one tidal
cycle are presented in Figure 2.

 Table 1
 Analysis of important tidal elevations on Lake Siombak

 September (rainy season) February (dry season)
 Design water level Symbol
 LAT (m) MSL (m) LAT (m) MSL (m)
 Highest Astronomical Tide HAT 2.66 1.54 2.23 1.13
 Higher High-Water Level HHWL 2.34 1.22 1.95 0.86
 High Water Spring HWS 2.19 1.08 1.86 0.76
 Mean High Water Spring MHWS 1.95 0.84 1.73 0.63
 Mean High Water Level MHWL 1.92 0.80 1.68 0.58
 Mean Sea Level MSL 1.12 0.00 1.10 0.00
 Mean Low Water Level MLWL 0.31 -0.80 0.52 -0.58
 Mean Low Water Spring MLWS 0.28 -0.84 0.46 -0.63
 Chart Datum Level CDL 0.04 -1.08 0.33 -0.76
 Lower Low Water Level LLWL -0.11 -1.22 0.24 -0.86
 Lowest Astronomical Tide LAT -0.43 -1.54 -0.03 -1.13

AACL Bioflux, 2020, Volume 13, Issue 4.
http://www.bioflux.com.ro/aacl
 2018
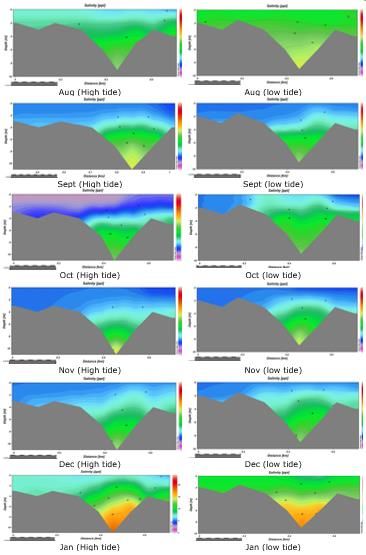
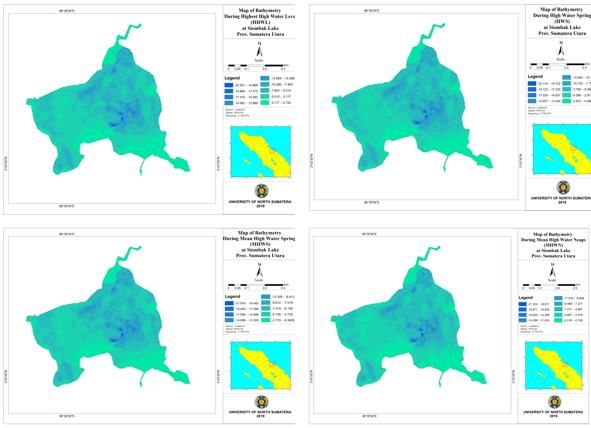
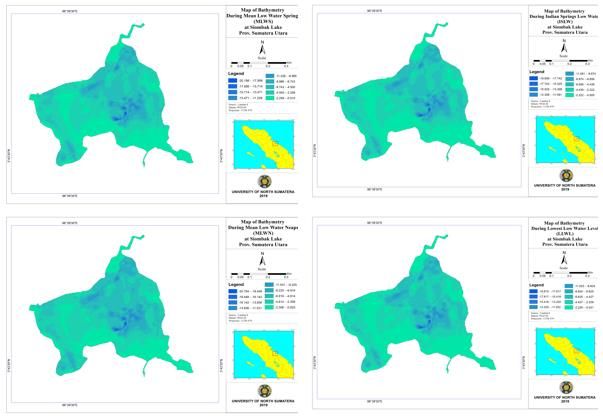
Figure 2. Tides in the study site. MSL - mean sea level; A - dry season; B - rainy season
 (source: Muhtadi et al 2017).

Bathymetry. Based on the bathymetry map, there are differences in depth in accordance
with changes in water elevation. This is clearly due to the tidal dynamics in Lake Siombak.
The deepest area is in the middle to the east, and reaches more than 17 m. The innermost
locations are marked in dark blue and shallow locations are marked in green (Figures 3, 4,
and 5). The shallowest locations (
while other coastal natural lakes show a more orderly form of bathymetry (Hasudungan et
al 2008; Umgiesser et al 2014; Panda et al 2015; Mahanty et al 2016; Zandagba et al
2016).

Morphometry. Lake Siombak has a surface area of 29.72 ha, with a shoreline reaching
3.67 km (Table 2). This lake has the same Lmax and Le at 694.56 m. Wmax and We are also
the same, equal to 610.46 m. The average width of Lake Siombak is 427.92 m. Lake
Siombak is classified as a very small lake, in an area of less than 100 ha and a volume of
less than 106 m3 (Straskraba & Tundisi 1999).
 Lake Siombak is much smaller compared to other tidal lakes in Indonesia, like Bay
of Belukar Lagoon (Nias), which reaches 47.4 Ha (Hasudungan et al 2008). The area of
several other tropical tidal lakes include: 1042 km2 for Songkhla Lagoon (Ganasut et al
2005); 100 km2 for Lake Laguna (Philippines) (Herrera et al 2014); 815 km 2 during the
dry season and 992 km2 during the rainy season for Chilika Lagoon (Mohanty et al 2001);
150 km2 for Nokoue Lake (Benin) (Zandagba et al 2106). Some other tidal lakes in the
Mediterranean region (sub-tropical) are smaller, reaching no more than 500 km2 ha, with
the Faro Lagoon (Italy) with an area of only 0.26 km2 (Umgiesser et al 2014).

 Figure 3. Bathymetry map at high tide.

AACL Bioflux, 2020, Volume 13, Issue 4.
http://www.bioflux.com.ro/aacl
 2020
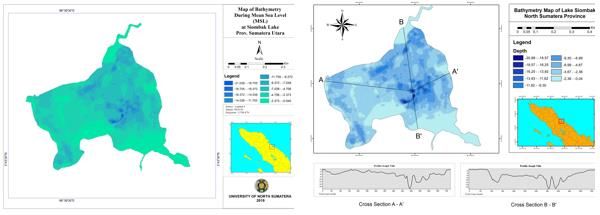
Figure 4. Bathymetry map at low tide.

 Figure 5. Bathymetry map at mean sea level (left) and cross sectioan of depth profile
 (right).

The SDI of Lake Siombak is 1.90. This shows that the body shape of Lake Siombak waters
approach the regular (ellipse) shape. The SDI value is close to the value in the Teluk
Belukar Lagoon, which is 1.6 (Hasudungan et al 2008). The greater SDI value shows the
increasingly irregular shape of the lake. The longer is the lake perimeter and the greater
the SDI value is, the greater the input received by the lake is. Wetzel (2001) states that
SDI can be used to describe the level of productivity of a water. The level of aquatic
productivity is closely related to the increasingly irregular shape of the lake. A high SDI
value of a lake can indicate a higher lake productivity. The result of the calculation of
surface dimensions in the Lake Siombak is presented in Table 2.

AACL Bioflux, 2020, Volume 13, Issue 4.
http://www.bioflux.com.ro/aacl
 2021
Table 2
 Surface dimensions of Lake Siombak

 Parameters Unit Value
 Maximum length (Lmax) m 694.56
 Efective length (Le) m 694.56
 Maximum width (Wmax) m 610.46
 Effective width (We) m 610.46
 Average width (W) m 427.92
 Shore line development index (SDI) 1.90
 Shore line length (SL) m 3668.68
 Cover area (Ao) m2 297206.22

Lake Siombak is a shallow lake. The average depth of the lake ranges from 2.96 m to 5.26
m when it rains, and 2.96 m to 4.90 m when it is dry (Tables 3 and 4). However, the
maximum depth of Lake Siombak reaches 20.23 m to 22.54 m during the rainy season and
20.36 m to 22.29 m during the dry season. Even though the lake is small and shallow, the
depth of Lake Siombak is considered deep compared to other tidal lakes. For example
Songkhla Lagoon is only about 1.2-1.8 m deep (Ganasut et al 2005); Lake Laguna
(Philippines) is 2.5 m deep (Herrera et al 2014); Chilika Lagoon is 1.7 m deep (Mohanty et
al 2001); Lake Nokoue (Benin) is 2.5 m deep (Zandagba et al 2106), while other tidal lakes
in the Mediterranean region (sub-tropical) reach a depth of only 0.91-4.84 m, except Faro
Lagoon and Taranto (Italy) reaching a depth of 10.75-11.85 m (Umgiesser et al 2014).
Therefore, based on tracking various scientific reports, it is indicated that, in general,
coastal lakes are shallow, with a depth less than 5 m.

Water discharge and water retention time. Discharge of incoming water (tides) at
Lake Siombak is between 18.84 and 67.53 m3 s-1 in the rainy season, and between 34.44
and 43.01 m3 s-1 during the dry season. The flow of water out (ebb) is 15.54-29.31 m3 s-1
when it rains, and 32.6-35.62 m3 s-1 during drought. The flow of water that enters Lake
Siombak is affected by tides, so the input of water to Lake Siombak is very dependent on
tides. Therefore, the volume of water will depend on tidal conditions in Belawan waters.
The volume of Lake Siombak is different between high and low tides (Table 3).
 The flow of water that enters and exits Lake Siombak is also affected by the season.
In the rainy season, the flow of incoming water is greater than that during the dry season.
In addition to the push of tidal water, there is also the influence of a greater river discharge
in the rainy season compared to the dry season. However, the discharge of water that
comes out in the rainy season is lower than that in the dry season, because the water
discharge that comes out of the lake is likely to be obstructed by the large river water
discharge in the rainy season.
 The retention time of water in Lake Siombak is between 13.37 and 25.22 hours in
the rainy season and between 11.00 and 12.03 hours in the dry season. Rt of Lake Siombak
is short because of tidal dynamics. Rt in the rainy season is longer than that in the dry
season. This is caused by the water discharge that comes out at low tide during the rainy
season due to the obstacles of large water discharges (due to rain) in the Falls River. In
the dry season, the discharge is higher because the obstacles have diminished (and may
no longer exist).
 The retention time in Lake Siombak is very much different from natural lakes (inland
lake), which can reach years and even decades (Nontji 2017). Lukman & Ridwansyah
(2009, 2010) reported that Rt in Lake Poso and Lake Toba were 7.21 years and 81.24
years, respectively. The higher the value of Rt is, the longer the retention time of water in
a lake is, so the level of organic matter or nutrients in the water will be greater (Mitchell
et al 2017). The Rt of Lake Siombak is considered short because it is affected by tides, so
that the opportunity for organic matter to accumulate in Lake Siombak water is only 11 to
25 hours. In addition, the low Rt does not allow the material suspended in the waters to
settle. This is also reported by Umgiesser et al (2014), in a coastal lagoon in the
Mediterranean Sea with low Rt.

AACL Bioflux, 2020, Volume 13, Issue 4.
http://www.bioflux.com.ro/aacl
 2022
Table 3
 Subsurface dimensions of lake Siombak in the rainy and dry seasons

 Average depth during elevation
 Parameter Unit
 HHWL HWS MHWS MHWN MSL MLWN MLWS ISLW LLWL
 Rainy season
 Mean depth m 4.37 5.26 5.11 4.87 4.32 4.04 3.75 3.20 2.96
 Maximum depth m 22.68 22.54 22.30 21.74 21.46 21.17 20.62 20.38 20.23
 Relative depth % 0.62 0.62 0.61 0.60 0.59 0.58 0.57 0.56 0.56
 Average slope % 0.39 0.46 0.15 0.75 0.74 0.73 0.71 0.70 0.69
 Volume development 0.58 0.70 0.69 0.67 0.60 0.57 0.55 0.47 0.44
 Total volume (x106) m3 1.33 1.60 1.60 1.41 1.33 1.26 1.19 1.00 0.97

 Dry season
 Mean depth m 4.90 4.81 4.68 4.31 4.04 3.78 3.41 2.96 3.19
 Maximum depth m 22.29 22.20 22.07 21.70 1.44 21.17 20.80 20.36 20.58
 Relative depth % 0.61 0.61 0.61 0.60 0.59 0.58 0.57 0.56 0.57
 Average slope % 0.38 0.46 0.15 0.74 0.74 0.73 0.71 0.70 0.71
 Volume development 0.66 0.65 0.64 0.60 0.57 0.54 0.49 0.44 0.46
 Total volume (x106) m3 1.41 1.41 1.41 1.33 1.26 1.19 1.05 0.97 1.00
Note: HHWL - highest water level at neap tide; HWS - high water spring; MHWS - mean high water spring; MHWL - mean high water level; MSL - mean sea level; MLWN -
mean low water at neap tide; MLWS - mean low water spring; ISLW - Indian spring low water; LLWL - lowest low water level.

AACL Bioflux, 2020, Volume 13, Issue 4.
http://www.bioflux.com.ro/aacl
 2023
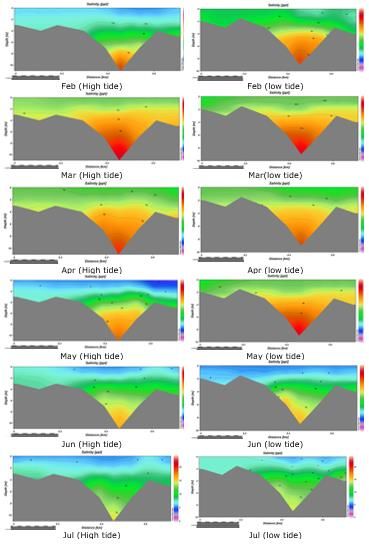
Spatial and temporal distribution, vertical salinity and temperature. In the rainy
season, the surface salinity value (up to 2 m) ranges from 2 to 7 ppt, while at the bottom
it reaches 10 (in depths bigger than 5 m) to 20 ppt (11 m depth). Furthermore, in the dry
season, the surface salinity can reach 10-12 ppt and at the bottom it can reach 15-24 ppt.
This shows that there is a difference in salinity between the surface and the bottom of the
water. Although the coastal lakes are shallow (
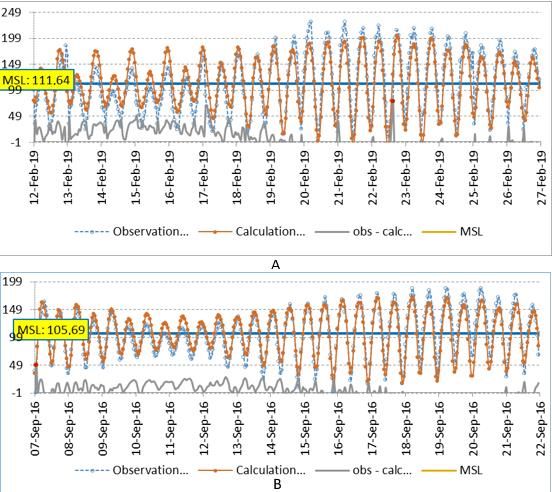
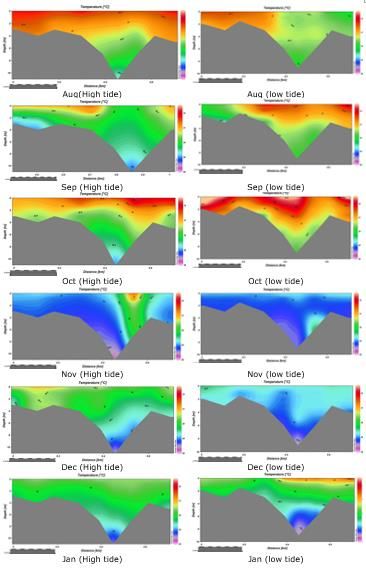
Figure 7. Distribution of salinity in the dry season.

Temperature distribution on the surface of Lake Siombak shows unevenness (Figures 8 and
9). Surface temperature at low tide ranges from 29.1 to 33.20C, while at high tide the
surface temperature ranges between 29 and 33.50C. The highest temperature at each

AACL Bioflux, 2020, Volume 13, Issue 4.
http://www.bioflux.com.ro/aacl
 2025
station is obtained at the time of measurement in the surface layer of water and occurs
when the optimum sunlight is around 12.00 to 14.00 WIB. Consequently, there is no
significant difference in surface temperature between high and low tides. The difference in
temperature on the surface of the water is highly caused by weather factors and time of
measurement. The temperature of a water body is influenced by the season, latitude,
altitude from sea level, time of day, cloud cover and water depth (Effendi 2003; Sinaga et
al 2016).
 More temperature differences occur between the surface and the bottom. The
temperature at the bottom of the water, both in high tide and low tide ranges from 28 to
300C. Thus, there is a 40C change in temperature between the surface and the bottom of
the lake. The low temperature is due to the lower heat content because of lower light
intensity as the depth increases (Sinaga et al 2016).

 Figure 8. Distribution of temperature during rainy season.

AACL Bioflux, 2020, Volume 13, Issue 4.
http://www.bioflux.com.ro/aacl
 2026
Figure 9. Distribution of temperature in the dry season.

Lake Siombak is one of the tropical tidal lakes in Indonesia. Based on tidal studies, the lake
water level elevation is influenced by the tides of Belawan. Tidal elevation differences are
high (>2 m), indicating that the lake waters are very dynamic. Referring to Short (1991),
the tide in Lake Siombak presents mesotidal characteristics, with tidal ranges of 2-4 m.
The elevation difference in Lake Siombak is high (-0.11 to 2.34 m) compared to other tidal

AACL Bioflux, 2020, Volume 13, Issue 4.
http://www.bioflux.com.ro/aacl
 2027
lakes, excepting Lake Laguna (Philippines), which ranges from 0.6 to 4.1 m (Herrera et al
2014). In Lagos and Lekki Lagoons (Nigeria), the difference in elevation is only between
0.3 and 1.3 m (Ahmed 2014), while the elevation in Lake Nokoue ranges between 1.25 m
in high tide and 0.15 m in low tide (Zandagba et al 2016). The elevation in Chilika Lagoon
(India) ranges from 0.52 to 1.02 m in the dry season and between 0.36 and 0.81 m in the
rainy season (Mahanty et al 2016). Ten coastal lagoons in the Mediterranean (sub-tropical)
present a tidal range of only 0.13-0.9 m (Umgiesser et al 2014). Thus, the tidal influence
is strong in Lake Siombak, even though it is far from the coast (7.5 km).
 The difference in elevation is influential on the depth and volume of the lake. The
value of the volume development (VD) of Lake Siombak differs between high and low tides,
and by season. This shows that tides have an effect on the physical aspects of subsurface
dimensions, especially at depth. Likewise, the volume of the lakes will change according to
the amount of water entering and exiting. In this case, the volume of Lake Siombak is
greater in the rainy season 0.97-1.6 million m3 (MSL=1.33 m3) compared to that in the
dry season, of 0.97-1.41 million m3 (MSL=1.26 m3). However, the difference in lake volume
can be considered insignificant between rain and drought. This is more due to the dynamics
of the waters, especially the elevation of the lake water, which is influenced by the tides,
where the elevation of the water level is influenced by the circulation time of the month,
and not based on season.
 The dynamics of water elevation due to tides also have an impact on water quality,
including temperature and salinity. Spatially, the salinity on the surface of Lake Siombak
is almost evenly distributed throughout the lake. This indicates that the tidal effect is
important, affecting the distribution of salinity in Lake Siombak. However, the distribution
of surface temperatures differs spatially based on time of measurement. However, the
distribution of temperature and salinity is vertically different between the surface and the
base layers. The temperature on the surface is higher than that at the bottom, while the
salinity value on the surface is lower than that at the bottom.
 Based on temperature stratification in Lake Siombak, there is no thermocline layer.
Thus, there is no significant temperature difference between the surface and the bottom
of the water. This is due to the low depth of the lake (average depth of 4-6). However,
based on salinity stratification, there is a halocline reported at a depth of 5 m. Therefore,
there is stratification in Lake Siombak between the surface (depth 5 m), making layers difficult to mix. This can be seen from the depth profile (cross
section) in Figure 5 (right) showing that not all areas are fully stirred. In the middle
(towards the left), the area where the deep waters exist acts like a trough, being not
completely stirred. This is clear from the transverse distribution of salinity (Figures 8 and
9), which shows that there is stratification. Thus, the stirring that occurred at Lake Siombak
only occurred at a depth of 1-4 m. However, by looking at the deep area (>5 m), narrow
in the middle to the east, there is a slight stirring. There is generally low lake stratification,
with stirring. This is supported by the low ̅ and Zr values and data indicating that Lake
Siombak has a low level of stability of stratification, so that it will easily experience stirring.
A Zr value less than 2% shows stirring of water mass, characterized by a layer that tends
to be homogeneous and decomposition nutrients from the decomposition zone. This will be
distributed to the epilimnion layer (Mohanty & Panda 2009). Therefore, the depth of the
lake has a very big influence on water quality. This is also related to the presence of stirring
in the lake (Newton & Mudge 2003).
 Lake Siombak is categorized as a very small lake (
base, that can be utilized for benthic growth (Welch 1952; Pratiwi et al 2007; Röderstein
et al 2014; Specchiulli et al 2016).
 The existence of these fluctuations will certainly affect the characteristics of water
quality and the biological community structure of Lake Siombak. Therefore, in the future,
it is necessary to study the effect of tides on the dynamics of water quality and fish
communities in the lake.

Conclusions. Lake Siombak is an open lake with water affected by tides from the sea
(Belawan). Tidal measurement results in Lake Siombak showed the highest water level
elevation (HAT) of 2.66 m when it rains and 2.23 m during the dry season. The lowest
water level (LAT) was -0.43 m during rain and -0.04 m during dry season. MSL measured
are 1.12 m when it rains and 1.10 m during the dry season. The highest water level during
full tide or dead moon (HHWL) is 2.34 m during rain and 1.95 m during dry season. The
lowest water during full tide or dead moon (LLWL) was -0.11 m during rain and 0.24 m
during drought. This difference in elevation results in differences in lake depth, and other
morphometric parameters, as well as temperature and salinity. Thus, there are dynamics
and fluctuations in the characteristics of lake waters on a daily and monthly basis (tidal
cycle) and on a seasonal (rain and dry seasons) basis.

Acknowledgements. The authors gratefully acknowledge that the present research is
supported by the Ministry of Research and Technology and Higher Education of the Republic
of Indonesia. We are for the opportunity given to pursue further study and get awarded a
scholarship at IPB University, Bogor Indonesia. Thank you to Ahyar Pulungan, S.Pi for
helping me to collect data in the field.

References

Ahmed A. S. M., 2014 Hydrodynamic modeling of Lagos and Lekki lagoons. International
 Journal of Advanced Biological Research 4(4):416-427.
Specchiulli A., Scirocco T., D’Adamo R., Cilenti L., Fabbrocini A., Cassin D., Penna P., Renzi
 M., Bastianoni S., 2016 Benthic vegetation, chlorophyllα and physical-chemical
 variables in a protected zone of a Mediterranean coastal lagoon (Lesina, Italy).
 Journal of Coastal Conservation 20:363-374.
Pessoa de Barros G., Marques W. C., de Paula Kirinus E., 2014 Influence of the freshwater
 discharge on the hydrodynamics of Patos Lagoon, Brazil. International Journal of
 Geosciences 5(9):48940, 18 p.
Dietrich G., 1963 General oceanography. Interscience Publishers, New York, 558 p.
Effendi H., 2003 [Water quality study]. Penerbit Kanisius, Jakarta, 258 p. [In Indonesian].
Elshemy M., Khadr M., Atta Y., Ahmed A., 2016 Hydrodynamic and water quality modeling
 of Lake Manzala (Egypt) under data scarcity. Environmental Earth Sciences 75:1329,
 13 p.
Furusato E., Amarasekara G. P., Priyadarshana T., Tanaka N., 2012 The current status of
 density stratification of Koggala Lagoon. ACEPS - 2012, 14 p.
Ganasut J., Weesakul S., Vongvisessomjai S., 2005 Hydrodynamic modeling of Songkhla
 Lagoon Thailand. Thammasat International Journal of Science and Technology
 10(1):32-46.
Hakanson L., 1981 A manual of lake morphometry. Springer-Verlag, Berlin, pp. 1-73.
Hasudungan F., Sutaryo D., Giyanto, Sualia I., Wibisono I. T., Ilman M., Muslihat L., 2008
 [Teluk Belukar lagoon ecosystem]. Wetlands International - Indonesia Programme,
 Bogor, 111 p. [In Indonesian].
Herrera E. C., Nadaoka K., Blanco A. C., Hernandez E. C., 2014 Hydrodynamic investigation
 of a shallow tropical lake environment (Laguna Lake, Philippines) and associated
 implications for eutrophic vulnerability. ASEAN Engineering Journal Part C 4(1):48-
 62.
Jaikumar M., Chellaiyan D., Kanagu L., Kumar P. S., Stella C., 2011 Distribution and
 succession of aquatic macrophytes in Chilka Lake – India. Journal of Ecology and the
 Natural Environment 3(16):499-508.

AACL Bioflux, 2020, Volume 13, Issue 4.
http://www.bioflux.com.ro/aacl
 2029
Kjerfve B., 1994 Coastal lagoon processes. Elsevier Oceanography Series, 576 p.
Leidonald R., Lesmana I., Muhtadi A., Desrita, 2019 Biodiversity flora and fauna in tropical
 tidal lake. International Conference on Agriculture, Environment and Food Security
 (AEFS), IOP Conference Series: Earth and Environmental Science 260:012105, 7 p.
Lisnawati L. A., Rochaddi B., Ismunarti D. H., 2013 [Study of tidal types on the Parang
 Island of the Karimun Java islands, Jepara, Central Java]. Buletin Oseanografi Marina
 2(2):61-67. [In Indonesian].
Mahanty M. M., Mohanty P. K., Pattnaik A. K., Panda U. S., Pradhan S., Samal R. N., 2016
 Hydrodynamics, temperature/salinity variability and retention time in the Chilika
 lagoon during dry and wet period: measurement and modeling. Continental Shelf
 Research 125:28-43.
Medina-Gómez I., Kjerfve B., Mariño I., Herrera-Silveira J., 2014 Sources of salinity
 variation in a coastal lagoon in a karst landscape. Estuaries and Coasts 37:1329-
 1342.
Mitchell S., Boateng I., Couceiro F., 2017 Influence of flushing and other characteristics of
 coastal lagoons using data from Ghana. Ocean & Coastal Management 143:26-37.
Lukman, Ridwansyah I., 2009 Study the physical conditions of Lake Poso and prediction of
 the characteristics of its aquatic ecosystem. LIMNOTEK, Perairan Darat Tropis di
 Indonesia 14(2):64-73.
Lukman, Ridwansyah I., 2010 Study of morphometric conditions and some stratification
 parameters of Lake Toba waters. LIMNOTEK, Perairan Darat Tropis di Indonesia
 17(2):158-170.
Mohanty P. K., Pal S. R., Mishra P. K., 2001 Monitoring ecological conditiaon of a coastal
 algoon using IRS data: a case study in Chilia, East Coast India. The Journal of Coastal
 Research 34:459-469.
Mohanty P. K., Panda B. U. S., 2009 Circulation and mixing process in Chilika Lagoon.
 Indian Journal of Marines Sciences 38(2):205-214.
Muhtadi A., Yunasfi, Leidonald R., Sandy S. D., Junaidy A., Daulay A. T., 2016 [Limnological
 status of Lake Siombak, Medan, North Sumatra]. Oseanologi dan Limnologi Di
 Indonesia 1(1):39-55. [In Indonesian].
Muhtadi A, Harahap Z. A., Leidonald R., 2017 Morphometry dynamical of Siombak Lake,
 Medan Indonesia. Omni Akuatika 13(2):48-56.
Muhtadi A., Yulianda F., Boer M., Krisanti M., 2020a Spatial distribution of mangroves in
 tidal lake ecosystem. International Conference on Agriculture, Environment and Food
 Security (AEFS), IOP Conference Series: Earth and Environmental Science
 454:012131, 7 p.
Newton A., Mudge S. M., 2003 Temperature and salinity regimes in a shallow, mesotidal
 lagoon, the Ria Formosa, Portugal. Estuarine, Coastal and Shelf Science 57:73-85.
Nontji A., 2017 Natural lakes of the archipelago. Pusat Penelitian Limnologi, LIPI, Cibinong
 (ID), 285 p. [In Indonesian].
Panda U. S., Mahanty M. M., Rao V. R., Patra S., Mishra P., 2015 Hydrodynamics and water
 quality in Chilika Lagoon - a modelling approach. Procedia Engineering 116:639-646.
Pérez-Ruzafa A., De Pascalis F., Ghezzo M., Quispe-Becerra J. I., Hernández-García R.,
 Muñoz I., Vergara C., Pérez-Ruzafa I. M., Umgiesser G., Marcos C., 2019 Connectivity
 between coastal lagoons and sea: asymmetrical effects on assemblages' and
 population's structure. Estuarine, Coastal and Shelf Science 216:171-186.
Pratiwi N. T. M., Adiwilaga E. M., Basmi J., Krisanti M., Hadijah O., Wulandari P. K., 2007
 [The limnological status of Cilala reservoir based on physical, chemical, and biological
 parameters]. Jurnal Perikanan 9(1):82-94. [In Indonesian].
Ratnayake A. S., Ratnayake N. P., Sampei Y., Vijitha A. V. P., Jayamali S. D., 2018
 Seasonal and tidal influence for water quality changes in coastal Bolgoda Lake
 system, Sri Lanka. Journal of Coastal Conservation 22(6):1191-1199.
Reis-Filho J. A., Barros F., De Anchieta Cintra Da Costa Nunes J., Barros Goncalves De
 Souza G., 2011 Moon and tide effects on fish capture in a tropical tidal flat. Journal
 of the Marine Biological Association of the United Kingdom 91(3):735-743.
Ridoan R., Muhtadi A., Patana P., 2016 [The morphometry of Kelapa Gading Lake in Kisaran
 City, Asahan District, North Sumatera Province]. Depik 5(2):77-84. [In Indonesian].

AACL Bioflux, 2020, Volume 13, Issue 4.
http://www.bioflux.com.ro/aacl
 2030
Rödersteina M., PerdomoL., Villamil C., Hauffe T., Schnetterd M. L., 2014 Long-term
 vegetation changes in a tropical coastal lagoon systemafter interventions in the
 hydrological conditions. Aquatic Botany 113:19-31.
Short A. D., 1991 Macro-meso tidal beach morphodynamics - an overview. Journal of
 Coastal Research 7(2):417-436.
Sinaga E. L. R., Muhtadi A., Bakti D., 2016 [Temperature profile, dissolved oxygen, and
 vertical pH for 24 hours in Kelapa Gading Lake, Asahan Regency, North Sumatra].
 Omni-Akuatika 12(2):114-124. [In Indonesian].
Straskraba M., Tundisi M. J., 1999 Guidelines of lake management. Volume 9. International
 Lake Environment Committee Foundation, Shiga, Jepang, 229 p.
Tagliapietra D., Sigovini M., Ghirardini A. V., 2010 A review of terms and definitions to
 categorise estuaries, lagoons and associated environments. Marine and Freshwater
 Research 60:497-509.
Umgiesser G., Ferrarin C., Cucco A., De Pascalis F., Bellafiore D., Ghezzo M., Bajo M., 2014
 Comparative hydrodynamics of 10 Mediterranean lagoons by means of numerical
 modeling. Journal of Geophysical Research: Oceans 119:2212-2226.
Welch P. S., 1952 Limnology. Second edition. McGraw-Hill Book Company, New York, pp.
 3-15.
Wetzel R. G., 2001 Limnology lake and river ecosystems. Academic Press, Boca Raton,
 1006 p.
Wyrtki K., 1961 Physical oceanography of the Southeast Asian waters. Naga Report 2, The
 University of California, Scripps Institution of Oceanography, 195 p.
Zandagba J., Moussa M., Obada E., Afouda A., 2016 Hydrodynamic modeling of Nokoué
 Lake in Benin. Hydrology 3(44):2-17.

Received: 11 November 2019. Accepted: 21 January 2020. Published online: 03 August 2020.
Authors:
Ahmad Muhtadi, Doctoral Program in Aquatic Resources Management, Graduate School of IPB University, Jl.
Lingkar Akademik, Kampus IPB, 16680 Bogor, Indonesia; Aquatic Resources Management, Faculty of
Agriculture, University of Sumatera Utara, Medan, Indonesia, e-mail: ahmad.muhtadi@usu.ac.id
Fredinan Yulianda, Aquatic Resources Management, Faculty of Fisheries and Marine Sciences, IPB University, Jl.
Lingkar Akademik, Kampus IPB, 16680 Bogor, Indonesia, e-mail: fredinan@apps.ipb.ac.id
Mennofatria Boer, Aquatic Resources Management, Faculty of Fisheries and Marine Sciences, IPB University, Jl.
Lingkar Akademik, Kampus IPB, 16680 Bogor, Indonesia, e-mail: mboer@ymail.com
Majariana Krisanti, Aquatic Resources Management, Faculty of Fisheries and Marine Sciences, IPB University, Jl.
Lingkar Akademik, Kampus IPB, 16680 Bogor, Indonesia, e-mail: krisanti.m@gmail.com
Aldiano Rahmadya, Research Center for Limnology, Indonesian Institute Science, Jl. Raya Jakarta-Bogor Km 46
Cibinong, 16911 Bogor, Indonesia, e-mail: aldiano@limnologi.lipi.go.id
Santos, Master Sciences in Marine Sciences & Technology, Graduate School of IPB University, Jl. Lingkar
Akademik, Kampus IPB, 16680 Bogor, Indonesia, e-mail: matihsantos@gmail.com
This is an open-access article distributed under the terms of the Creative Commons Attribution License, which
permits unrestricted use, distribution, and reproduction in any medium, provided the original author and source
are credited.
How to cite this article:
Muhtadi A., Yulianda F., Boer M., Krisanti M., Rahmadya A., Santos, 2020 Hydrodynamics of tropical tidal lake
waters, Lake Siombak, Medan, Indonesia. AACL Bioflux 13(4):2014-2031.

AACL Bioflux, 2020, Volume 13, Issue 4.
http://www.bioflux.com.ro/aacl
 2031
You can also read