Country profile - Lithuania - Version 2016 - Food and Agriculture Organization of the United ...
←
→
Page content transcription
If your browser does not render page correctly, please read the page content below
0            [Type here] Irrigation in Africa in figures - AQUASTAT Survey - 2016

Country profile – Lithuania
Version 2016
Recommended citation: FAO. 2016. AQUASTAT Country Profile – Lithuania.
Food and Agriculture Organization of the United Nations (FAO). Rome, Italy

The designations employed and the presentation of material in this information
product do not imply the expression of any opinion whatsoever on the part of the
Food and Agriculture Organization of the United Nations (FAO) concerning the legal
or development status of any country, territory, city or area or of its authorities,
or concerning the delimitation of its frontiers or boundaries. The mention of specific
companies or products of manufacturers, whether or not these have been patented,
does not imply that these have been endorsed or recommended by FAO in
preference to others of a similar nature that are not mentioned.

The views expressed in this information product are those of the author(s) and do
not necessarily reflect the views or policies of FAO.

FAO encourages the use, reproduction and dissemination of material in this
information product. Except where otherwise indicated, material may be copied,
downloaded and printed for private study, research and teaching purposes, or for
use in non-commercial products or services, provided that appropriate
acknowledgement of FAO as the source and copyright holder is given and that FAO’s
endorsement of users’ views, products or services is not implied in any way.

All requests for translation and adaptation rights, and for resale and other
commercial use rights should be made via www.fao.org/contact-us/licencerequest
or addressed to copyright@fao.org.

FAO information products are available on the FAO website (www.fao.org/
publications) and can be purchased through publications-sales@fao.org.

© FAO 2016
1
Lithuania
GEOGRAPHY, CLIMATE AND POPULATION
Geography
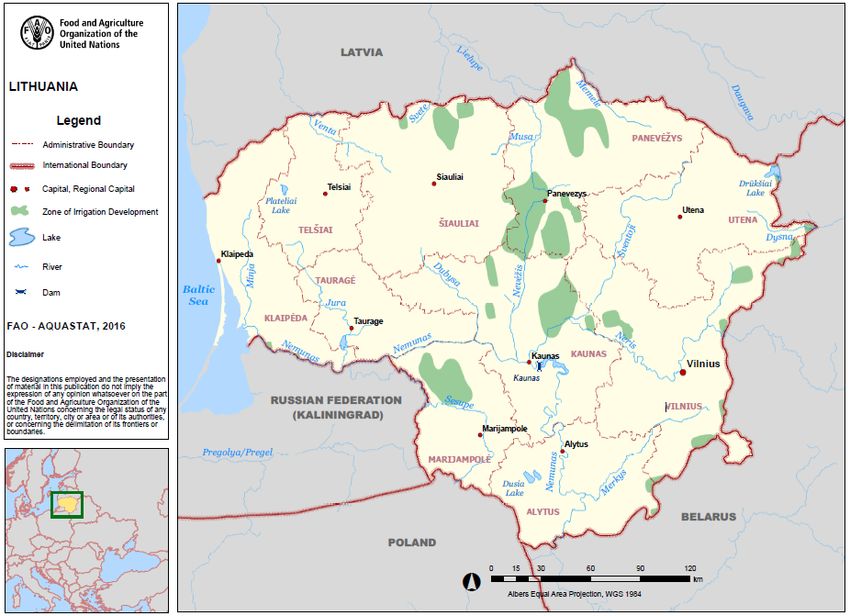
Lithuania, with a total area of 65 300 km2, is one of the three Baltic states. It is bordered in the west by
the Baltic Sea, in the north by Latvia, in the east and southeast by Belarus, in the southwest by Poland
and by Kaliningrad, which is part of the Russian Federation. It declared its independence from the Soviet
Union in March 1990. For administrative purposes, Lithuania is divided into 10 counties. The counties
are divided into 60 municipalities. The capital city is Vilnius.
Lithuania is part of the east European plain. Within the country, lowland plains alternate with hilly
uplands. From west to east, three lowland plains can be distinguished: the Pajuris, middle lowland and
eastern lowland. Similarly, there are three uplands: the Zemaiciai (or Baltic), Aukstaiciai and eastern
upland. The peak of the highest hill is at 293 m above sea level. Forests cover around 30 percent of the
country (EC, 2012).
The agricultural area, which is the sum of arable land, permanent crops and permanent meadows and
pasture, is estimated at 2.89 million ha, which is 44 percent of the total area of the country. In 2013, the
total physical cultivated area was estimated at 2.32 million ha, of which 99 percent (2.29 million ha)
consisted of temporary crops and 1 percent (0.03 million ha) of permanent crops (Table 1). The central
and western parts of Lithuania are the best regions for crop production, especially the middle lowland.
Climate
Lithuania is a semi-humid country. The climate is transitional between maritime and continental. In the
12-15 km-wide coastal zone it is maritime, and in the east of the country it is continental. The average
annual precipitation is 656 mm, ranging from less than 550 mm in the north to a maximum of more than
846 mm in the Zemaiciai hills. Over two-thirds of the precipitation occurs during the warmer period,
from April to October.
The average annual temperature is 6.5-7.9°C. The warmest month of the year is July with an average
temperature of about 19.7°C and the coldest month is January with an average temperature of about
minus 2.9°C.2 Irrigation in Eastern Europe in figures - AQUASTAT Survey - 2016
FIGURE 1
Map of LithuaniaLithuania 3
TABLE 1
Basic statistics and population
Physical areas:
Area of the country 2013 6 530 000 ha
Agricultural land (permanent meadows and pasture + cultivated land) 2013 2 891 400 ha
As % of the total area of the country 2013 44 %
Permanent meadows and pasture 2013 568 400 ha
Cultivated area (arable land + area under permanent crops) 2013 2 323 000 ha
- As % of the total area of the country 2013 36 %
- Arable land (temp. crops + temp. fallow + temp. meadows) 2013 2 290 000 ha
- Area under permanent crops 2013 33 000 ha
Population:
Total population 2015 2 878 000 inhabitants
- Of which rural 2015 31 %
Population density 2015 44 inhabitants/km2
Economy and development:
Gross Domestic Product (GDP) (current US$) 2014 48 172 million US$/year
Value added in agriculture (% of GDP) 2014 3 %
GDP per capita 2014 16 740 US$/year
Human Development Index (highest = 1) 2014 0.839 -
Gender Inequality Index (equality = 0, inequality = 1) 2014 0.125 -
Access to improved drinking water sources:
Total population 2015 97 %
Urban population 2015 100 %
Rural population 2015 90 %
Population
In 2015, the total population was about 3 million, of which around 31 percent was rural (Table 1).
Average population density in the country is 44 inhabitants/km2. The average annual population growth
rate in the 2005-2015 period has been estimated at minus 1.5 percent.
In 2014, the Human Development Index (HDI) ranks Lithuania 37 among 188 countries, while the
Gender Inequality Index (GII) ranks it 23 among 155 countries, for which information was available.
Life expectancy is 74 years and the under-five mortality is 5 per 1000 births, both progressing from 69
years and 20 per 1000 in the 1990s. With no significant distinction between boys and girls, around 95
percent of the children in 2013 are enrolled in primary education, and 96 percent for secondary education
(WB, 2015). Adult literacy is 99.8 percent in 2012 (UNDP, 2015). In 2015, 97 percent of the total
population had access to improved water sources (100 and 90 percent in urban and rural areas
respectively) and 92 percent of the total population had access to improved sanitation (97 and 83 percent
in urban and rural areas respectively) (JMP, 2015).
ECONOMY, AGRICULTURE AND FOOD SECURITY
In 2014, the gross domestic product (GDP) was US$ 48 172 million and agriculture accounted for 3
percent of GDP, while in 1994 it accounted for 11 percent.
In the Soviet era, agriculture was collectivized and organized in large-scale farms. After independence,
agriculture was restructured and the land returned to its former owners.
Lithuania gained membership in the World Trade Organization in 2001 and joined the European Union
(EU) in 2004 and the Euro zone in 2015. Foreign investment and EU funding have aided in the transition
from the former planned economy to a market economy. Lithuania was severely hit by the 2008-09
financial crisis, but the country has rebounded and become one of the fastest growing economies in the
EU (CIA, 2015).4 Irrigation in Eastern Europe in figures - AQUASTAT Survey - 2016
The main crops in Lithuania are winter and spring cereal accounting for 41 percent of the total, winter
and spring rape seed accounting for 12 percent, perennial grassland accounting for 40 percent and other
crops as pulses, potatoes, beetroots, fallow, etc. account for 7 percent.
WATER RESOURCES
Surface water and groundwater resources
Rivers and lakes have long been used as waterways, although, with the exception of the Nemunas river
in the south of the country, they are not very suitable for navigation. Within the country, there are
722 rivers with a length of more than 10 km each and just 21 of them have a length of more than 100 km.
Most of the rivers flow across the middle lowland and the western part of the Zemaiciai upland.
Lithuania is divided in four River Basin Districts (RBD):
Nemunas: It includes the Nemunas basin, covering 65.9 percent of the country, the group of
coastal basins, covering 4.4 percent of the country, and the Pregolya basin that covers 0.1
percent of the country in the southwest and drains west into the Russian Federation. The
Nemunas river rises in Belarus and enters Lithuania in the south. It flows first north and then
turns to the west. It becomes the border between Lithuania and the Russian Federation before
flowing into the Baltic Sea. Its major tributaries are the Neris river, rising in Belarus, and the
Sesupe river, rising in Poland.
Lielupe: It covers 16.4 percent of the country. Several rivers, such as the Svete, Musa and
Memele, rise in the north of Lithuania. They flow into Latvia and become the Lielupe river after
the confluence of Musa and Memele and still further downstream Svete joins.
Venta: This basin covers 9.1 percent of the country. The Venta river rises in the northwest of
Lithuania and flows into Latvia.
Daugava: This basin covers 4.1 percent of the country in the northeast. The Daugava river itself
does not flow in Lithuania. Some tributaries, rising in Lithuania, flow northeast into Latvia,
where they flow into the Daugava river.
The internal renewable surface water resources (IRSWR) are estimated at 15 360 million m3/year
(Table 2). The incoming surface water resources are estimated at 9 040 million m3/year, of which 9 000
million m3 from Belarus and 40 million m3 from Poland. Total renewable surface water resources are
thus estimated at 24 400 million m³/year. The outflow to the Russian Federation is estimated at
850 million m3/year, of which 840 million m3 through Nemunas and 10 million m3 through Pregolya.
The outflow to Latvia is estimated at 4 010 million m3/year, of which 2 000 million m3 through Lielupe,
500 million m3 through Daugava, 1 300 million m3 through Venta and 210 million m3 through the
western coast basin. This brings the total outflow to 4 860 million m3/year.
TABLE 2
Renewable surface water resources (RSWR) by River Basin District (RBD)
Name of Area within Lithuania Internal RSWR Inflow Total RSWR Outflow to:
RBD km 2
% of total 3
million m /year 3
million m /year from 3
million m /year
Nemunas 45 970 70.4 11 560 9 040 20 600
Nemunas 43 030 65.9 10 650 9 040 Belarus (9 000); 19 690 Russian F. (840) +
Poland (40) Sea
Coast 2 870 4.4 900 - - 900 Latvia (200) + Sea
Pregolya 70 0.1 10 - - 10 Russian F.
Lielupe 10 710 16.4 2 000 - - 2 000 Latvia
Venta 5 940 9.1 1 300 - - 1 300 Latvia
Daugava 2 680 4.1 500 - - 500 Latvia
Total 65 300 100 15 360 9 040 24 400Lithuania 5
The largest groundwater reserves are in the eastern and southeastern parts of the country, as well as
along the Neris and Nemunas valleys while the smallest reserves are in central Lithuania (MoE, 2014).
Internal renewable groundwater resources are estimated at 1 100 million m3/year. It is considered that
most of the flow is drained out by the river system and does not contribute to the total renewable water
resources. The overlap between surface water and groundwater resources has been estimated at
1 000 million m3/year which brings the total renewable water resources to 24 500 million m3
(24 400+1 100-1 000) (Table 3).
TABLE 3
Renewable water resources
Renewable freshwater resources:
Precipitation (long-term average) - 656 mm/year
- 42 840 million m3/year
Internal renewable water resources (long-term average) - 15 460 million m3/year
Total renewable water resources - 24 500 million m3/year
Dependency ratio - 37 %
Total renewable water resources per inhabitant 2015 8 513 m3/year
Total dam capacity 2015 1 822 million m3
In 2009, produced municipal wastewater was estimated at 262 million m3, treated municipal wastewater
at 128 million m3 and direct use of treated wastewater at 5 million m3.
Lakes and dams
Lithuania has more than 2 800 lakes, of which 25 have surface areas of more than 10 km2. They cover
1.5 percent of the total area of the country. Most lakes are concentrated in the Aukstaiciai uplands in the
east of the country.
There are 20 large dams in Lithuania registered in ICOLD’s World Register of Large Dams (Burneikis,
Punys and Zibiene, 2001). One large dam, the Kaunas dam, has been built on the Nemunas river for
hydropower generation. Its total capacity is 462 million m3 and its useful capacity is 220 million m3.
About 376 dams have been built for water storage for irrigation and flood control. Their total capacity
is 1 360 million m3 and their useful capacity is 230 million m3. The reservoirs could also be useful for
fishery and recreation. Total dam capacity is estimated at 1 822 million m3 and the useful capacity
at 450 million m3.
INTERNATIONAL WATER ISSUES
Lithuania takes part in the following agreements concerning the use of international watercourses, lakes
or groundwater (UN, 2004):
1992 Helsinki Convention on the Protection of the Marine Environment of the Baltic Sea Area;
1992 UN ECE Convention on the Protection and Use of Transboundary Water Courses and
International Lakes.
All four RBDs in Lithuania are international. Nemunas RBD shares water courses with Belarus,
Kaliningrad (Russian Federation) and Poland. The other three, Daugava, Venta and Lielupe RBDs, share
water courses with Latvia (EC, 2015). However, no international river basin management plans
(RBMPs) have yet been adopted.
Cooperation with Belarus and the Russian Federation in the field of protection of the environment,
including water bodies, has been developed for a number of years on the basis of cooperation agreements
signed by the Ministry of Environment of Lithuania, the Ministry of Natural Resources of Belarus and
and the Ministry of Natural Resources of the Russian Federation. These agreements, however, don’t6 Irrigation in Eastern Europe in figures - AQUASTAT Survey - 2016
cover all relevant aspects regarding transboundary water resources. Some agreements with Belarus and
the Russian Federation are:
In 1995, an agreement between Lithuania and Belarus was signed on Cooperation in
Environmental Protection.
In 2003, an agreement on inter-institutional cooperation have been signed with the Kaliningrad
region of the Russian Federation and with Belarus on monitoring and exchange of data on the
status of transboundary surface water bodies
In 2008, a Technical Protocol was signed between the Ministry of Environment of Lithuania
and the Ministry of Natural Resources and Environmental Protection of Belarus on cooperation
in the field of monitoring and exchange of data on the status of transboundary surface water
bodies.
The Nemunas RBD is shared with two EU Member States, Poland and Latvia, and two non-EU
countries, Belarus and the Russian Federation (Kaliningrad oblast). The governments of Lithuania, the
Russian Federation, Belarus, and the European Commission have initiated the preparation of an
agreement on cooperation in the use and protection of water bodies within the Nemunas RBD. A draft
agreement has been drawn up but has not been signed yet. No measures have been foreseen for Poland
and Latvia, because the part of the Nemunas RBD in Poland constitutes only 287 km2 (the upstream
reaches of the rivers with no significant pressures), and the part of the RBD in Latvia constitutes only
100 km2 (the upstream reaches of the rivers with no significant pressures), and the results of water
quality monitoring showed that the ecological status of the rivers along the Polish and Latvian border
were good (EC, 2012).
Coordination of some RBMP elements with Latvia has occurred, but a joint RBMP has not been
elaborated. An intergovernmental commission on transboundary cooperation between these two
countries was set up following the “Agreement on Transfrontier Cooperation between the Government
of Lithuania and the Government of Latvia” signed in 1999. Cooperation with Latvia seeking to create
a joint River Basin District Management Plan will continue on the basis of this agreement and pursuant
to the Technical Protocol of Cooperation in the Management of International River Basin Districts,
signed between the Ministry of Environment of Lithuania and the Ministry of Environment of Latvia in
2003 (EC, 2012). The Lielupe and Venta rivers, shared between Lithuania and Latvia, are included in
the list of European Main Transboundary Surface Waters. The water quality problems of these rivers
can only be solved by means of international agreements, in compliance with the mechanisms provided
in the Helsinki Convention on “Use and Protection of Transboundary Watercourses and International
Lakes” adopted in 1992.
In 2003 and 2004, several seminars were held for Baltic experts to discuss identification of river basin
districts, proposed typology and characteristics of surface water. Even if they have not led to a
harmonized typology, experts had a regular information exchange with neighbouring colleagues. In
2003, permanent working groups were established.
Cooperation with Poland on issues of water protection is ensured through the commission of cooperation
of Poland and Lithuania. It was established on the basis of the Agreement between the two countries on
“Cooperation on the Issues of the Use of International Waters”. One of the objectives of the working
groups of the commission is to cooperate in the development and implementation of the River Basin
District Management Plan in international waters (EC, 2012).
WATER USE
In 2011, total water withdrawal was estimated at 631 million m3 of which 415.9 million m3 (66 percent)
for industry, 149.9 million m3 (24 percent) for municipalities and 65.6 million m3 (10 percent) for
agriculture including irrigation, livestock watering and cleaning, and aquaculture (Figure 2 and Table
4). Around 71 percent of total water withdrawal is withdrawn from surface water, 28 percent from
groundwater and 1 percent by direct use of municipal treated wastewater (Figure 3).Lithuania 7
TABLE 4
Water use
Water withdrawal:
Total water withdrawal 2011 631 million m3/year
- Agriculture (Irrigation + Livestock + Aquaculture) 2011 66 million m3/year
- Municipalities 2011 150 million m3/year
- Industry 2011 416 million m3/year
Per inhabitant 2011 205 m3/year
Surface water and groundwater withdrawal (primary and secondary) 2011 626 million m3/year
As % of total renewable water resources 2011 3 %
Non-conventional sources of water:
Produced municipal wastewater 2009 262 million m3/year
Treated municipal wastewater 2009 128 million m3/year
Direct use of treated municipal wastewater 2009 5 million m3/year
Direct use of agricultural drainage water - - million m3/year
Desalinated water produced - - million m3/year
FIGURE 2
Water withdrawal by sector
Total: 631 million m3 in 2011
FIGURE 3
Water withdrawal by source
Total: 631 million m3 in 20118 Irrigation in Eastern Europe in figures - AQUASTAT Survey - 2016 In 1995, total water withdrawal was estimated at 4 352 million m3 and in 2005 it was estimated at 2 365 million m3. The reason that these figure is so much higher than the water withdrawal in 2011 is that by far the largest part, (4 099 million m3 in 1995 and 2 098 million m3 in 2005) was needed for cooling of nuclear power plants. However, at the end of 2009 Lithuania, under pressure of the EU, closed down its last nuclear reactor, which had been generating 70 percent of its electricity. While electricity was a major export product, since closure of the nuclear plant more than 60 percent of Lithuania’s electricity is imported (WNA, 2016). IRRIGATION AND DRAINAGE Evolution of irrigation development The irrigation potential in the country has been estimated at 200 000 ha. In the 1970s, in the Nemunas river delta about 40 000 ha of meadows in polders were protected by dams against flooding. About 100 pumping stations had been installed to remove excess water in periods of flood. However, since this led to moisture deficit in dry periods sluices were installed in the polders, enabling to regulate the water level in the ditches and to irrigate in the driest periods. In 1976, 2 200 such systems, called sluice systems, were exploited. However, these systems were not used for long as sprinkler irrigation soon proved to be a more effective system of irrigation under Lithuanian conditions. Since 1965, a lot of research on sprinkler irrigation has been carried out. The first sprinkler irrigation systems were installed in 1965 in the Kaunas and Këdainiai districts in the centre, where for some time domestic wastewater was used for irrigation. However, after an outbreak of cholera in the region in about 1970, the use of domestic wastewater for irrigation was forbidden. In the period 1973-1985, 33 industrial pig complexes were built. Irrigation systems were installed on 6 600 ha close to these complexes, using the dung as fertilizer. During the period 1970-1990, the construction of irrigation systems was rather expensive because of the need for reservoir construction. Nevertheless, irrigation systems increased rapidly. By the end of 1970, irrigation covered 5 100 ha. In 1975 and in 1990 it was 22 300 and 42 700 ha respectively. During the Soviet period, large irrigation systems were installed (100-200 ha) on kolkhoz (collective farms) and sovkhoz (state farms). After they were broken up, private owners started working on small plots (8-20 ha) and many of the large irrigation systems stopped functioning. This is the reason for the rapid decrease in irrigation after the independence. While 42 700 ha were equipped for irrigation in 1990, only 9 247 ha were left equipped for irrigation in 1995. The rest of the system has largely been destroyed, as farmers have not been interested in using large, costly irrigation schemes. At present, irrigation systems are not popular since equipment is expensive and, in many parts of the country rainfed cropping is very well possible. In 2012, the total area equipped for irrigation was estimated at 4 440 ha, which represents only 0.2 percent of total cultivated area (Table 5). In 2010 actually irrigated area accounted for 1 532 ha, which was only about one third of the area equipped for irrigation in that year.
Lithuania 9
TABLE 5
Irrigation and drainage
Irrigation potential - 200 000 ha
Irrigation:
1. Full control irrigation: equipped area 2012 4 440 ha
- Surface irrigation - - ha
- Sprinkler irrigation - - ha
- Localized irrigation - - ha
Area equipped for full control irrigation actually irrigated 2010 1 532 ha
- As % of area equipped for full control irrigation 2010 35 %
2. Equipped lowlands (wetland, ivb, flood plains, mangroves) - 0 ha
3. Spate irrigation - 0 ha
Total area equipped for irrigation (1+2+3) 2012 4 440 ha
As % of cultivated area 2012 0.2 %
% of area irrigated from surface water - - %
% of area irrigated from groundwater - - %
% of area irrigated from mixed surface water and groundwater - - %
% of area irrigated from non-conventional sources of water - - %
Area equipped for irrigation actually irrigated 2010 1 532 ha
- As % of total area equipped for irrigation 2010 35 %
Average increase per year 2005-2012 0.1 %
Power irrigated area as % of total area equipped for irrigation - - %
4. Non-equipped cultivated wetlands and inland valley bottoms - - ha
5. Non-equipped flood recession cropping area - - ha
Total agricultural water managed area (1+2+3+4+5) 2012 4 440 ha
As % of cultivated area 2012 0.2 %
Size of full control irrigation schemes: Criteria:
Small schemes < - ha - - ha
Medium schemes > - ha and < - ha - - ha
large schemes > - ha - - ha
Total number of households in irrigation - -
Irrigated crops in full control irrigation schemes:
Total irrigated grain production - metric tons
As % of total grain production - %
Harvested crops:
Total harvested irrigated cropped area 2010 1 532 ha
Temporary crops: total 2010 1 358 ha
- Potatoes 2010 642 ha
- Vegetables and strawberries 2010 615 ha
- Other temporary crops 2010 101 ha
Permanent crops: total 2010 82 ha
- Fruit trees and berry plantations 2010 82 ha
Permanent meadows and pastures 2010 92 ha
Irrigated cropping intensity (on full control area actually irrigated) 2010 100 %
Drainage - Environment:
Total cultivated area drained - - ha
Non-irrigated cultivated area drained - - ha
Area equipped for irrigation drained - - ha
- As % of total area equipped for irrigation - - %
Area salinized by irrigation - - ha
Area waterlogged by irrigation - - ha
In 2010, out of the total of 120 farms in the country that used irrigation, 56 farms used surface irrigation,
36 farms used sprinkler irrigation and 56 farms used localized irrigation. In that same year, 19 farms
used on-farm groundwater, 66 farms used on-farm surface water (ponds or dams), 33 percent used off-
farm surface water from lakes, rivers or watercourses, 10 farms used off-farm water from common water10 Irrigation in Eastern Europe in figures - AQUASTAT Survey - 2016 supply networks, and 10 farms used other sources of water. Out of those 120 farms, 72 farms were smaller than 2 ha, 15 farms had an area of 2-5 ha, 10 farms of 5-10 ha, 7 farms of 10-20 ha, 5 farms of 20-50 ha, 5 farms of 50-100 ha and 6 ha larger than 100 ha (Statistics Lithuania, 2012). Role of irrigation in agricultural production, economy and society In 2010, the actually irrigated area was 1 532 ha, of which 642 ha or 42 percent were potatoes, 614 ha or 40 percent vegetables and strawberries, 101 ha or 7 percent other temporary crops, 82 ha or 5 percent fruit trees and berry plants and 92 ha or 6 percent permanent meadows and pastures (Statistics Lithuania, 2012) (Table 5 and Figure 4). FIGURE 4 Irrigated crops on area equipped for full control irrigation Total harvested area 1 532 ha in 2010 (cropping intensity on actually irrigated area: 100%) Status and evolution of drainage systems The main issue in relation to agriculture in Lithuania is the removal of excess water to enable cropping. In ancient times, Lithuanians removed excess moisture from fields by furrowing them, using a special way of ploughing, or by making ditches. The first subsurface drainage systems are said to have been installed in 1855. Drainage works increased significantly at the beginning of the twentieth century, starting with the beginning of cultivation in the Nemunas river delta. In 1918, about 5 900 ha were known to be drained. In 1939, 14 800 ha of land were intensively drained, including 11 800 ha by subsurface drainage. In addition, 457 700 ha of land were drained extensively. Around 1 million ha of wetland had been drained by 1970 and 2 million ha by 1978. In 1995, the total drained area was estimated at about 3 million ha, of which 2.6 million ha, or 86 percent, were equipped with subsurface drainage systems. The total length of subsurface drainage lines is almost 1.6 million km. It is calculated that drainage systems have been installed on 90 percent of the area needing drainage, which is estimated at almost 3.4 million ha, which is more than half of the total area of the country. In fact, the country remains one of the most extensively drained countries in the world (Povilaitisa et al, 2014).
Lithuania 11
WATER MANAGEMENT, POLICIES AND LEGISLATION RELATED TO WATER USE IN AGRICULTURE
Institutions
The main institutions involved in water resources management are:
The Ministry of Environment (MoE) is the main governmental institution responsible for water
management. It is responsible for economic analysis, economic assessment of proposed
measures and development of measures related to cost recovery for water services. It
coordinates the activities of subordinated institutions to ensure the implementation of river basin
management. It is also responsible for coordinating international agreements in the field of
management of international river basin districts.
The following institutions fall under MoE:
The Environmental Protection Agency (EPA), which is responsible for the
administration of all the four river basin districts (RBDs). It is responsible for:
delineation of water bodies, management of the Register of Protected Areas, assessment
of human pressures on lakes and rivers, establishment of a system for the classification
and definition of objectives for surface water bodies, monitoring of surface waters,
public consultation and reporting to the European Commission.
The Lithuanian Geological Survey (LGS), which is responsible for the implementation
of the EU Water Framework Directive (WFD) tasks related to groundwater. It is
responsible for monitoring, classification of the status of groundwater bodies and
establishing objectives for groundwater bodies.
The Lithuanian Hydrometeorological Service (LHS), which is responsible for
hydrological monitoring of rivers and lakes, assessment of the quantitative status and
human pressure on surface water bodies and development of proposals related to water
bodies.
The State Service for Protected Areas (SSPA), which is responsible for the collection
of data and development of measures in protected areas.
The Regional Environmental Protection Departments (REPDs), which are responsible
for the collection and monitoring of surface water data, issuing permits, the control of
water abstractions and wastewater discharges, identification of problems and
enforcement of RBMPs (EC, 2012).
The Ministry of Agriculture is responsible for irrigation.
The Association of Land and Water Management Engineers is a non-governmental organization
for water management engineers. It is the principal public advisory body to the government on
all matters related to land and water management.
Water management
The river basin management plans (RBMP) for the Daugava, Lielupe, Nemunas, and Venta RBDs were
adopted in 2010, implemented in the period from 2010 through 2015, and will be updated every six
years, i.e. in 2015, 2021, etc. The plans present an overview of the RBD status and needs, provide
information on water protection objectives, identify water bodies at risk of failing to achieve good status,
foresee measures for achieving water protection objectives, etc. (EC, 2015; Länsstyrelsen Blekinge län,
2012).
Finances
There are pricing policies for water use in every sector in Lithuania. Costs for water supply and treatment
are fully covered by user charges (UN, 2004).
External financial resources have come mainly from bilateral donors such as Sweden, Finland, Norway
and Denmark, and also from the international institutions such as the Poland and Hungary: Assistance
for Restructuring their Economies (PHARE) programme, the European Bank for Reconstruction and12 Irrigation in Eastern Europe in figures - AQUASTAT Survey - 2016
Development (EBRD), the Nordic Environment Finance Corporation (NEFCO) and the World Bank
(UN, 2004).
Policies and legislation
The general legislation and regulatory framework for water management includes (UN, 2004):
Lithuanian Environmental Strategy and Action Programme (1996)
Law on Water (1997, amendments in 2000)
Law on Taxes on State Natural Resources (1991, amendments in 1996, 2000)
Law on Pollution Taxes (1991, new wording in 1999, amendments in 2000, 2002)
Law on Environmental Impact Assessment of the Proposed Economic Activity (1996, new
wording in 2000)
Code on the Internal Water Transport (1996)
Regulations on the Establishment of the Water Bodies Protection Zone
The Law on Water regulates the ownership of the internal water bodies, the management, use and
protection of water resources and the rights and obligations of users of internal bodies of water and their
resources. According to the law, the use of water resources shall be regulated considering the needs of
the economy and population. It should guarantee a sustainable use of surface and groundwater resources,
prevent waters from pollution and protect the rights of owners of bodies of water and users of their water
resources.
ENVIRONMENT AND HEALTH
The most important sources of pollution of water are (Länsstyrelsen Blekinge län, 2012):
diffuse pollution loads from agriculture
point pollution loads from dischargers of wastewater treatment plants, surface runoff and
industrial wastewater in towns and settlements
transboundary pollution, which consists of pollution loads coming from the neighbouring
countries
The quantitative and chemical condition of most of the groundwater basins is good; they are subject to
surveillance monitoring. Five groundwater basins have been identified as being at risk, with parts having
chloride and sulphate concentrations in excess of the drinking water standard due to natural causes.
Monitoring of the problematic quality indicators was launched in these basins in 2013 (MoE, 2014).
The rivers of Lithuania will become particularly vulnerable in summer due to climate change. If the
climate change scenarios come true, spring and autumn floods will change greatly. In summer, the water
quality will suffer from low flows. The maximum summer temperature of lakes will rise and therefore
the processes of eutrophication will accelerate (Climate Adaptation, 2015).
Drainage is usually carried out in conjunction with specific cultural practices: removing shrubs and
stumps, gathering stones, ploughing drained swamps and fallow lands. However, sometimes too many
shrubs are removed, resulting in an increase in soil erosion. For this reason, serious attention is being
paid to environmental protection.
PROSPECTS FOR AGRICULTURAL WATER MANAGEMENT
The protection of water and the sustainable management of inland water bodies is one of the main
environmental challenges for the government of Lithuania. A programme of measures must be
established for each river basin district in order to achieve water protection objectives.Lithuania 13 MAIN SOURCES OF INFORMATION Bastienė N., Šaulys V. 2007. Maintenance and financing of land drainage in Lithuania. Burneikis J., Punys P and Zibiene G. 2001. Hydropower development and environmental requirements in Lithuania. CIA. 2015. The World Fact Book: Lithuania. Central Intelligence Agency. Climate Adaptation. 2015. Freshwater resources Lithuania. EC. 2012. Commission staff working document. Member State: Lithuania. Accompanying the document Report from the Commission to the European Parliament and the Council; on the implementation of the Water Framework Directive (2000/60/EC); River Basin Management Plans. European Commission. EC. 2015. European Commission website. Environment. Lithuania. European Commission. ECE. 2009. Capacity for water cooperation in Eastern Europe, Caucasus and Central Asia. Economic Commission for Europe. EUROSTAT. 2013. Agricultural census in Lithuania. Government of the Republic of Lithuania. 1997. Law on Water. JMP. 2015. Progress on drinking water and sanitation – 2015 Update and MDG Assessment. WHO/UNICEF Joint Monitoring Programme for Water Supply and Sanitation. Länsstyrelsen Blekinge län. 2012. Water management in Lithuania, Poland and Sweden - Comparisons of the EU Water Framework Directive in practice. MoE. 2014. Environmental monitoring: Lithuania has rich resources of quality groundwater. Ministry of Environment. Official Gateway of Lithuania. 2016. About Lithuania. Climate. Povilaitisa A., Lamsodisa R., Bastienėa N., Rudzianskaitėa A., Misevičienėa S., Miseckaitėa O., Gužysa S., Baigysa G., Grybauskienėa V, Balevičiusa G. 2014. Agricultural drainage in Lithuania: a review of practices and environmental effects. Ruzgienė D. Challenges and future prospects for Lithuanian agriculture. Statistics Lithuania. 2012. Results of the Agricultural Census of the Republic of Lithuania 2010. UN. 2004. Freshwater country profile Lithuania. United Nations. UNDP. 2015. Human Development Reports: Data. United Nations Development Programme. New York. WNA. 2016. Nuclear power in Lithuania. World Nuclear Association. World Bank. 2015. World Development Indicators. World DataBank. World Bank. Washington.
You can also read