Surface runoff and participatory actions for environmental management in Sub-basin III of the South Basin of Lake Managua, Nicaragua
←
→
Page content transcription
If your browser does not render page correctly, please read the page content below
Revista                                           © Copyright (2021). National Autonomous University of Nicaragua, Managua
Torreón Universitario                                                    This document is under a Creative Commons Attribu-
www.faremcarazo.unan.edu.ni / ISSN 2410-5708 / e-ISSN 2313-7215 tion-NonCommercial-NoDerivs 4.0 International licence.
Year 10 | No. 27 | February - May 2021

       Surface runoff and participatory actions for
       environmental management in Sub-basin III of
       the South Basin of Lake Managua, Nicaragua
       Ingrid Úbeda Trujillo
       Professor of the Geography Department
       Universidad Nacional Autónoma de Nicaragua, Managua
       https://orcid.org/0000-0002-1349-4682
       ingrid.ubeda@unan.edu.ni / ingrideut@gmail.com
       Lester Rocha
       Professor of the Zootechnics Department
       Universidad Nacional Agraria (UNA)
       https://orcid.org/0000-0002-0622-9733
       lester.rocha@ci.una.edu.ni
       Submitted on January 25, 2020 / Accepted on July 13, 2020
       https://doi.org/10.5377/torreon.v10i27.10844

         Keywords: Curve Number, land cover, Hydrological Response Units,
         public and private sector.

         ABSTRACT

                 I
                     n Sub-basin III of the South Basin of Lake Managua, Nicaragua, there is an increase in
                     surface runoff caused by the increase in urban coverage, agriculture, and the fluctuating
                                                                                                                              SCIENTIFIC ARTICLES

                     trend of forest cover. In this study, the surface runoff was evaluated based on the land
         cover of the years 2003, 2010, 2016, and the projected the year 2025. Methodologically, the area
         under study was delimited in 23 Hydrological Response Units (URH) to identify the areas where
         the greatest runoff occurs. In each URH, the Curve Number (NC) method of the Soil Conservation
                                                                                                                                          Sciences

         Service (SCS) was applied, and to discretize the method, a hietogram, the hydrological type of
         soil, and the antecedent humidity condition were used. The hyetogram was generated based on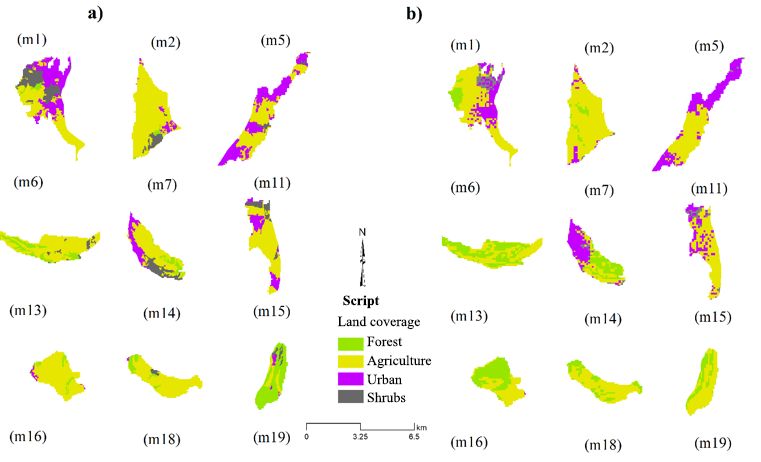
Revista Torreón Universitario / Year 10 / No. 27 / February - May 2021/ ISSN: 2410-5708 / e-ISSN 2313-7215
the calculation of the Curves of Intensity, Duration, Frequency. Furthermore, the hydrological
number was estimated based on the type of soil and the preparation of land cover maps for each
year evaluated. The results indicate that the URH associated with agriculture and urban coverage
generate the greatest runoff (47 m3.s-1, 36 m3.s-1, 25 m3.s-1, 13 m3.s-1, and 10 m3.s-1). Therefore,
in these URH´s it is recommended the implementation of participatory actions of a regulatory,
economic, educational, and organizational nature for the environmental management of the
area under study.
INTRODUCTION
The Curve Number (CN) method is widely used to approximate to calculate the rainfall-
runoff relationship (Chow, Maidment, & Mays, 1994; Satheeshkumar, Venkateswaran, &
Kannan, 2017), and to provide input data for hydrological modeling (Adham, M. I; Shirazi, S. M;
Othman, F; Rahman, S; Yusop, Z; Ismail, Z, 2014). Recently, for the execution of participative
actions derived from an environmental management program, it is interesting to examine the
impacts in the basin (Guo, Huo, & Jiang, 2008; Satheeshkumar, et al., 2017), according to the
temporal and spatial scale. , and based on the integration of hydrological models and models for
prediction of land cover (Verburg, Rousenvell, & Veldkamp, 2006; Miranda, 2008; (Hernández
Guzmán, Ruiz, Berlanga-Robles, & Zoltán Vekerdy, 2009; Sundarakumar, K; Harika, M; Begum,
S; Aspiya, K; Yamini, S; Balakrishna, K, 2012; Cano, Andreoli, Arumi, & Rivera, 2014, Adham, et
al., 2014; Ndulue, L; Mbajiorgu, CC; Ugwu, SN; Ogwo, V; Ogbu, KN, 2015; Mwathi, 2016).
The change in land cover and its interaction with water and soil modifies the hydrological
balance of a basin and consequently significantly influences the runoff volume (Notter,
MacMillan, Viviroli, Weingartner, & Liniger, 2007; Guo, Huo, & Jiang, 2008; Mango, Melesse,
Mcclain, & Gann, 2011; Satheeshkumar, et al, 2017). Agricultural coverage has adversely
degraded the proper functioning of the environment, producing surface variability of runoff
and decreased water yields (Villarreal Hernández, Martínez Valdés, & Belmonte Jiménez,
2013; Alemayehu, 2015; Ndulue et al., 2015). Simultaneously, urban coverage has four stages
that affect the environment. In the first stage during the removal of natural vegetation, soil
erosion is caused. In the second stage, with the construction of houses, streets, and channels,
infiltration into the aquifers is reduced. In the third stage, when there is already urban coverage,
the impermeability increases, the concentration-time of the runoff is reduced, and the discharge
SCIENTIFIC ARTICLES
peaks increase after the rain begins in a basin. Finally, when the sewers and drainage channels
are consolidated in the city, floods occur in the lower part of the basin (Villarreal, et al., 2013).
The Hydrological Response Units (URH) approach with areas of approximately 10
Sciences
2
km makes it effective to quantify the impacts of land cover on surface runoff (FAO, 2002),
allowing the identification of critical URHs (Espíritu and Hernández, 2013) and also implement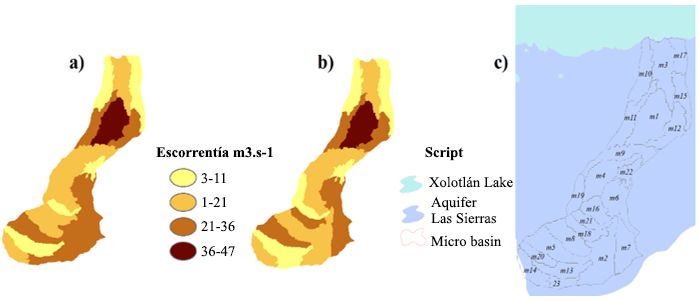
Surface runoff and participatory actions for environmental management… Úbeda Trujillo / Rocha
management actions in a basin. Since the division of a large basin into small physiographic
or hydrologically similar units facilitates and makes economic development of environmental
management programs (Hernández, et al., 2009; Leonel, Aguilar Robledo, & Medellín, 2013).
METHODOLOGY
Study area
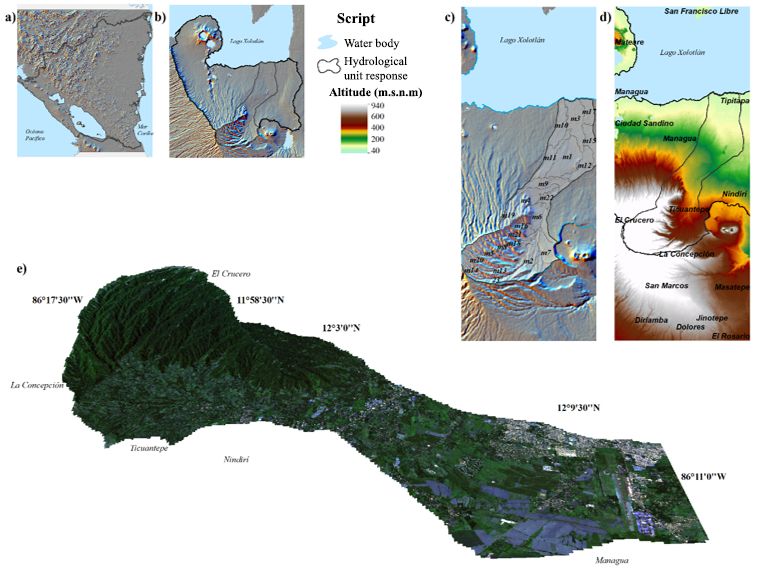
Figure 1 shows the geographical location of Sub-basin III of Managua, of the South Basin
of Managua, Nicaragua. It has an area of 17,
337 ha, and extends from the El Crucero Plateau
(940 masl) coinciding with the upper part (south of the map) to the shores of Lake Managua (40
masl) coinciding with the lower part (at the north of the map). The municipalities that are part
of the study area are El Crucero, La Concepción, Ticuantepe, Nindirí, and districts V and VI of
Managua. 90% of rainfall occurs in the rainy period (May-October) and 10% of rainfall during
the dry period (ALMA, 2008). The slopes in the upper part are 15° and 49°, in the middle part 0°
and 49°, and the lower part 0° and 3.6°, and the mainland covers are: forest, agriculture, urban,
scrub and water in a smaller area.
SCIENTIFIC ARTICLES
SciencesRevista Torreón Universitario / Year 10 / No. 27 / February - May 2021/ ISSN: 2410-5708 / e-ISSN 2313-7215
Figure 1. Location of Sub-basin III of Managua a) Map of Nicaragua, b) Map of the southern Basin of Lake
Managua, c) Map of Hydrological Response Units d) Map of Altitudes of Sub-basin III of Managua e) Map 2D
of the study area.
Methods
Surface runoff was estimated for the years 1997, 2003, 2010, 2016 and was simulated
to the year 2025 using the Curve Number (CN) method of the US Soil Conservation Service
(SCS) (Satheeshkumar., et al. 2017) and based on the land cover maps generated for each year
SCIENTIFIC ARTICLES
evaluated (unpublished data).
The CN method was executed in the HEC-HMS (Hydrologic Engineering Center)
Software and the input data generated were: the hietogram, the hydrological type of soil, and
Sciences
the antecedent humidity condition.Surface runoff and participatory actions for environmental management… Úbeda Trujillo / Rocha
For the calculation of the hyetogram, the annual records of 10 years of precipitation of
the meteorological station (code 69027) of the Managua International Airport, located in the
lower part of Sub-basin III (location coordinates 12° 08' 36" N, 86° 09' 49" O). Next, the maximum
probable precipitation in 24 hours was estimated by adjusting a Gumbel probability distribution
(Equation 1), and correction by fixed interval 1.13 was established (Hershfield, 1961).
Due to the scarcity of one-hour rainfall records, the maximum values of precipitation in
one day were related to the coefficients of precipitation of one hour (Campos, 1992). From the
maximum daily rainfall according to its duration and frequency, as well as the application of
the alternate block method (Chow et al., 1994) the intensity of the precipitation (mm / hr) was
estimated and design precipitation of 113 mm in 24 hours (Equation 2).
Equation 1. Distribution of probability density
where: N samples, contains n events. α y β are the function parameters.
Equation 2. Rain intensities from Pd, according to Duration of precipitation and Frequency
of the same where P = Daily precipitation in mm, t = duration in hours, k = constant regression
term, t = return period, m = coefficient regression, t = duration time of precipitation in mm, n =
adjustment parameter. K, m, n was calculated by applying logarithms to each variable to obtain
a mathematical expression that represents the variation in the intensity of precipitation as a
function of its duration (Campos, 1992).
The hydrological soil type and therefore the Curve Number with a normal antecedent
humidity (ACM II) was obtained by spatially superimposing the soil type (INETER, 2015) and
the land cover of the years 1997, 2003, 2016 and the projected year 2025. The coverage categories
were: agriculture, forest, urban, scrub, and water.
When considering an antecedent humidity III (AMC III) at the five days before the event
SCIENTIFIC ARTICLES
(design precipitation), the Curve Number III (Chow et al., 1994) was calculated using Equation
3.
SciencesRevista Torreón Universitario / Year 10 / No. 27 / February - May 2021/ ISSN: 2410-5708 / e-ISSN 2313-7215
Equation 3. Calculation of NC III
Additionally, the study area was delimited in 23 Hydrological Response Units with areas
of 3 to 14 km2 (FAO, 2002) to identify the areas that are critical due to the production of the
largest runoff generated according to their area and coverage of the earth. For the delimitation,
an 80 m Digital Elevation Model, the accumulation of the flow and the drainage network were
used. Subsequently, to contribute to the environmental management of Managua Sub-basin III,
participatory actions of a regulatory, economic, educational, and organizational nature were
proposed in critical URH´s.
RESULTS AND DISCUSSION
Net surface runoff
The net surface runoff was 352.8 m3.s-1 (cubic meters per second), 449.2 m3.s-1, 396.4,
407.5 m3.s-1, and 383.6 m3.s-1 during the years 1997, 2003, 2010, 2016 and the projected year
2025, which meant an increase of 12%, 6% and 3% during the time periods: 1997-2003, 2003-
2010, 2010-2016 and a decrease of 3% for the projected period 20016-2025 (Figure 2).
The increase in net surface runoff coincides with the increase in urban coverage (1,658
ha), scrub (1,519 ha), agriculture (712 ha), and forest (847 ha) during 1997-2016. On the other
hand, the decrease in a net surface runoff for the projected period (2016-2025) coincides mainly
with the increase in the forest (1,566 ha) and urban coverage (446 ha).
By increasing urban coverage, agriculture, scrub, and forest (in a smaller area), and
considering an antecedent humidity of 5 days, total runoff also increases. The conversion of the
forest area to crops or pastures increases the annual surface runoff causing floods and decreased
flows (Guo, et al., 2008, Notter et al., 2007; Ndulue et al., 2015; Satheeshkumar et al,. 2017).
Contrary to previous years, for the projected year 2025, the surface runoff will decrease.
One of the causes of this decrease is probably due to the high storage capacity of the soil
hydrological groups (Adham, et al., 2014) on which the coverings have changed. Since both the
SCIENTIFIC ARTICLES
urban coverage that is highly impermeable, as well as the forest cover with high water storage
capacity will increase its surface. However, whether or not forests increase runoff could depend
on its age, the extent of the vegetation cover, the root system, light, regeneration, and its effect
Sciences
on the organic matter content of the soil. In this matter, Álvarez (2010) observed that the
secondary forest generates less runoff since it has a higher water consumption due to its growthSurface runoff and participatory actions for environmental management… Úbeda Trujillo / Rocha
phase. On the other hand, Ndulue et al., (2015) observed that if the canopy coverage is reduced
to 20% and 70% of the area, greater runoff occurs in the basin (Hernández, et al., 2009, Notter
et al. , 2007).
Figure 2. Flow peaks rates in percentages by periods
Surface runoff depending on the area of the Hydrological Response Units (URH)
For the year 2016 and the projected year 2025, the greatest runoff was 47 m3.s-1, 36 m3.s-
1
, 25 m3.s-1, 13 m3.s-1, and 10 m3.s-1 (Figure 3) in the URH where 90% of agriculture and urban
coverage predominate (Figure 4). The runoff in these URH is not proportional to the area of the
same and they are also located on Sierra’s aquifer (Figure 5), which is why they are considered
critical URH; like in the case of URH 5, 13, and 14 located in the upper part of the study area,
and URH 2, 5, 6, and 13 coinciding with the areas of greatest infiltration (ALMA 2008). On the
other hand, in the critical URH, there is a predominance of urban and agricultural coverage.
In critical URHs with a predominance of urban coverage (impervious surfaces), the
net runoff increases and it is not ruled out that they are areas more prone to water erosion
(Mango, et al., 2011) and floods (Guo, et al. , 2008, Villarreal, et al., 2014, Ndulue et al., 2015)
because the potential storage of water and soil infiltration decreases on impervious surfaces
(Adham, et al., 2014). Likewise, Vammen, Katherine; Flores, Selvia; Picado, Francisco; Hurtado,
Iris; Jiménez, Mario; Sequeira, Gustavo; Flores, Yelba (2015), explained that for every square
SCIENTIFIC ARTICLES
kilometer waterproofed, the Managua aquifer ceases to receive 240,000 m3.year-1. This means
that probably during 2016 the aquifer stopped receiving 9,120,000 m3.year-1 and in 2025 it is
expected to stop receiving 10,357,250.4 m3.year-1.
Sciences
In URH's with agricultural cover, runoff increased probably due to the transition from
coffee cultivation (ALMA, 2008) to pineapple and pitahaya cultivation located on the slopes ofRevista Torreón Universitario / Year 10 / No. 27 / February - May 2021/ ISSN: 2410-5708 / e-ISSN 2313-7215
the upper part of the study area. In this sense, Hernández, et al., (2009), Notter et al., (2007)
suggest that the change towards urban coverage in the upper parts of the basin will negatively
affect runoff patterns and erosion of the slopes (Mango, et al., 2011), even if the cover is forested
with a canopy less than 50%, the runoff will increase (Ndulue et al., 2015). On the other hand,
Mango, et al., (2011) and Alemayehu, (2015) showed a greater runoff caused by the change in
land cover than by the increase in precipitation and temperature.
Figure 3. Peak flows in m3.s-1 depending on the area of each URH for the year 2016 and the projected year
2025.
SCIENTIFIC ARTICLES
SciencesSurface runoff and participatory actions for environmental management… Úbeda Trujillo / Rocha
Figure 4 Land cover for the years: (a) 2016 (b) 2025 in the URH with the highest flow peaks in Sub-basin III
of Managua.
SCIENTIFIC ARTICLES
Sciences
Figure 5 Flow peaks m3.s-1 in Managua Sub-basin III (a) Map year 2016 (b) Map projected for the year
2025 (c) Map of the URH of the study area.Revista Torreón Universitario / Year 10 / No. 27 / February - May 2021/ ISSN: 2410-5708 / e-ISSN 2313-7215
Participatory actions for environmental management of Managua Sub-basin III
The interaction between land cover and surface runoff found in critical Hydrological
Response Units (URH) necessitates a local assessment to develop appropriate actions for
environmental management (FAO, 2002). The participatory actions proposed below are of a
regulatory, economic, educational, and organizational nature (FAO, 2002; Mociño, 2015) and
for their operation, the participation of the public and private sectors is required (Table 1).
Regulatory actions
In Managua Sub-basin III there is an important role of urban coverage and agriculture
in administrative and economic terms, which causes an increase in surface runoff and the
pressure that is probably causing the aquifer. Recently, the public sector recommends creating
instruments for regulating land uses that generate incentives for land users (Leonel et al., 2013;
Lambin, EF; Meyfroidt, P; Rueda, X; Blackman, A; Borner, J; Cerutti, PO; Dietsch, T; Jungmann,
L; Lamarque, P; Lister, J; Walker, NF; Wunder, S, 2014). Therefore, it is suggested that the Mayors
and the private sector develop policy instruments such as ecological certification, geographical
indications, round tables on basic products, moratoriums, and Payments for Environmental
Services (Lambin et al., 2014), mainly in the URH which are critical.
Economic
Institutions linked to agricultural production such as MAG (Ministry of Agriculture),
INTA (Nicaraguan Institute of Agricultural Technology) and MEFCA (Ministry of Family,
Community, and Associative Economy) are recommended to implement direct and indirect
subsidies that aim to compensate farmers who simply extend their land in the upper parts of
the study area.
The direct subsidy can be managed from the funds generated by the application of
regulatory instruments. The indirect subsidy can be obtained from the water harvest made
by those farmers who simply extend their agricultural land to the highlands. Up to a 90%
reduction in the payment of agricultural property taxes is also important if they prepare a forest
management plan and commit themselves to carry it out over a period of 10 years (FAO, 2002;
Lambin et al., 2014). In this sense, Hargrave and Kis-Katos (2013) explain that the success of
stopping deforestation in the Brazilian Amazon was achieved mainly through a combination of
SCIENTIFIC ARTICLES
law enforcement on the ground, including the on-site seizure of assets along with administrative
measures to conditionality, such as conditional access to credit and trade embargoes as part of
the soy moratorium.
Sciences
One mechanism to improve cooperation between the actors involved is to support
markets. INTA, restaurants, markets, and merchants must commit to buying products fromSurface runoff and participatory actions for environmental management… Úbeda Trujillo / Rocha
farmers participating in soil conservation programs (FAO, 2002) as does the Netherlands and
the United Kingdom. Another of the public and private participatory actions is outsourcing and
the signing of memoranda of understanding, such as the case of China where local governments
signed with Walmart to promote sustainability through their supply chains (Lambin et al., 2014).
Another possibility of implementing a runoff reduction program in critical URHs is that
urban developers must contribute to the costs of future projects focused on soil conservation
(FAO, 2002). Soil conservation may contemplate the ecological management of crops,
conservation tillage, cultivation in contour lines, crops for cover and green manure, planting in
the most exposed areas, use of crop residues, delay in soil preparation of cultivation, filter strips
and delimitation of farms, grassy watercourses, cultivation in strips, construction of terraces
(Mociño, 2015).
Education
The Nicaraguan Institute of Agricultural Technology (INTA) and the Ministry of the
Environment and Natural Resources (MARENA) can organize farmers who are located in
critical URHs to participate in the environmental audit of their farms. The audit includes the
identification of potentially eroded soils. Likewise, the exchange of knowledge between farmers
could be managed from INTA, which would consist of farmers visiting farms that prepare runoff
and soil erosion prevention evaluations.
Organizational
Establish the relationship between the land users located in the upper part and the water
users located in the lower part of the basin. This relationship consists of long-term planning of
the sub-basin management and implementation of the instruments. The relationship between
users could be started through a forum where the municipalities, INTA, MARENA, MAG, among
others, participate. (FAO, 2002; Hernández, et al., 2009; Leonel, et al., 2013).
SCIENTIFIC ARTICLES
SciencesRevista Torreón Universitario / Year 10 / No. 27 / February - May 2021/ ISSN: 2410-5708 / e-ISSN 2313-7215
Table 1. Actors identified with a direct incidence in Sub-Basin III
Identified actors
Characteristics
High lands Middle lands bottom lands
Critical URH´s 5,13,14 2, 7, 16, 18, 19 6, 11, 15, 18
Cebadilla, Los Ríos,
El Edén, Las Enrama-
Las Nubes y San Managua Distritos V y
Communities das, Denis Larios, La
Ignacio VI (Sabana Grande)
Francia, Las Disper-
sas
Café El Mejor, Proce-
Airport A C Sandino,
sadores de materiales
Factory Industrial
ASOCAM, Coo- de construcción,
Business and Las Mercedes, Hotel
perativa de granjas avícolas, Tri-
Organizations Las Mercedes, Hotel
Pitahayeros de La cotextil, Pinturas Sur
unions Camino Real
Concepción ASOCAM, Unión
Cooperativa Juan
de Productores de
Ramón Robles
Ticuantepe
Source: ALMA 2008 updated with data from this research.
CONCLUSIONS
The effects of the dynamics of land cover on surface runoff indicate that 12 of the 23
URH generated the greatest runoff due to agriculture and urban coverage. These 12 URH´s
are considered critical and are also located in areas of greater infiltration, so the application of
participatory actions for environmental management is recommended.
The application of participatory actions for environmental management is often achieved
through complementary interactions between the private and public sectors. This means that if
governments provide technologies to enforce regulations related to monitoring surface runoff
and land cover dynamics, such as the case of the soybean moratorium in Brazil (Lambin et al.,
2014), then the private company must support the enforcement of regulations.
SCIENTIFIC ARTICLES
For subsequent studies, it is recommended to have information from Remote Sensors
that provide climatic data in each part of a hydrological unit to understand in this way the
behavior of other components of the hydrological cycle.
SciencesSurface runoff and participatory actions for environmental management… Úbeda Trujillo / Rocha
WORKS CITED
Adham, M., Shirazi, S., Othman, F., Rahman, rurales. http://www.fao.org/3/y3618s/
S., Yusop, Z., & Ismail, Z. (2014). Runoff y3618s00.htm
Potentiality of a Watershed through
Guo, H., Huo, Q., & Jiang, T. (2008).
SCS. The Scientific World Journal, 1-15.
Annual and seasonal streamflow
doi:10.1155/2014/379763
responses to climate and land-cover
Alemayehu, K. T. (2015). Land use land changes in the Poyang lake basin, china.
cover change and its implication on Journal of hydrology, CCCLV, 106-122.
surface runoff: a case study of baro doi:10.1016/j.jhydrol.2008.03.020
river basin in southwestern Ethiopia.
Hargrave, J., & Kis-Katos, K. (2013).
Journal of Environment and Earth Science,
Economic Causes of Deforestation in the
V(8), 2224-3216. http://www.iiste.
Brazilian Amazon: A Panel Data Analysis
org/Journals/index.php/JEES/article/
for the 2000s. Environmental and Resource
view/22025/22064
Economics, LIV(4), 441-494. doi:10.1007/
ALMA. (2008). Actualización del estudio de s10640-012-9610-2
drenaje pluvial de la Subcuenca III de la
Hernández Guzmán , R., Ruiz , L. A., Berlanga-
cuenca sur del lago de Managua. Informe
Robles, C., & Zoltán Vekerdy. (2009).
final para la municipalidad de Managua,
Evaluation of total runoff for the Rio
Alcaldía de Managua, Managua,
San Pedro sub-basin (Nayarit, Mexico).
Nicaragua.
Journal of Spatial Hydrology, IX(2), 72-85.
Campos, A. (1992). Proceso del Ciclo http://www.spatialhydrology.net/index.
Hidrológico (Segunda ed., Vol. I). php/JOSH/index
Cano, C., Andreoli, A., Arumi, J., & Rivera, D. Hershfield, D. M. (1961). Rainfall frecuencu
(2014). Uso de imágenes de satélite para atlas of U.S for duration from 30' to
evaluar los efectos de cambio de cobertura 24 h and return periods from 1-100
de suelo en la escorrentía directa de una years. Washington, DC,: U.S. Weather
Cuenca Andina. Tecnología y Ciencias del Bureau. ttps://www.lm.doe.gov/cercla/
Agua, V(4), 145-151. http://www.redalyc. documents/fernald_docs/CAT/109669.
org/articulo.oa?id=353532522009 pdf
SCIENTIFIC ARTICLES
Chow, V. T., Maidment, D., & Mays, L. (1994). Lambin, E F; Meyfroidt, P; Rueda, X;
Hidrología aplicada (Vol. I). NOMOS S.A. Blackman, A; Borner, J; Cerutti, P O;
Dietsch, T; Jungmann, L; Lamarque, P;
FAO (Food and Agriculture Organization of
Sciences
Lister, J; Walker, N F; Wunder, S. (2014).
the United Nations). (2002). Relaciones
Effectiveness and synergies of policy
tierra-agua en cuencas hidrográficasRevista Torreón Universitario / Year 10 / No. 27 / February - May 2021/ ISSN: 2410-5708 / e-ISSN 2313-7215
instruments for land use governance in
tropical regions. Global Environmental
Change, XXVIII(1), 129-140.
doi:10.1016/j.gloenvcha.2014.06.007
Leonel, H. F., Aguilar Robledo , M., & Medellín,
M. P. (2013). Gestión participativa en la
cuenca del Río Valles. Morelia, Michocán:
Centro de Investigaciones en Geografía
Ambiental, Universidad Nacional
Autónoma de México. http://www.ciga.
unam.mx
Mango, L., Melesse, A., Mcclain, M., &
Gann, S. S. (2011). Land use and climate
change impacts on the hydrology of the
upper mara river basin, Kenya: results
of a modeling study to support better
resource management. Hydroly and
Earth system Sciences, XV, 2245-2258.
doi:10.5194/hess-15-2245-2011
Miranda, A. L. (2008). Dinámica de uso y su
efecto en el escurrimiento superficial en la
cuenc del Rio Grande, Tlalchapa, Guerrero.
Tesis MSc, Estado de México. Obtained
from http://www.biblio.colpos.mx:8080/
xmlui/handle/10521/1189
SCIENTIFIC ARTICLES
SciencesYou can also read