Wavefront sensor for millimeter/submillimeter-wave adaptive optics based on aperture-plane interferometry
←
→
Page content transcription
If your browser does not render page correctly, please read the page content below
Wavefront sensor for millimeter/submillimeter-wave adaptive
                                                      optics based on aperture-plane interferometry
                                               Yoichi Tamuraa , Ryohei Kawabeb , Yuhei Fukasakuc , Kimihiro Kimuraa , Tetsutaro Uedaa , Akio
                                                 Taniguchia , Nozomi Okadad , Hideo Ogawad , Ikumi Hashimotoe , Tetsuhiro Minamidanib,f ,
                                                 Noriyuki Kawaguchib , Nario Kunoc , Yohei Togamia , Masato Hagimotoa , Satoya Nakanoa ,
                                                    Keiichi Matsudaa , Sachiko Okumurag , Tomoko Nakamurag , Mikio Kuritah , Tatsuya
                                                              Takekoshij,i , Tai Oshimab , Toshikazu Onishid , and Kotaro Kohnoi
arXiv:2102.09286v1 [astro-ph.IM] 18 Feb 2021

                                                                              a
                                                                               Nagoya University, Nagoya, 464-8602 Japan
                                                         b
                                                           National Astronomical Observatory of Japan, Mitaka, Tokyo, 181-8588 Japan
                                                                      c
                                                                        University of Tsukuba, Tsukuba, Ibaraki, 305-8573 Japan
                                                     d
                                                       Dept. Physical Science, Osaka Prefecture University, Sakai, Osaka, 599-8531 Japan
                                                 e
                                                   Dept. Aerospace Engineering, Osaka Prefecture University, Sakai, Osaka, 599-8531 Japan
                                                                        f
                                                                          Nobeyama Radio Observatory, Nagano, 384-1305 Japan
                                                                    g
                                                                      Japan Women’s University, Bunkyo, Tokyo, 112-8681 Japan
                                                                               h
                                                                                 Kyoto University, Kyoto, 606-8501 Japan
                                                       i
                                                         Institute of Astronomy, The University of Tokyo, Mitaka, Tokyo, 181-0015 Japan
                                                                j
                                                                  Kitami Institute of Technology, Kitami, Hokkaido, 090-8507 Japan

                                                                                                 ABSTRACT
                                               We present a concept of a millimeter wavefront sensor that allows real-time sensing of the surface of a ground-
                                               based millimeter/submillimeter telescope. It is becoming important for ground-based millimeter/submillimeter
                                               astronomy to make telescopes larger with keeping their surface accurate. To establish ‘millimetric adaptive optics
                                               (MAO)’ that instantaneously corrects the wavefront degradation induced by deformation of telescope optics, our
                                               wavefront sensor based on radio interferometry measures changes in excess path lengths from characteristic
                                               positions on the primary mirror surface to the focal plane. This plays a fundamental role in planed 50-m class
                                               submillimeter telescopes such as LST and AtLAST.
                                               Keywords: Submillimeter, single-dish telescope, adaptive optics, aperture-plane interferometry

                                                                                            1. INTRODUCTION
                                               The increase in size of telescopes, i.e., the acquisition of larger collecting area and spatial resolution, is the very
                                               history of observational astronomy. For millimeter and submillimeter-wave telescopes (mm/submm telescopes,
                                               hereafter), increasing the antenna diameter with keeping the mirror surface accurate is important in developing
                                               new astronomical fields. The advent of an aperture synthesis interferometer has resulted in significant improve-
                                               ment in collecting area and angular resolution. For example, the Atacama Large Millimeter/submillimeter Array
                                               (ALMA) realized the performance by keeping the size of the array element antennas moderate (D = 7 and 12 m)
                                               and increasing stiffness of them to keep their surface down to 20 µm r.m.s or even better.
                                                   However, aperture synthesis interferometry is not a panacea in realizing a larger-scale mm/submm telescope.
                                               The focal plane instruments of radio interferometers are limited to coherent receivers (e.g., heterodyne receivers)
                                               that can detect the phase of celestial signals. On the other hand, large-format arrays of direct photon detectors
                                               (e.g., cameras and integrated superconducting spectrometers1 ), which have prospered in recent years, cannot
                                               be accommodated as receivers for an aperture synthesis interferometer, because phase detection is not possible.
                                                  Further author information: (Send correspondence to Y.T.)
                                                  Y.T.: E-mail: ytamura@nagoya-u.jp, Telephone: +81 (0)52 789 2846

                                                                                                         1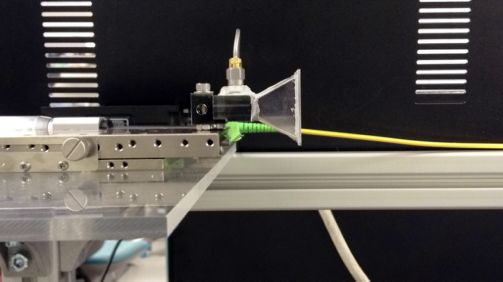
Thus, it becomes increasingly important to have a large-aperture single-dish mm/submm telescope (e.g., Large
Submillimeter Telescope2 and Atacama Large Aperture Submillimeter Telescope3 ), especially in the field in
which direct photon detector arrays play a crucial role.
   A limiting factor in size and operating frequency of mm/submm telescopes is the deterioration of optical
performance due to changes in the environment surrounding the telescope, such as wind load and thermal
deformation in addition to gravitational deformation.∗ This is unlike the visible/near-infrared (NIR) regime,
where the major cause of wavefront degradation is due to temperature inhomogeneities of the tropospheric
atmosphere on the order of tens of cm. Mm/submm telescopes have been manufactured on the premise of large
(> 10 m) structures in order to ensure the large collecting area and high spatial resolution. For this reason,
building a huge dome to cover it would require enormous costs. Therefore, it was an issue to construct an
‘exposed’ antenna outside and ensure its mirror surface with an accuracy of ∼ 20 µm.
    With the existing technology, it is possible to measure the mirror surface shape in advance by the photogram-
metry or radio holography methods, and to correct the mirror surface down to the level of ∼ 10 µm (r.m.s.) by
adjusting the positions of the primary mirror panels. In recent years, the weight reduction and enhanced stiffness
of the primary mirror structure and the active surface control of the primary mirror panels by the motorized
actuators have been used to keep the primary mirror an ideal shape with respect to changes in telescope elevation
angle.4
    The problem is, however, the deformation of the primary mirror surface and the secondary mirror support
structure due to wind load and thermal deformation. This is because the time-scale of the deformation is fairly
short compared with a typical time-scale of astronomical observations. It is difficult to measure the mirror
surface shape in real time during the observations. It is likely that most of the deformation across the primary
mirror are dominated by lower-order deformation modes. Their typical spatial scale is found to be a fraction
of the aperture diameter (1–10 m).5 The time-scale of the deformation is determined by the natural frequency
of the primary mirror structure to the wind load and is typically ∼ 10−1 –1 s (e.g., ' 1.1 s for the Nobeyama
45 m mm-wave telescope6 ). In this case, the control technology of the adaptive optics does not become a major
obstacle. The spatial and time-scales of adaptive optics control, which is already established in NIR astronomy,
are on the order of ∼ 10 cm and ∼ 1 kHz, respectively, which are several orders of magnitude higher in spatial and
temporal frequencies than those of large mm/submm telescopes. Therefore, in the radio telescope, the wavefront
compensation can be performed at the primary or secondary mirror equipped with the active surface control,
instead of a high-speed deformable mirror employed in NIR telescopes.
   Then, the major obstacle in the mm/submm regime lies in how to measure the wavefront in real time.
Wavefront sensing using a Shack-Hartmann sensor is the mainstream in the optical and NIR. A similar approach,
however, is not applicable to MAO, since no large-format detector array that can be manufactured cheaply is
available in the mm/submm. Instead, radio astronomy can exploit radio interferometry as a native wavefront
sensing technology, which measures the difference between the arrival times of the wavefronts coming through
two independent optical paths.
   In this paper, we present a concept of a mm wavefront sensor that allows real-time sensing of the primary
mirror surface of a ground-based large-aperture mm/submm telescope.

       2. APERTURE-PLANE INTERFEROMETRY FOR WAVEFRONT SENSING
As seen in the previous section, what needs to be measured first is the relative time variation of the deformation of
the optical system, rather than wavefronts of celestial signals coming through the atmosphere. This is equivalent
to the errors in excess path length (EPL) from the focus to arbitrary points on the primary surface. Therefore,
the wavefront sensor employs multiple reference microwave/mm sources placed on the aperture of the telescope
as a phase standard. The goal of the surface accuracy we measure with a prototype sensor (see later sections)
   ∗
     In the millimeter and submillimeter regime, the inhomogeneities in column density of water vapor in the troposphere
also cause wavefront degradation. However, the spatial scale at which the water vapor fluctuations dominate the wavefront
degradation is typically much longer than the telescope’s aperture, for example, & 102 m at the ALMA site. For this
reason, in most cases, the Earth’s atmosphere is not a major source of wavefront degradation for single-dish mm/submm
telescopes.

                                                           2
Secondary mirror
REFERENCE REFERENCE
Primary mirror
Delay
SWITCH
REFERENCE
CORRELATOR CORRELATOR REFERENCE CORRELATOR CORRELATOR
(a) (b) (c) (d)
Figure 1. A schematic diagram of aperture-plane interferometry. (a) A simple interferometer with a correlator which
measures a difference in arrival time between two signals coming from a common reference source. (b) The same as (a)
but one of the optical paths coming through the free space as shown with the dashed line. (c) The same as (b) but
the path through the free space goes through the telescope optics. The lengths of the other path is adjusted by a delay
line shown as a loop. (d) The same as (c) with a switch followed by an array of radiators which enables to measure the
distances from arbitrary positions to the focal point.
is 40 µm r.m.s. This is close to ≈ 100 µm r.m.s., which is routinely achieved by holographic measurements of
the Nobeyama 45 m mm-wave telescope. This measurement accuracy is equivalent to the phase accuracy of 1◦
r.m.s. when operating the wavefront sensor at 20 GHz.
Figure 1 shows the schematic diagram representing the principle of aperture-plane interferometry. A simple
interferometer comprising a correlator (figure 1a, b) allows us to measure a difference in arrival time between
two signals generated by a common reference source. The interferometer in which one of the paths goes through
the telescope optics (figure 1c) measures the EPL from a certain point on the primary surface to the focus of
the telescope. This is similar to what is used for phase calibration (the p-cal method, REF) of phase-referencing
receivers used in VLBI Exploration of Radio Astronomy (VERA7 ). The method is a scalable technique and can
be time-multiplexed by an intervening switch which is followed by a series of radiators placed across the surface
of the primary mirror (figure 1d).
The required number of reference points (i.e., radiators) depends on to what order of deformation modes
needs to be characterized. As the wavefront sensor detects the relative deformation with respect to the ideal
surface realized when the telescope structure is static, the surface needs to be adjusted by a conventional method
such as the radio holography in advance. The relative deformation of the structure induced by wind and thermal
loads emerges mostly on large spatial scales (e.g., a fraction of an aperture size).5 Therefore, a couple of tens
references across the aperture will be good enough.
We opt broadband noise as the common reference source, rather than a continuous wave (CW) or narrowband
signals. This is because in the case of CW or narrowband signals, the stray lights through multiple paths can
interfere with each other, resulting in considerable systematic errors in measurements of EPLs. On the other
hand, broadband noises are more robust against the multi-path interference, and thus they are often used for
delay calibration in aperture-synthesis interferometers such as ALMA. The EPL is imprinted as a phase slope in
a cross power spectrum (CPS) of the broadband noise. Let C(ν; EPL) = A(ν) exp [iφ(ν; EPL)] be a measured
CPS. Then, a calibrated CPS is obtained as C(ν; EPL)/C(ν; 0) = exp [i{φ(ν; EPL) − φ(ν; 0)}]. The phase of
a calibrated CPS, ∆φ(ν; EPL) ≡ φ(ν; EPL) − φ(ν; 0), induced by a certain EPL is expressed as a function of
frequency ν as
2π EPL
∆φ(ν) = 2πτ ν = ν, (1)
c
where τ is the time delay induced by EPL. This means that the slope of the CPS phase immediately gives the
EPL.
3Feed
(a) O/E (Optical (b)
SM Fibers (45−48 m) Demodulator)
Optical
Demodulator)
Optical
MEMS Optical Demodulator)
Optical Accelerometers
Switch Demodulator)
Optical
TELESCOPE Primary Mirror Optics Switch
O/E−Feed
RECEIVER SM Fiber (70 m)
CABIN
Optical Anti Aliasing Filter 20 GHz Receiver
Modulator (16−24 GHz) at Focal Point
Receiver Cabin
Switching Pattern Reference Noise Generator Correlator Power Amplifier
Generator 16−24 GHz
1 PPS/10 MHz Ref.
Figure 2. (a) The system block diagram of the prototype wavefront sensor for millimetric adaptive optics. (b) The
configuration of the wavefront sensor system mounted on the Nobeyama 45 m telescope.
3. SYSTEM
Here we describe the system of the prototype wavefront sensor for demonstration. Although this prototype only
has several elements of radiators operating at 20 GHz, which is relatively low frequency and easy to handle, the
aperture-plane interferometry is scalable up to tens to hundreds of elements at higher frequencies.
3.1 Requirement and specifications
The top-level requirement on the system is to instantaneously measure the deviation from the ideal mirror
surface with an accuracy of 40 µm r.m.s. with a time-resolution of 100 ms, well below the natural frequency
of the primary mirror structure (≈ 1 Hz). This requirement corresponds to the phase accuracy of 1 deg r.m.s.
for an operating frequency of 20 GHz. The error budget is split into (1) the statistical error of thermal noises
arising from the reference source and the receiver noise (appendix A) and (2) the systematic error due to short
term (∼ 10 s) stability of EPL measurements, whereas long term stability needs to be taken into account in the
actual implementation of the system. Table 1 summarizes the specifications of the prototype wavefront sensor.
Table 1. Specifications of the prototype wavefront sensor.
Item Value
Frequency (GHz) 16–24
Number of elements 5
3.2 Subsystems
Figure 2 shows the schematic block diagram and configuration describing how the wavefront sensor works. The
system is threefold; (1) the transmitter subsystem, which generates and transfers a reference signal, and injects
it into the telescope optics from multiple positions across the primary surface; (2) the receiver subsystem, which
collects the signal coming through the telescope optics and sends it to the correlator; and (3) the correlator sub-
system, which differentiates the arrival time of the reference signals coming directly from the reference generator
and through the telescope optics.
3.2.1 Transmitter subsystem
The transmitter subsystem comprises a reference noise generator, optical transmitter and switch, and radiators
on the primary mirror.
Reference noise generator. For the reference broadband noise, we use Johnson-Nyquist noise of a microwave
terminator amplified by a cascade of power amplifiers which is followed by a bandpass filter (17.3–23.6 GHz).
The excess noise ratio (ENR) is ≈ 70 dB. The reference noise is divided, one of which goes directly into the
correlator while the other is sent to the telescope primary mirror through the optical fiber.
4Feed Feed
(a) (b)
(Radiator) Free Space (2 m) (Receiver) Feed Horn
O/E (Optical
Demodulator)
Micrometer Stage
Low Noise
Amplifier
SM Fiber (70 m) Micrometer Stage
(c)
Optical Anti Aliasing Filter
Modulator (17.3−23.6 GHz)
Reference Noise Generator Correlator Power Amplifier
16−24 GHz
Figure 3. (a) The setup of laboratory evaluation. (b) A feed horn mounted on a micrometer stage. (c) The OCTAD-M
correlator.
Optical fiber transmission and distribution. The reference signal is transmitted on optical fiber, since
the distances to the radiators are too long to maintain the phase stability and gain of the reference signal. We
use a radio-frequency on fiber (RFoF) system (Optilab, RFLL-20-H), a pair of optical modulator (E/O) and
demodulator (O/E). We use a phase-stabilized single-mode fiber (Sumitomo Electric) with a linear expansion
coefficient of 4.7 × 10⁻⁶ K−1 . The optical signal leaving the E/O is coupled with one of the five O/Es placed
on the backup structure of the primary mirror by switching over the fibers with a MEMS-based optical switch
placed closed to the central hub of the primary mirror.
Feed horn on the primary mirror. The reference signal is demodulated with the O/E and is radiated by
one of five identical feed horns placed on the surface of the primary mirror. We choose a linear-polarized feed
horn as a reference signal radiator as the operating frequency is broad (∆f /f = 0.4). The gain and half-power
beam-width at 20 GHz are 20 dBi and 10◦ , respectively. The feed horns are placed at a radius of 16 m with
position angles of −18◦ (top), 90◦ (left), 180◦ (bottom), and 270◦ (right), and at r = 5 m with a position angle
of 0◦ (center; see also figure 2b).
3.2.2 Receiver subsystem
We use the H22 receiver,† a science-grade cryogenic coherent receiver operating at 20 GHz. The typical system
noise temperature is Tsys = 100 K. H22 detects two circular polarization, while we only use one of them for
phase measurements. The receiver output is amplified and the bandwidth is constrained by the anti-aliasing
filter before the signal goes into the correlator.
3.2.3 Correlator subsystem
We develop a FX-type digital correlator, OCTAD-M (ELECS Inc.), which is based on the architecture initially
developed for the FPGA-based fast Fourier transform (FFT) spectrometer OCTAD-S.8 OCTAD-M is equipped
with two 3-bit analog-to-digital converters with 16.384 GSa/s. We opt the third-order mode (16.384–24.576 GHz)
of analog input signals, allowing us to directly sample the H22 receiver output with no down conversion. Two
input signals are FFTed first and are multiplied to obtain the cross-power spectrum. The spectra are accumulated
for 5 or 10 msec. OCTAD-M has a digital delay capability with up to 215 times sampling clock time, allowing to
digitally insert an instrumental delay of 0–2 µsec, corresponding to 0–599.585 m for free-space geometrical delay.
3.2.4 Computing/control subsystem
To synchronize the optical switch and the correlator sampling, we use common 1 PPS and 10 MHz reference
signals fed by the observatory GPS server. System control and data acquisition are performed by a single Linux
server.
†
https://www.nro.nao.ac.jp/˜nro45mrt/html/prop/status/Status latest.html
5450 16
Measured
EPL measured by phase slope (mm)
Predicted 40
Cross power spectrum phase (deg)
14
Mean: 4.8 μm
360 15 mm 12 Std. dev.: 17.4 μm
14 mm 20
Error in EPL (µm)
13 mm
270 12 mm 10
11 mm
10 mm 8 0
9 mm
180 8 mm 6
7 mm
6 mm -20
5 mm 4
90 4 mm System requirement
3 mm 2 (± 40 μm)
2 mm -40
0 1 mm 0
16 17 18 19 20 21 22 23 24 0 2 4 6 8 10 12 14 16 0 2 4 6 8 10 12 14 16
Frequency (GHz) EPL induced by micrometer stage (mm) EPL induced by micrometer stage (mm)
(a) (b) (c)
Figure 4. (a) The cross power spectrum (CPS) phases measured for different excess path lengths (EPLs) induced by
mechanical deviation of the micrometer stage z. (b) The EPL measured by the phase slope as a function of z. (c) The
residual, EPL−z, as a function of z. The error bar on each plot accounts for the 1σ error in linear regression of the
CPS phase. The average of the residuals is 4.8 µm with a standard deviation of 17.4 µm. The grey region represents the
system requirement (±40 µm).
3.3 Ancillary devices
To help the wavefront sensing experiment, we use ancillary devices placed on and around the Nobeyama 45 m
telescope. We have six piezoelectric accelerometers attached to the backup structure of the primary mirror,9
which are placed close to the edge of the primary mirror with position angles of 0◦ (top), 45◦ , 90◦ (left), 180◦
(bottom), 270◦ (right), and close to the central hub (see figure 2b). We also use a weather monitor placed at the
top of a 50-m tall meteorological tower, which is located 75 m north of the telescope.‡
4. DEMONSTRATION
4.1 Laboratory evaluation of linearity and accuracy in excess path length measurements
In advance to the on-site demonstration, we evaluate the linearity, accuracy, and stability of the system with
respect to mechanical change in EPL. Although neither the actual telescope optics nor the H22 receiver is
available in the lab, we use almost the same configuration of the other subsystems which are used for the on-site
measurements. The configuration of the lab experiment is shown in figure 3. Here we use a feed horn followed
by a power amplifier and a bandpass filter instead of the H22 receiver. We placed the two feed horns of the
radiator and receiver ≈ 2 m away from each other. The radiator feed horn is placed on the micrometer stage
that slides on a straight rail to mechanically change the EPL between the radiator and receiver, mimicking the
deformation of the telescope optics. The mechanical accuracy of the micrometer stage is 3 µm.
We measure the CPS phase at z = 0, 1, 2, ..., 15 mm, where z is the EPL induced by the mechanical deviation
of the micrometer stage. The CPS is calibrated for the complex bandpass (i.e., amplitude and phase) by dividing
the CPS by that of z = 0. Figure 5a shows the calibrated CPS phases obtained at z = 1, 2, 3, ..., 15 mm.
The CPS is running-averaged with a rectangle window of 300 MHz. We see a linear slope for each CPS phase
although a small fluctuation remains around the best-fitting line. Since the statistical error of the CPS phase is
almost negligible, the fluctuation could be dominated by systematic errors such as standing waves, multi-path
interference, or phase drift of the system. As shown in figure 5b, the EPL derived from equation 2 is linear with
respect to the mechanical deviation z. Figure 5c shows the residual of the measured EPL subtracted by z as a
function of z. The average of the residuals is 4.8 µm with a standard deviation of 17.4 µm, which is well below
the system requirement of < 40 µm, confirming the system linearity and accuracy.
‡
https://www.nro.nao.ac.jp/˜nro45mrt/html/obs/weather/
620 20
Vwind (m/s) Acc. (mm/s2) CPS phase at 20 GHz (deg)
Vwind (m/s) Acc. (mm/s2) CPS phase at 20 GHz (deg)
10 10
0 0
-10 -10
Phase acc. Phase acc.
Phase Phase
-20 -20
50 50
0 0
top top
-50 center -50 center
15 15
10 10
5 5
0 0
0 5 10 15 20 25 30 0 5 10 15 20 25 30
Time (s) Time (s)
(a) (b)
−1
Figure 5. (a) The cross power spectrum (CPS) phase obtained under a very windy (5–10 m s ) condition and (b) under
a moderately windy (∼ 5 m s−1 ) condition. The time origins are 3:21:00 on 2020 November 22 UTC and 2:09:00 on 2020
November 23 UTC, respectively. (Top) The CPS phase measured at the ‘top’ position of the 45 m primary mirror (blue
curve). As the CPS is measured at 20 GHz (λ ≈ 15 mm), a phase shift of 10 deg approximately corresponds to a surface
deviation of 400 µm. The grey curve represents its second-order differential in arbitrary units. (Center) The acceleration
measured with two accelerometers attached to the top edge (blue) and the center (purple) of the 45 m primary mirror.
(Bottom) The wind speed measured with a weather monitor placed atop the 50-m tall tower located 75 m north of the
45 m telescope.
4.2 Demonstration at the Nobeyama 45 m telescope
We carried out a commissioning campaign of the MAO wavefront sensor with the Nobeyama 45 m telescope
in 2020 November. The goals are to confirm that the wavefront sensor actually works as designed and to
demonstrate that aperture plane interferometry allows us to measure an EPL in real time. In this campaign,
only 2 radiators were installed at the ‘top’ and ‘center’ positions.
The top pannels of figures 5a and 5b show the temporal changes in CPS phase at 20 GHz, which were taken
under very windy (5–10 m s−1 ) and moderate (∼ 5 m s−1 ) conditions, respectively. A large phase drift and
small ∼ 3 Hz ripples in it are clearly seen in the very windy condition, while the drift is rather suppressed under
the moderate condition. This fact suggests that the CPS phase measures the EPL change induced by the wind
load, although further analyses are necessary. This is also supported by the measurements of the piezoelectric
accelerometer at the ‘top’ position; a constant ∼ 3 Hz oscillation in addition to intermittent slow (∼ 1.5 Hz),
high-amplitude oscillations due to a series of gust are evident in figure 5a, whereas no clear oscillation is seen in
figure 5b.
5. CONCLUSIONS
We present a concept of a millimeter wavefront sensor which allows real-time sensing of the primary mirror surface
of a future 50-m class mm/submm telescope, such as LST and AtLAST. To establish millimetric adaptive optics
(MAO) that instantaneously corrects the wavefront degradation induced by deformation of telescope optics due
to wind and thermal loads, our wavefront sensor employs aperture-plane interferometry to measure real-time
changes in EPLs from characteristic points on the primary surface to the focal plain. The proposed wavefront
sensor operates at 16–24 GHz, which is cost-effective and is accurate enough to measure the EPL down to the
level of 40 µm r.m.s. as demonstrated in the laboratory evaluation. Although the verification is in progress, we
have demonstrated that a 2-element pilot wavefront sensor with the Nobeyama 45 m telescope worked properly
and detected the EPL change induced by wind load on the telescope structure.
7APPENDIX A. SENSITIVITY
In general, the variance of the cross power spectrum is given by
(S1 + N1 ) · (S2 + N2 ) + S1 S2
σ2 = ,
2∆ν ∆t
where Si and Ni (i = 1, 2) are the correlated and non-correlated components of the cross power spectrum of two
incident signals, respectively. Therefore, the S/N of the cross power spectrum is
√ √
S1 S2 2∆ν ∆t
SNR = p .
(S1 + N1 ) · (S2 + N2 ) + S1 S2
Here, the correlated and non-correlated components input directly to the correlator from the reference signal
source (reference continuum source) are S1 , N1 , and components input to the correlator via the transmission
system and optical system are S2 , N2 , then S1
N1 , so the S/N per spectral channel of the cross power spectrum
can be approximated as
√ 0.5 0.5 −0.5
2∆ν ∆t p ∆ν ∆t N2 /S2
SNR ≈ p ∼ 2∆ν ∆t (S2 /N2 ) ≈ 8.16 ,
N2 /S2 + 2 1 MHz 10 ms 300
where N2 /S2 ∼ O(102 )
2 is assumed for the second approximation. If we assume that S/N of signal estimated
√
using all ns spectral channels is scaled with ns for S/N per channel, then
0.5 0.5 −0.5
∆ν ∆t N2 /S2
SNRtot ≈ 739 .
8192 MHz 10 ms 300
Assuming that thermal noise dominates N2 and the cross power spectrum has isotropic dispersion on the
complex plane, the uncertainty of the phase θ is σθ ∼ 1/SNRtot (radian). Therefore,
−0.5 −0.5 0.5
∆ν ∆t N2 /S2
σθ ≈ 0.078 (deg) ×
8192 MHz 10 ms 300
If the value is fiducial, sufficient phase measurement accuracy can be achieved. In other words, it is necessary
to obtain a correlator input signal that satisfies N2 /S2 < 300.
ACKNOWLEDGMENTS
We acknowledge K. Handa, C. Miyazawa, T. Kanzawa, T. Wada, and M. Saito for their support. This work was
supported by JSPS KAKENHI (Grant No. 17H06206) and NAOJ Research Coordination Committee, NINS.
REFERENCES
[1] Endo, A., Karatsu, K., Laguna, A. P., Mirzaei, B., Huiting, R., Thoen, D. J., Murugesan, V., Yates, S.
J. C., Bueno, J., Marrewijk, N. v., Bosma, S., Yurduseven, O., Llombart, N., Suzuki, J., Naruse, M., de
Visser, P. J., van der Werf, P. P., Klapwijk, T. M., and Baselmans, J. J. A., “Wideband on-chip terahertz
spectrometer based on a superconducting filterbank,” Journal of Astronomical Telescopes, Instruments, and
Systems 5, 035004 (July 2019).
[2] Kawabe, R., Kohno, K., Tamura, Y., Takekoshi, T., Oshima, T., and Ishii, S., “New 50-m-class single-dish
telescope: Large Submillimeter Telescope (LST),” in [Society of Photo-Optical Instrumentation Engineers
(SPIE) Conference Series ], Society of Photo-Optical Instrumentation Engineers (SPIE) Conference Series
9906, 990626 (2016).
[3] Klaassen, P. D., Mroczkowski, T. K., Cicone, C., Hatziminaoglou, E., Sartori, S., De Breuck, C., Bryan, S.,
Dicker, S. R., Duran, C., Groppi, C., Kaercher, H., Kawabe, R., Kohno, K., and Geach, J., “The Atacama
Large Aperture Submillimeter Telescope (AtLAST),” in [Society of Photo-Optical Instrumentation Engineers
(SPIE) Conference Series ], Society of Photo-Optical Instrumentation Engineers (SPIE) Conference Series
11445, 114452F (Dec. 2020).
8[4] Hughes, D. H., Jáuregui Correa, J.-C., Schloerb, F. P., Erickson, N., Romero, J. G., Heyer, M., Reynoso,
D. H., Narayanan, G., Perez-Grovas, A. S., Souccar, K., Wilson, G., and Yun, M., “The Large Millimeter
Telescope,” in [Ground-based and Airborne Telescopes III], Stepp, L. M., Gilmozzi, R., and Hall, H. J., eds.,
Society of Photo-Optical Instrumentation Engineers (SPIE) Conference Series 7733, 773312 (July 2010).
[5] Levy, R., [Structural engineering of microwave antennas for electrical, mechanical, and civil engineers ] (1996).
[6] Smith, D. R., Paglione, T. A., Lovell, A. J., Ukita, N., and Matsuo, H., “Measurements of dynamic pointing
variations of a large radio telescope,” in [Radio Telescopes], Butcher, H. R., ed., Society of Photo-Optical
Instrumentation Engineers (SPIE) Conference Series 4015, 467–475 (July 2000).
[7] Kobayashi, H., Sasao, T., Kawaguchi, N., Manabe, S., Omodaka, T., Kameya, O., Shibata, K. M., Miyaji, T.,
Honma, M., Tamura, Y., Hirota, T., Kuji, S., Horiai, K., Sakai, S., Sato, K., Iwadate, K., Kanya, Y., Ujihara,
H., Jike, T., Fujii, T., Motiduki, N., Oyama, T., Kurayama, H., Kamohara, R., Suda, H., and Kasuga, T.,
[VERA: A New VLBI Instrument Free from the Atmosphere], vol. 306 of Astronomical Society of the Pacific
Conference Series, 367 (2003).
[8] Iwai, K., Kubo, Y., Ishibashi, H., Naoi, T., Harada, K., Ema, K., Hayashi, Y., and Chikahiro, Y., “OCTAD-S:
digital fast Fourier transform spectrometers by FPGA,” Earth, Planets, and Space 69, 95 (July 2017).
[9] Hashimoto, I., Chiba, M., Okada, N., Ogawa, H., Kawabe, R., Minamidani, M., Tamura, Y., and Kimura,
K., “Wind- and Operation-Induced Vibration Measurements of the Main Reflector of the Nobeyama 45 m
Radio Telescope,” Journal of Vibration Engineering & Technologies 8, 909 (2020).
9You can also read