Twenty-five years of cloud base height measurements by ceilometer in Ny-Ålesund, Svalbard
←
→
Page content transcription
If your browser does not render page correctly, please read the page content below
Earth Syst. Sci. Data, 10, 1451–1456, 2018
https://doi.org/10.5194/essd-10-1451-2018
© Author(s) 2018. This work is distributed under
the Creative Commons Attribution 4.0 License.

       Twenty-five years of cloud base height measurements by
                 ceilometer in Ny-Ålesund, Svalbard
                                              Marion Maturilli1 and Kerstin Ebell2
            1 Alfred   Wegener Institute Helmholtz Centre for Polar and Marine Research, 14473 Potsdam, Germany
                 2 Institutefor Geophysics and Meteorology, University of Cologne, 50969 Cologne, Germany
                                 Correspondence: Marion Maturilli (marion.maturilli@awi.de)

                                        Received: 5 April 2018 – Discussion started: 17 April 2018
                               Revised: 18 July 2018 – Accepted: 18 July 2018 – Published: 15 August 2018

       Abstract. Clouds are a key factor for the Arctic amplification of global warming, but their actual appearance
       and distribution are still afflicted by large uncertainty. On the Arctic-wide scale, large discrepancies are found
       between the various reanalyses and satellite products, respectively. Although ground-based observations by re-
       mote sensing are limited to point measurements, they have the advantage of obtaining extended time series of
       vertically resolved cloud properties. Here, we present a 25-year data record of cloud base height measured by
       ceilometer at the Ny-Ålesund, Svalbard, Arctic site. We explain the composition of the three sub-periods with
       different instrumentation contributing to the data set, and show examples of potential application areas. Linked
       to cyclonic activity, the cloud base height provides essential information for the interpretation of the surface
       radiation balance and contributes to the understanding of meteorological processes. Furthermore, it is a useful
       auxiliary component for the analysis of advanced technologies that provide insight into cloud microphysical
       properties, like the cloud radar. The long-term time series also allows derivation of an annual cycle of the cloud
       occurrence frequency, revealing the more frequent cloud cover in summer and the lowest cloud cover amount
       in April. However, as the use of different ceilometer instruments over the years potentially imposed inhomo-
       geneities onto the data record, any long-term trend analysis should be avoided.
          The Ny-Ålesund cloud base height data from August 1992 to July 2017 are provided in a high tem-
       poral resolution of 5 min (1 min) before (after) July 1998, respectively, at the PANGAEA repository
       (https://doi.org/10.1594/PANGAEA.880300).

1   Introduction                                                      change, affecting the radiation budget in this sensitive part of
                                                                      the climate system. Especially low-level mixed-phase clouds
The Arctic amplification of global climate warming is at-             have the potential to significantly contribute to Arctic warm-
tributed to several factors and their feedback processes in the       ing (Bennartz et al., 2013), while their formation and persis-
climate system. Contributing to the enhanced high-latitude            tence is not well captured in numerical models. The uncertain
warming are the sea ice–albedo effect, the lapse rate feed-           range of Arctic clouds and their radiative impact contribute
back (Pithan and Mauritsen, 2014), atmospheric heat and               to the large spread across current climate models (Karlsson
moisture advection (Park et al., 2015), ocean heat transport          and Svensson, 2011).
(Chylek et al., 2009), aerosol effects, and potentially oth-             Moreover, Arctic-wide observations of clouds by satellite
ers, all linked in complex relations. Particularly clouds are         show discrepancies between data sets that arise from differ-
known as a major contributor to Arctic amplification (Curry           ences in instruments and cloud detection algorithms, which
et al., 1996). As a result of the warmer and moister climate,         are crucial under typical Arctic conditions with very low
both macrophysical (e.g. cloud base height, vertical geomet-          thermal and radiance contrasts between clouds and the un-
ric thickness, horizontal extent) and microphysical (e.g. par-        derlying ice and snow surface (Chernokulsky and Mokhov,
ticle size and phase) characteristics of Arctic clouds may

Published by Copernicus Publications.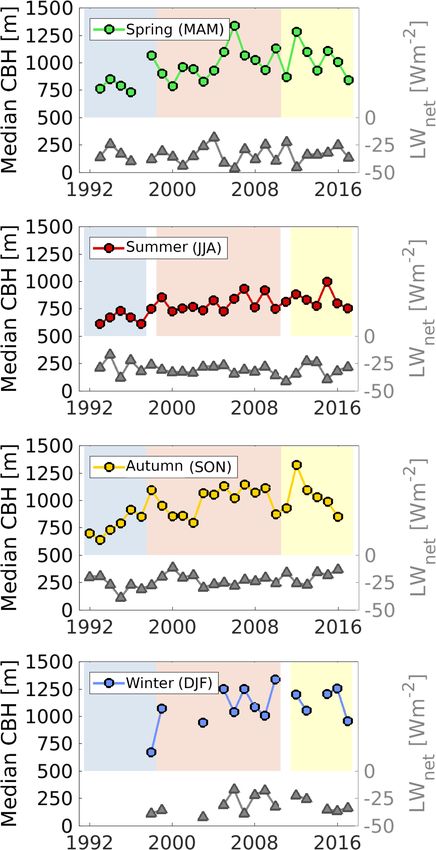
1452                                             M. Maturilli and K. Ebell: Twenty-five years of cloud base height measurements

Table 1. The three instrument types that contributed to the cloud base height data set by ceilometer measurements in Ny-Ålesund, and the
temporal and spatial resolution of their data.

                     Instrument type                 LD-WHX05              LD-40                CL-51
                     Observation period              1 August 1992         14 July 1998         25 August 2011
                                                     to 13 July 1998       to 24 August 2011    to at least July 2017
                     Provided temporal resolution    5 min                 1 min                1 min
                     Cloud reporting range           3650 m                13 000 m             13 000 m
                     Vertical resolution             10 m (below 300 m)    7.5 m                10 m
                                                     20 m (above 320 m)

2012). Surface-based remote sensing is limited to point ob-
servations that potentially are not representative of a larger
area but that have the advantage of higher vertical and tem-
poral resolution. Though the combination of more sophisti-
cated techniques provides detailed observational data of var-
ious cloud parameters (Shupe et al., 2008), even the perspic-
uous and easy-to-retrieve cloud base height data by ceilome-
ter measurements contribute to a better understanding of the
general properties of Arctic clouds. Under cloudy conditions,
the cloud base is the effective height of downward long-wave
emission, and thus affects the downward component of long-
wave radiation observed at the surface. Here, we present
a 25-year ceilometer cloud base height data set from Ny-
Ålesund, Svalbard, indicate the potential application areas by
providing several examples, and point out limitations of the
data set with regard to trend analysis.

2   Data

Among the broad suite of instrumentation in Ny-Ålesund,
Svalbard, the Alfred Wegener Institute has operated laser             Figure 1. The CL-51 ceilometer (indicated by a white arrow) lo-
ceilometer measurements for the detection of cloud base               cated in the vicinity of the radiation measurements of the AWIPEV
                                                                      station at Ny-Ålesund, in April 2013. In the background the balloon
height since August 1992 (Maturilli and Herber, 2017). The
                                                                      facility for radiosonde launches, and a red tethered balloon (photo:
measurement principle is that of light detection and ranging          Jürgen Graeser).
(lidar): a pulsed laser beam is sent vertically to the atmo-
sphere, where light is scattered back by air molecules and
particles. By detecting the run-time of the return signal, the
ceilometer identifies the lowest altitude of a cloud as the layer     problems with the instrumentation. In all available months,
with higher particle backscatter characteristics. For the more        the code 99999 marks that no cloud has been detected. De-
powerful systems it is possible to detect up to three cloud           tails on the associated measurement periods of the respective
layers if the lower cloud deck is optically thin enough to al-        instruments and the data resolution are given in Table 1.
low the transmittance of the laser beam and the backscattered            Obviously, the instruments have different upper detection
light from the upper cloud layer. The described Ny-Ålesund            limits for the cloud base height. While the older instrument
data have been retrieved by commercial ceilometer systems,            did not report clouds above 3650 m and was thus blind for
and the corresponding operational software was used to iden-          high clouds, the newer instruments easily cover the whole
tify the cloud base height (CBH). In the presented period             troposphere. Furthermore, it is likely that higher laser power
August 1992 to July 2017, three different instruments have            and improved receiving hardware increased the sensitivity
been applied for the measurements: (1) LD-WHX by Im-                  for cloud detection in the newer systems, potentially affect-
pulsphysik GmbH, (2) LD-40 by Vaisala, and (3) CL-51 by               ing the observed frequency of clear-sky conditions. Although
Vaisala (Fig. 1, respectively). Missing months in the data            the longer pulse duration of 100 ns for CL-51 compared to
series are February 1993, February to May 1997, Decem-                75 ns for LD-40 has reduced the vertical resolution (Table 1),
ber 1999 to March 2000, and March 2000, due to technical              a higher laser pulse energy of 3 µJ instead of 1 µJ at the same

Earth Syst. Sci. Data, 10, 1451–1456, 2018                                             www.earth-syst-sci-data.net/10/1451/2018/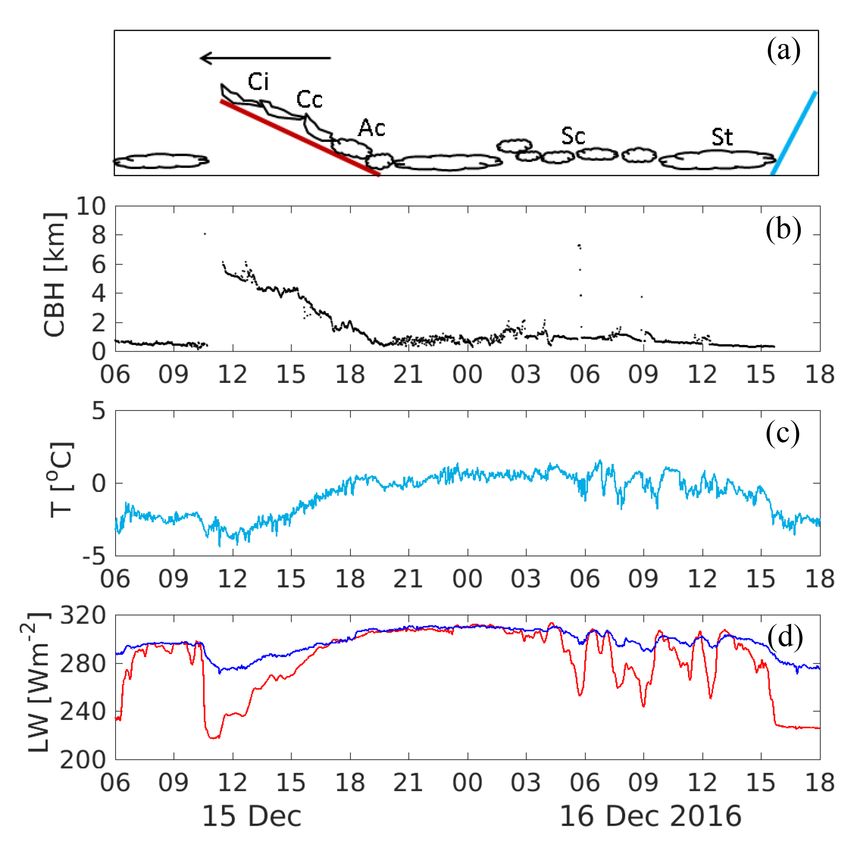
M. Maturilli and K. Ebell: Twenty-five years of cloud base height measurements                                                  1453

                                                                       with a compact cloud deck with base heights at about 400
                                                                       to 700 m. The clouds disappeared at about 10:40 UTC, un-
                                                                       veiling clear-sky conditions for about 1 h. At 11:30 UTC,
                                                                       clouds appear with a base height at 6 km, descending dur-
                                                                       ing the next 7 h to cloud base heights below 1 km. The de-
                                                                       scent of the cloud base is a typical feature of an approach-
                                                                       ing warm front that is inclined forward in the upper atmo-
                                                                       sphere as indicated in the schematic diagram in the upper
                                                                       panel of Fig. 2. Indeed, during this warm front phase an in-
                                                                       crease in temperature is observed from about −4 to about
                                                                       0 ◦ C. Since by this time the effect of warm air advection
                                                                       within the cyclone’s warm air sector has not yet reached
                                                                       the surface, the increase in 2 m air temperature is likely re-
                                                                       lated to the radiative effect of the warm front associated
                                                                       cloud cover. As the ceilometer is operated in close vicinity
                                                                       to the instrumental set-up for the Baseline Surface Radia-
                                                                       tion Network (BSRN) described in Maturilli et al. (2015), all
                                                                       surface radiation balance parameters are available. The pre-
                                                                       sented case refers to December, implying polar night con-
Figure 2. A frontal passage on 15/16 December 2016 in Ny-              ditions at Ny-Ålesund and therefore reducing the radiation
Ålesund. (a) Schematic diagram of the warm front (red line) and        balance to the contribution by the long-wave components
cold front (blue line), their moving direction (black arrow), and
                                                                       measured by Eppley PIR pyrgeometers. Basically, the up-
associated clouds (Ci: cirrus, Cc: cirrocumulus, Ac: altocumulus,
                                                                       ward long-wave radiation LWup closely follows the air tem-
Sc: stratocumulus, St: stratus), respectively. (b) Cloud base height
(CBH) from ceilometer measurements. (c) 2 m air temperature from       perature, while the downward long-wave radiation LWdown
surface meteorological observations. (d) Upward and downward           is very much affected by the presence of clouds in the at-
long-wave radiation (blue and red lines, respectively) from surface    mospheric column. They both contribute to the surface net
radiation measurements.                                                long-wave radiation LWnet which is close to zero for overcast
                                                                       conditions and can take large negative values for clear-sky
                                                                       conditions, also known as the “cloudy” and “opaque” Arctic
pulse rate, respectively, surely increased the signal-to-noise         winter states (Stramler et al., 2011), respectively. Indeed, we
ratio and thus the sensitivity for the detection of thin clouds.       find a large difference for the up- and down-ward long-wave
Overall, every renewal of the instrumentation brought an in-           radiation of about LWnet = LWup − LWdown = −60 W m−2
crease in sensitivity and precision in cloud base detection.           during the clear-sky hour before the first cirrus clouds of the
This qualitative improvement has positive effects on the re-           warm front occur. This difference reduces as the cloud base
cent analysis of cloud-related process studies. On the other           descends. The resulting increase in LWnet contributes to the
hand, the change in instrumentation leads to inhomogeneity             observed increase in temperature. By about 19:00 UTC, the
of the data set regarding the long-term climate record. Both           warm front also passes at surface level, accompanied by an
aspects will be highlighted in the next sections.                      intensification of surface wind speed (not shown). The now
                                                                       present warm air sector of the cyclone is associated with low
3     Cloud base height for process studies                            stratiform clouds, representing the “opaque” state with net
                                                                       long-wave radiation around 0 W m−2 . The temperature is sta-
The high temporal resolution of 1 min (5 min before Au-                bly warm around freezing until the cloud deck loosens up in
gust 1998, respectively) of the cloud base height data enables         the early morning hours of 16 December. Once the clouds
detailed process studies of the changing cloud structure and           get patchier, the downward long-wave radiation partly ar-
its relation to varying meteorological conditions.                     rives from higher and colder parts of the atmosphere, result-
                                                                       ing in an interplay of “clear” and “opaque” radiation condi-
                                                                       tions and corresponding air temperature fluctuations. In these
3.1    Cloud base height in a meteorological context
                                                                       conditions, the ceilometer laser beam can also pass in be-
Clouds are an indicator of the synoptic situation, and the             tween the lowermost clouds, receiving the cloud base height
cloud base height provided by the ceilometer is associated             from an upper-level cloud. The cyclonic influence ends by
with e.g. the changing cloud deck during the passage of a              about 15:30 UTC, when the clouds disappear after a period
frontal system. Here, we show an example of a small cy-                with precipitation, the long-wave radiation drops back to the
clonic system passing Ny-Ålesund on 15/16 December 2016                “clear” state, and air temperature decreases. It remains un-
(Fig. 2). In the early morning hours of 15 December, tem-              clear whether these changes are caused by a weak cold front,
peratures at the surface were a few degrees below freezing,            as neither a change in wind speed nor a change in wind direc-

www.earth-syst-sci-data.net/10/1451/2018/                                             Earth Syst. Sci. Data, 10, 1451–1456, 2018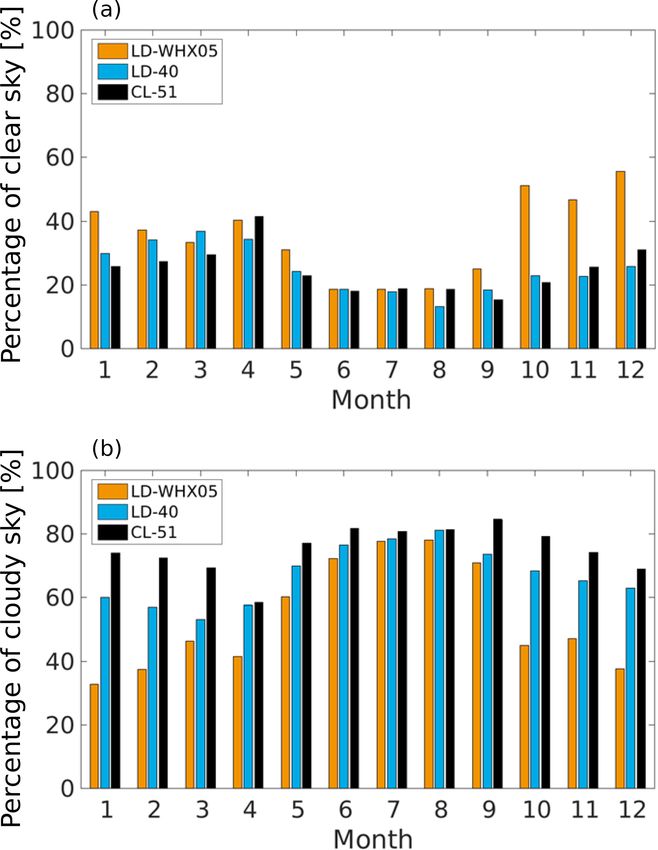
1454                                           M. Maturilli and K. Ebell: Twenty-five years of cloud base height measurements

                                                                     height, the radar signal is caused by precipitating particles.
                                                                     Based on vertical temperature information, we even know
                                                                     that the liquid layer is supercooled and that the precipitation
                                                                     below is snow. The cloud observed on 23 November 2016 is
                                                                     a typical example of an Arctic low-level mixed-phase cloud.
                                                                     Only the combination of cloud radar and ceilometer thus
                                                                     allows for a comprehensive view of this ubiquitous Arctic
                                                                     cloud type.

                                                                     4   Cloud base height for long-term climate studies
Figure 3. Time–height series of the cloud radar reflectivity fac-
tor on 23 November 2016 between 10:00 and 20:00 UTC at Ny-           With cloud base measurements available since 1992 and tem-
Ålesund. Black dots indicate the cloud base height from ceilometer   perature and radiation changes observed during the same pe-
measurements.                                                        riod (Maturilli et al., 2013, 2015), it seems a natural conse-
                                                                     quence to analyse the ceilometer data set with regard to long-
                                                                     term changes in cloud base height. However, here we want to
tion was observed, and the remnants of the cyclone dissolved         emphasize that the data set is not suited for long-term trend
over Svalbard before the next cyclone approached.                    analysis due to the inhomogeneity of the data retrieval within
   Overall, the cloud base height provided by the ceilometer         the time series. The different instrumentation used over the
allows an interpretation of the involved synoptic cloud types,       years (Table 1) had diverse sensitivities and maximum detec-
and an estimation of their effect on the surface radiation.          tion limits, and even for a single instrument a drift in sensi-
                                                                     tivity over the years cannot be excluded. Therefore, potential
3.2    Cloud base height as an auxiliary for in situ and
                                                                     changes shown here may not be unambiguously attributed
       remote sensing cloud measurements
                                                                     to actual changes in the atmosphere, but may be due to the
                                                                     inhomogeneity of the data caused by the different instrumen-
To approach the comprehensive characterization of macro-             tation.
and micro-physical cloud parameters in Ny-Ålesund, a                    The annual cycle of the clear-sky and cloudy conditions
94 GHz frequency modulated continuous wave cloud radar               in Ny-Ålesund is shown in Fig. 4. Here, the data have been
(Küchler et al., 2017) was installed on the roof of the AW-          divided into subsets of different instruments, referring to
IPEV atmospheric observatory in June 2016 by the Univer-             August 1992 to June 1998 (LD-WHX05), August 1998 to
sity of Cologne within the framework of the Transregional            June 2011 (LD-40), and September 2011 to July 2017 (CL-
Collaborative Research Center’s (TR 172) “ArctiC Ampli-              51). The apportioned months July 1998 and August 2011
fication: Climate Relevant Atmospheric and SurfaCe Pro-              have been excluded, as well as all months that had more than
cesses, and Feedback Mechanisms (AC)3 ” (Wendisch et al.,            20 % missing data (February 1993, February–May 1997,
2017). The cloud radar provides vertical profiles of radar           July 1999, January–March 2000, and August 2000, respec-
reflectivity factor, Doppler velocity, and Doppler spectral          tively). Obviously, the early instrument with the lowest cloud
width from 150 m to 10 km above ground. An example of                height detection limit apparently identified the largest per-
a time–height series of the radar reflectivity factor, which         centage of clear-sky cases, with the largest deviation to the
was measured at the AWIPEV atmospheric observatory on                other subsets in late autumn and winter. Consequently, fewer
23 November 2016 between 10:00 and 20:00 UTC, is given               cloud cases were detected in the early period, most likely
in Fig. 3. In contrast to a lidar instrument, which is very sensi-   caused by the instrument’s low cloud height detection limit
tive to small particles like cloud droplets and aerosol, a cloud     and thus blindness to clouds above 3650 m. Still, differences
radar is also sensitive to larger particles such as rain, driz-      may also occur between the subsets of the latter two instru-
zle drops and snow. The observed backscattered signal of the         ments due to the lack of a quantitative CBH definition. If
cloud radar might thus be generated by different hydrome-            a change in the occurrence frequency of clouds over Ny-
teor types. Therefore, it is very difficult to discriminate be-      Ålesund occurred over the 25-year period, it may still be
tween liquid cloud droplets and precipitating particles (rain        masked by the effects of the diverse technical parameters of
or snow) from cloud radar observations alone. By includ-             the different instruments (e.g. signal-to-noise ratio), or sim-
ing ceilometer observations, e.g. the ceilometer cloud base          ply by the different applied algorithms for cloud determi-
height (black dots in Fig. 3), we can better identify cloud          nation. As the ceilometers have been sequentially operated
droplet layers, i.e. layers where the lidar backscatter is high.     without any overlap period, it is impossible to quantify the
On 23 November 2016, such a liquid layer is observed by the          variability between the used instruments. Nevertheless, some
ceilometer with cloud base heights at ∼ 1 km at 10:00 UTC            general conclusions can be drawn from the observations: the
to 1.4 km at 18:00 UTC. Below the observed cloud base                extended summer season May to September reveals the low-

Earth Syst. Sci. Data, 10, 1451–1456, 2018                                           www.earth-syst-sci-data.net/10/1451/2018/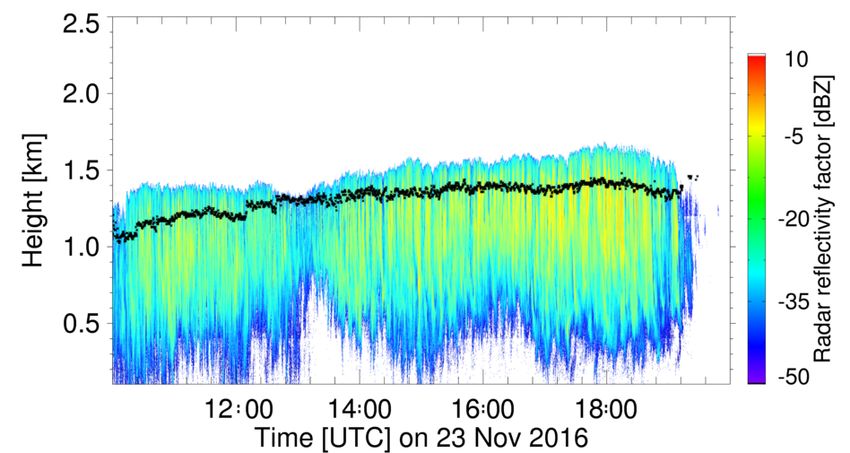
M. Maturilli and K. Ebell: Twenty-five years of cloud base height measurements 1455
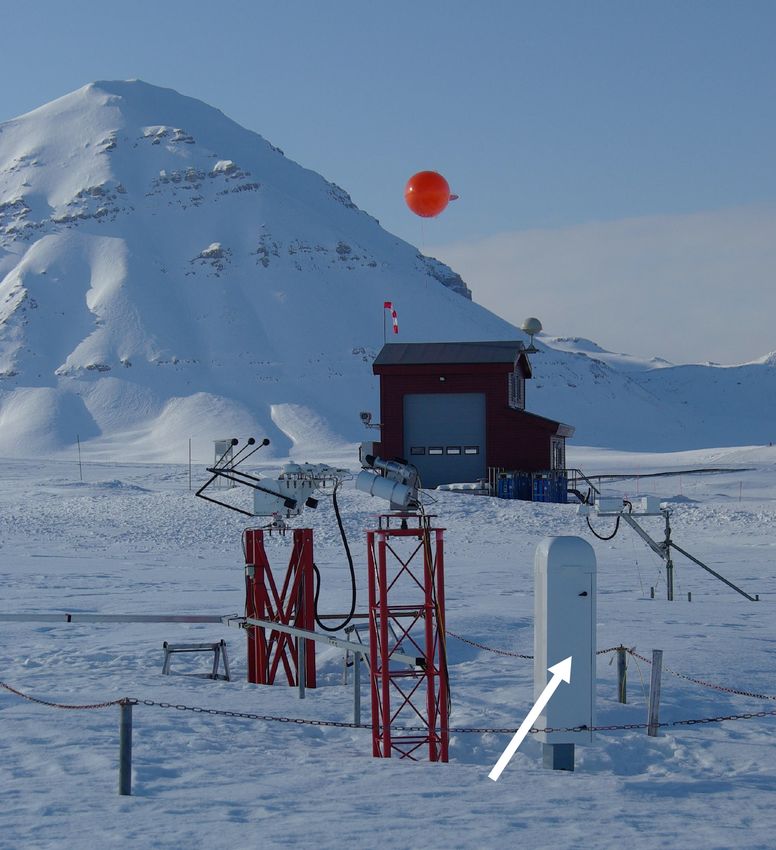
Figure 4. Annual cycle of the detected occurrence frequency of
clear-sky conditions (a) and cloudy conditions (b), given in per-
cent of the total monthly observation times. The average monthly
percentage is retrieved from monthly mean values excluding the in-
strumental overlap months July 1998 and August 2011 as well as
months with less than 75 % data coverage. The 25-year observa-
tion period is presented in the subsets August 1992 to June 1998 Figure 5. Median cloud base height (dots; left axis) for spring
(orange), August 1998 to June 2011 (blue), and September 2011 to months March–April–May, summer months June–July–August, au-
July 2017 (black) according to the different ceilometer types. tumn months September–October–November, and winter months
December–January–February, shown from the uppermost to low-
ermost panels, respectively. Only data with > 20 % available cloud
detection data during the season are considered, leading to gaps,
est occurrence of clear-sky conditions, and is consequently especially in winter. The background shading indicates the differ-
the most cloud-covered period of the year. This is in line ent instrumentation (light blue – LD-WHX, light red – LD-40, light
with other Arctic sites where the summer season is charac- yellow – CL-51). Additionally, the median long-wave net radiation
terized by persistent low cloud cover (Shupe et al., 2011). LWdown − LWup from simultaneous BSRN surface radiation mea-
surements is shown for the same cloudy periods (triangles; right
In Ny-Ålesund, this is also the season with surface tempera-
axis), respectively.
tures above freezing and a partly snow-free surface structure
(Maturilli et al., 2013). As the largest agreement between all
subsets is in July and August, it is likely that the majority of
clouds in these months will occur as a low cloud deck in the as three incoherent data sets, each of them generally too short
lower part of the atmosphere. to retrieve significant trend information. Overall, no signifi-
Regarding a potential change in the cloud base height over cant changes in CBH are detected over these years. How-
the 25-year period, Fig. 5 shows the observed seasonal me- ever, the presented ceilometer cloud base height data set is
dian cloud base height, together with the long-wave net radi- a valuable long-term source for studies relating atmospheric
ation LWnet from the BSRN surface radiation measurements temperature and humidity data as well as surface radiation
for simultaneous times. The periods of different ceilometer measurements with generic cloud information.
instrumentation are indicated, and a shift in CBH from the
first to the second instrument becomes apparent in all sea-
sons. The period after July 1998 does not exhibit any obvi- 5 Data availability
ous jumps related to the change in instrumentation. As there
is no absolute reference, we consider the CBH in the pre- The described ceilometer data for August 1992 to July 2017
sented ceilometer data set a best estimate for each respective are available at https://doi.pangaea.de/10.1594/PANGAEA.
sub-period. Constraints though are given for the calculation 880300 (Maturilli and Herber, 2017). As the measurements
of long-term trends: in this respect, the data should be treated are continuing, additional data after July 2017 can be found
www.earth-syst-sci-data.net/10/1451/2018/ Earth Syst. Sci. Data, 10, 1451–1456, 20181456 M. Maturilli and K. Ebell: Twenty-five years of cloud base height measurements
with the search term “Expanded measurements from station Multidecadal Oscillation, Geophys. Res. Lett., 36, L14801,
Ny-Ålesund” at the PANGAEA repository. https://doi.org/10.1029/2009GL038777, 2009.
Curry, J. A., Rossow, W. B., Randall, D., and Schramm,
J. L.: Overview of Arctic cloud and radiation characteris-
6 Summary tics, J. Climate, 9, 1731–1764, https://doi.org/10.1175/1520-
0442(1996)0092.0.CO;2, 1996.
With 25 years of observations of cloud base height by Karlsson, J. and Svensson, G.: The simulation of Arctic clouds and
ceilometer in Ny-Ålesund, Svalbard, we present a long-term their influence on the winter surface temperature in present-day
data set that contributes to the understanding of cloud pro- climate in the CMIP3 multi-model dataset, Clim. Dynam., 36,
cesses in an Arctic environment. Due to the inhomogeneity 623–635, https://doi.org/10.1007/s00382-010-0758-6, 2011.
caused by different instrumentation over the years, it is im- Küchler, N., Kneifel, S., Löhnert, U., Kollias, P., Czekala, H., and
Rose, T.: A W-Band Radar–Radiometer System for Accurate and
possible to retrieve any trend that can be unambiguously at-
Continuous Monitoring of Clouds and Precipitation, J. Atmos.
tributed to changes in the atmosphere. We therefore strongly Ocean. Tech., 34, 2375–2392, https://doi.org/10.1175/JTECH-
recommend avoiding any trend analysis based on the pre- D-17-0019.1, 2017.
sented data set. Nevertheless, the ceilometer data provide a Maturilli, M. and Herber, A.: Ceilometer cloud base
useful contribution to synoptic and cloud studies on shorter height from station Ny-Ålesund from August 1992 to
timescales. In this context, we presented examples on the July 2017, reference list of 290 datasets, PANGAEA,
passage of a frontal system as well as the combination of https://doi.org/10.1594/PANGAEA.880300, 2017.
cloud base height observations with surface radiation mea- Maturilli, M., Herber, A., and König-Langlo, G.: Climatology and
surements. Furthermore, the ceilometer data provide neces- time series of surface meteorology in Ny-Ålesund, Svalbard,
sary auxiliary information for the retrieval of cloud parame- Earth Syst. Sci. Data, 5, 155–163, https://doi.org/10.5194/essd-
ters from the cloud radar. 5-155-2013, 2013.
Maturilli, M., Herber, A., and König-Langlo, G.: Surface radiation
climatology for Ny-Ålesund, Svalbard (78.9◦ N), basic observa-
tions for trend detection, Theor. Appl. Climatol., 120, 331–339,
Author contributions. MM has compiled the data set and written
https://doi.org/10.1007/s00704-014-1173-4, 2015.
the manuscript. KE contributed with the cloud radar example and
Park, D.-S. R., Sukyoung, L., and Feldstein, S. B.: Attribu-
respective discussion.
tion of the Recent Winter Sea Ice Decline over the At-
lantic Sector of the Arctic Ocean, J. Climate, 28, 4027–4033,
https://doi.org/10.1175/JCLI-D-15-0042.1, 2015.
Competing interests. The authors declare that they have no con- Pithan, F. and Mauritsen, T.: Arctic amplification dominated by
flict of interest. temperature feedbacks in contemporary climate models, Nat.
Geosci., 7, 181–184, https://doi.org/10.1038/NGEO2071, 2014.
Shupe, M. D., Daniel, J. S., de Boer, G., Eloranta, E. W., Kol-
Acknowledgements. The authors gratefully acknowledge the lias, P., Long, C. N., Luke, E. P., Turner, D. D., and Verlinde,
support from the Transregional Collaborative Research Center J.: A focus on mixed-phase clouds: The status of ground-based
(TR 172) “ArctiC Amplification: Climate Relevant Atmospheric observational methods, B. Am. Meteorol. Soc., 89, 1549–1562,
and SurfaCe Processes, and Feedback Mechanisms (AC)3”, https://doi.org/10.1175/2008BAMS2378.1, 2008.
which is funded by the German Research Foundation (Deutsche Shupe, M. D., Walden, V. P., Eloranta, E., Uttal, T., Campbell,
Forschungsgemeinschaft; DFG). We thank Amelie Driemel for J. R., Starkweather, S. M., and Shiobara, M.: Clouds at Arc-
assisting with the PANGAEA data portal. tic atmospheric observatories – Part I: Occurrence and macro-
physical properties, J. Appl. Meteorol. Clim., 50, 626–644,
Edited by: David Carlson https://doi.org/10.1175/2010JAMC2467.1, 2011.
Reviewed by: three anonymous referees Stramler, K., Del Genio, A. D., and Rossow, W. B.: Synopti-
cally driven Arctic winter states, J. Climate, 24, 1747–1762,
https://doi.org/10.1175/2010JCLI3817.1, 2011.
Wendisch, M., Brückner, M., Burrows, J. P., Crewell, S., Dethloff,
References K., Ebell, K., Lüpkes, C., Macke, A., Notholt, J., Quaas, J.,
Rinke, A., and Tegen, I.: Understanding causes and effects of
Bennartz, R., Shupe, M. D., Turner, D. D., Walden, V. P., Steffen, rapid warming in the Arctic, EOS Project Update, EOS, 98,
K., Cox, C. J., Kulie, M. S., Miller, N. B., and Pettersen, C.: July https://doi.org/10.1029/2017EO064803, 2017.
2012 Greenland melt extent enhanced by low-level liquid clouds,
Nature, 496, 83–86, https://doi.org/10.1038/nature12002, 2013.
Chernokulsky, A. and Mokhov, I. I.: Climatology of To-
tal Cloudiness in the Arctic: An Intercomparison of Ob-
servations and Reanalyses, Adv. Meteorol., 2012, 542093,
https://doi.org/10.1155/2012/542093, 2012.
Chylek, P., Folland, C., Lesins, G., Dubey, M., and Wang, M.:
Arctic air temperature change amplification and the Atlantic
Earth Syst. Sci. Data, 10, 1451–1456, 2018 www.earth-syst-sci-data.net/10/1451/2018/You can also read