Quality Market: Design and Field Study of Prediction Market for Software Quality Control
←
→
Page content transcription
If your browser does not render page correctly, please read the page content below
Proceedings of the 44th Hawaii International Conference on System Sciences - 2011

  Quality Market: Design and Field Study of Prediction Market for Software
                              Quality Control

                     Abstract                                         the software industry and the critical consequences of
    Given the increasing competition in the software                  software errors, it has become important for
industry and the critical consequences of software                    companies to achieve high levels of software quality.
errors, it has become important for companies to                      Project managers will benefit greatly if forecast on
achieve high levels of software quality. Generating                   confidence in software quality is available early in
early forecasts of potential quality problems can have                development cycle.
significant benefits to quality improvement.
    In our research, we utilized a novel approach,                        There are various ways to define software quality
called prediction markets, for generating early                       and since quality is a multi-faceted concept, it is best
forecasts of confidence in software quality for an                    understood from a well-defined perspective. For the
ongoing project in a firm. Analogous to financial                     purpose of this research, we take a holistic view of
market, in a quality market, a security was defined                   software product quality as one that combines the
that represented the quality requirement to be                        views of the users, quality assurance members,
predicted. Participants traded on the security to                     quality managers along with the developers and the
provide their predictions. The market equilibrium                     management team. Being able to measure quality
price represented the probability of occurrence of the                early and as needed enables the use of early forecast
quality being measured. The results suggest that                      to take corrective actions. Thus, a software quality
forecasts generated using the prediction markets are                  estimation mechanism should i) provide estimation
closer to the actual project outcomes than polls. We                  early in development cycle, and ii) take into account
suggest that a suitably designed prediction market                    quality input from multiple stakeholders.
may have a useful role in software development
domain.                                                                  One such mechanism is called a prediction market
                                                                      (PM, henceforth). A prediction market is analogous
                                                                      to a stock market (specifically, futures markets).
1. Introduction                                                       Theory and empirical evidence suggest that
                                                                      prediction markets work very well in aggregating
    Among many practical challenges in software                       opinions from diverse stakeholders across many
engineering is the estimation task – the estimation of                domains. Prediction markets are also easy to set up
cost, timeline, delivery date, and software quality or                and administer.
assurance. According to National Information
Assurance Glossary, Software Assurance is defined                         The purpose of this research is to evaluate
as “the level of confidence that software is free from                whether a prediction market for software quality can
vulnerabilities, either intentionally designed into the               be used to forecast quality problems early in the
software or accidentally inserted at anytime during its               project.
lifecycle”. To that end, software assurance
encompasses the development and implementation of                     2. Background and Research Questions
methods and processes for ensuring that software
functions as intended while mitigating the risks of                   2.1 Software Quality
vulnerabilities, malicious code or defects that could
bring harm to the end user. One such process is the                       The IEEE standard (1061-1992) for software
testing and verification process. This process verifies               quality metrics methodology recommends that a
and validates coding during each stage of the de-                     software implementation project should develop a
velopment process. It ensures that the concept is                     methodology for establishing quality requirements
complete and that all requirements are well-                          and a process for validating the quality metrics. One
implemented and function as intended. While cost                      such process described in the standard is called
reduction and timeliness of projects continue to be                   Predictive Metric, which provides advice on
important measures, software companies are placing                    identifying a metric to be used during the
increasing attention on identifying the user needs and                development phase to predict the eventual values of a
better defining software quality from a customer                      software quality factor.
perspective [14]. Given the increasing competition in

                                              1530-1605/11 $26.00 © 2011 IEEE                                                    1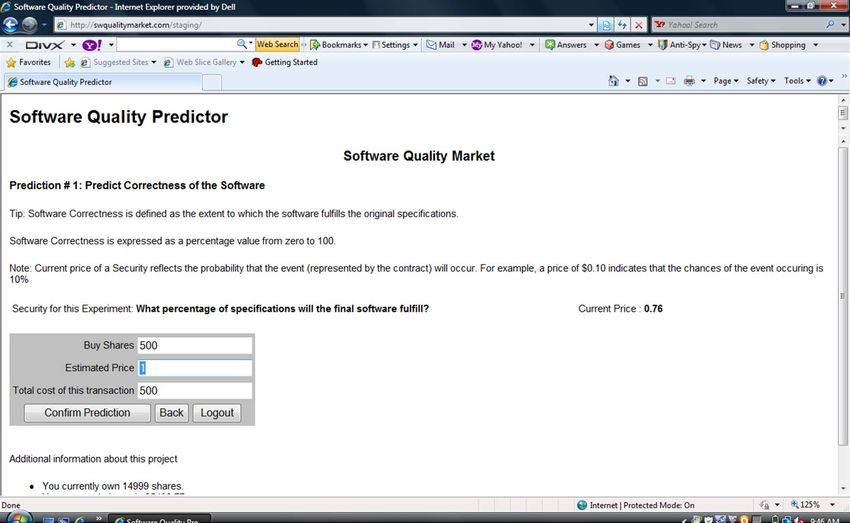
Proceedings of the 44th Hawaii International Conference on System Sciences - 2011

    In a traditional software estimation process, the                 parameters of interest defined by the market designer.
managers along with the developers arrive at the                      For example, a contract can be defined on the number
estimation figures. The estimation process does not                   of defects likely to be observed at a particular stage
include individuals from business domain, testers or                  in the software development process. A simple
project sponsors. Research in group dynamics has                      contract could specify the price for the contract when
demonstrated that, in general, the consensus of a                     the number of defects is less than an integer K is p.
group is better than any one individual’s judgment                    Traders have some private information about the
(popularized as "wisdom of crowds" by Surowiecki)                     defect rate and can observe the current market price
[15].                                                                 p. If a trader believes that the contract is underpriced
                                                                      (i.e., there would be fewer defects than p would
2.2 Prediction Markets                                                indicate), then she can purchase the contract so as to
                                                                      maximize her returns. Likewise, a trader will sell a
    A prediction market (PM) is similar to a stock                    contract if she believes it is overpriced. The process
exchange and well-designed prediction markets for                     of buying and selling thus, reveals information held
forecasting purposes have been developed for a                        by traders. When the price reaches an equilibrium
variety of situations. The Iowa electronic markets,                   level, the no trader has an incentive to buy or sell,
conducted by University of Iowa, are used to predict                  given her private information and the market is
political outcomes are among the best known of                        closed. The equilibrium price, thus, reflects aggregate
prediction markets in operation. Apart from political                 information available among the traders.
markets, Prediction markets have been used to
forecast movie revenues, corporate sales, project                     2.4 Research Questions
completion, and economic indicators [17].
                                                                          In this research, we use a suitably designed
    Considerable theoretical and empirical support                    prediction market for forecasting a particular attribute
exists for the superior performance of well-designed                  of software - called software correctness. For
markets to forecast future outcomes. Wolfers and                      comparative purposes, we evaluate the forecasts
Zitzewitz [17, 18] analyzed the extent to which                       generated by a PM against those generated by a
prediction markets can be used to aggregate disperse                  simple poll and the actual outcomes available at
information into efficient forecasts of uncertain                     project completion.
future events. Drawing together data from a range of
prediction contexts, they show that market-generated                      This research used a field study approach and
forecasts are typically fairly accurate, and that they                stakeholders in a live project serve as participants.
outperform      most     moderately       sophisticated               The purpose of the study was to explore the
benchmarks.                                                           effectiveness of prediction markets in forecasting
                                                                      software quality factors. The two research questions
2.3 Prediction Markets              for     forecasting               addressed in this research are:
software quality
                                                                           1.   How well does a prediction market forecast
     Prediction markets can be used to forecast many                            software correctness compared to opinion
aspects of the software project - in this research, we                          polls?
focus on quality. A prediction market, because it is                       2.   How well does a prediction market forecast
easy to set up and conduct, can be used at any stage                            software correctness compared to actual
of the software development project. Second, it is                              measures of software correctness?
rather straight forward to include different
stakeholders in the market. Since PM's are known                      3. Market Design
(theoretically as well as empirically) to aggregate
information from multiple decision makers                             3.1 Experiment
efficiently, a PM can yield a much better forecast
than similar methods. Further, since trading in a
                                                                          The experiment was conducted in a major Wall
prediction market can be made anonymous, it
                                                                      Street financial institution in Northeast America.
encourages employees to share unwelcome
                                                                      With the consultation of the project management
information about a project’s launch date or
                                                                      team, an on-going software development project was
performance without fears.
                                                                      chosen for this study. The project was a small size
                                                                      project to support securities trading at the firm.
    In a prediction market, various stakeholders
                                                                      Members of the project, including one sponsor, one
(called traders) buy or sell contracts on some

                                                                                                                                 2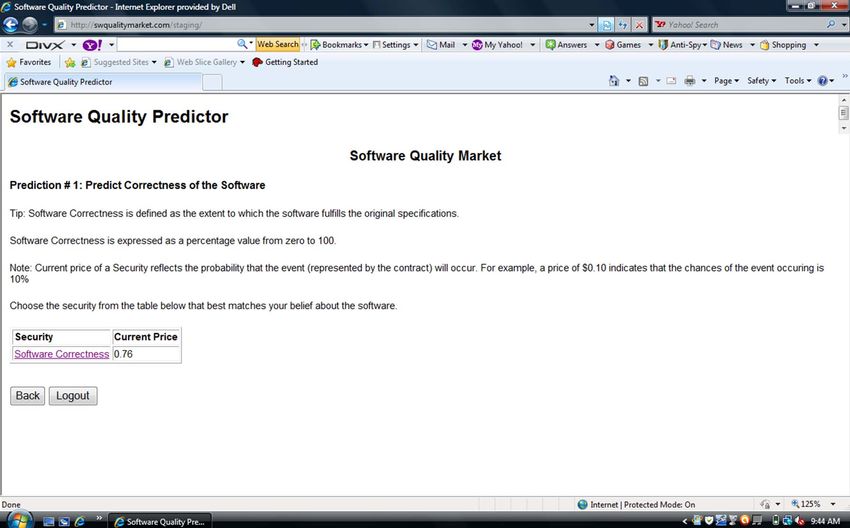
Proceedings of the 44th Hawaii International Conference on System Sciences - 2011
project manager, one technical manager, three
developers, one tester, two users and a development Three different incentive structures were
team lead participated in the study. An online virtual considered for this study:
stock market was developed for this experiment and
1. a constant amount to be paid to all participants
made available for participants to trade. The market
2. participants’ reward can be linearly dependent on
was hosted on a public domain and was made
the final net worth and all participants will be
available 24x7. In this experiment the participants
paid at the end of the experiment, or
played the role of traders buying and selling shares of
3. the top winner can get $300, the 2nd top winner
the contract with virtual currency (or play money).
$200 and the 3rd winner can get $100;
The shares themselves carried no value as they were
traded with fictitious money. Since they had no value
Since these options involve real money reward,
of their own, they were used to induce values through
there might be legal and technical difficulties
an appropriate reward mechanism [13].
involved in actually implementing the incentive
structure. Thus, we asked the subjects to trade so as
3.2 Contract to maximize their final net worth in play money.
Subjects with the highest net worth in play money at
In this experiment the event in question that the end of the market session will be awarded an
needed to be forecasted was the software correctness. extra vacation day by the manager and others would
Software correctness is defined as the extent to which not get any incentive.
software satisfies its specifications and fulfills the
users’ tolerance limits. The contract in this case,
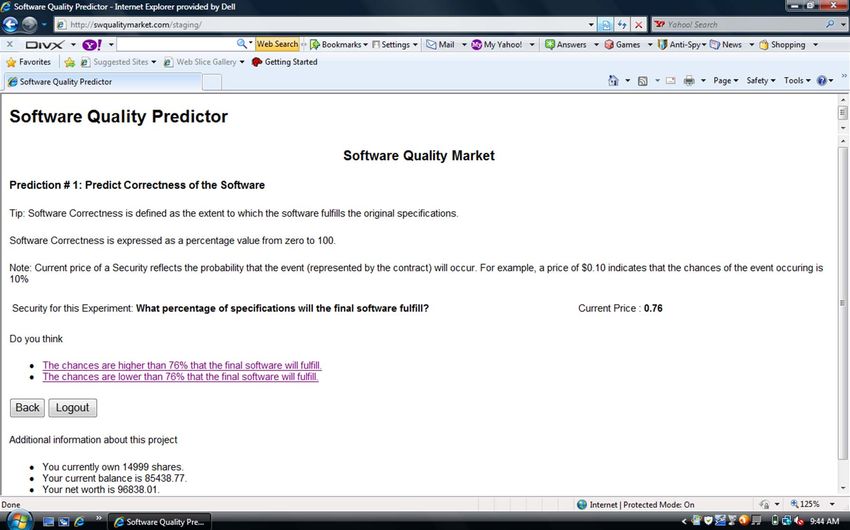
called SC_contract, was defined as below: 3.5 Instructions to Subjects
SC_Contract: What percentage of specifications will The following instructions were provided to the
the final software fulfill? subjects prior to the experiment.
i. The participants should not share their userid
3.3 Trading Platform and password with other participants, nor
participant in trade with others subject's login
Participants used a web-based prediction market id's.
to trade contracts representing the two outcomes. A ii. It was suggested that all requirements of the
subsidizing market-maker based on a Hanson’s software project be considered to be of equal
logarithmic scoring rule was used to ensure liquidity weight. No special weights are given based
despite the small number of traders and two outcome
on priority/complexity of the requirement.
space [4]. After an initial instruction period on a
practice market, each participant received login iii. If a requirement is partially implemented or
details for a trading account that was funded with fully not functional, then the requirement is
100,000 play money units. The initial price of the considered not implemented for the
contract was set at 0.80. The market was open 24x7 percentage calculation.
during each stage. Initial test run was conducted at
the project site for a week for learning and any We believe that subjects did adhere to the
improvements to the market design. instructions during the market sessions and outside.
3.4 Participant Incentives 3.6. Experimental Sessions
Incentives are usually a matter of serious debate Subjects judged the probability of meeting
among experimental researchers. In experimental requirements using the prediction market (PM). A
economics literature, Smith [13] suggests that using second method of indicating the response was by
monetary rewards increases the salience of the task supplying a probability number at the end of a trading
and shows that inexperienced subjects converge session and is termed as a Poll. Under the Poll
toward “rational” behavior more rapidly as the size of treatment, subjects do not have an opportunity to
rewards are increase. In general, psychologists do not revise their estimates - thus, data obtained through
emphasize incentives as much as economists do. In polls can be considered "naive" judgments while data
the context of online prediction markets, Wolfers obtained from the PM can be considered informed
et.al. [19] find that usage of play versus real money judgments. Finally, data on actual progress of the
did not make a difference to the forecast quality. project was collected and this serves as the actual or
3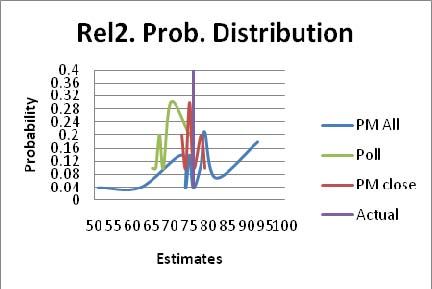
Proceedings of the 44th Hawaii International Conference on System Sciences - 2011

objective data that PM and Poll were trying to                           The following table provides a preliminary
forecast.                                                             summary of the results.

    Data were collected at three different stages in a                Table 2. Preliminary Summary of Results
live, ongoing software project at a client's location                   PM Stages        Closing    Mean of Project
during the prediction market sessions. The three                                         Bid for Poll              Actual
separate stages are: Requirements, Release1, and                                         PM         Forecasts*
Release2 (Final Implementation).                                        Requirements 0.97           0.91           0.76
                                                                        Release1         0.78       0.67           0.76
    Ten subjects participated in both the PM and the                    Release2         0.75       0.69           0.76
Poll treatments. In the case of Poll treatment, each                  *Mean of poll estimates from 10 participants
subject provided a probability at the end of the stage
thus yielding 10 observations for analysis. In the case                   Data in Table 2 suggests that, while the
of the PM treatment, a subject could provide multiple                 requirements stage data for the closing bid for the PM
estimates until the market for that stage was closed.                 is quite different from actual error rate, Release1 and
Thus, the number of predictions or observations can                   Release2 data is rather close. The data from poll
be larger than 10 even though the number of subjects                  means is quite far apart from actual project data and
is still ten. The Table 1 below summarizes the                        is a less accurate predictor of the actual data
experiment.                                                           compared to the PM for Release1 and Release2
                                                                      stages. While it is tempting to conduct statistical
Table 1.Experiment Design                                             significance tests using Poll data, given the numerous
                    Treatments                                        issues with the sample size and distribution, we do
    Stages      Prediction                  Poll                      not report the results of a test. Detailed analysis is
                Market                                                presented below.
 Requirements Number           of       Number        of
                subjects = 10,          subjects=                     4.2 Data Characteristics
                Number         of       Number        of
                predictions = 20        predictions = 10                   Data collected through this experiment has
 Release 1      Number         of       Number        of              several characteristics which are common to field
                subjects = 10,          subjects=                     experiments run with a live software project. First,
                Number         of       Number        of              the number of subjects who participated in the
                predictions = 39        predictions = 10              software project is small - ten to be exact. Second,
 Release 2      Number         of       Number        of              the same subjects provide PM and Poll treatments
                subjects = 10,          subjects=                     (i.e., within subject design) first by participating in
                Number         of       Number        of              PM and then providing Poll data             (i.e., without
                predictions = 29        predictions = 10              counterbalancing). Third, subjects in PM treatment
                                                                      provide multiple revised estimates which are likely to
4. Analysis                                                           be correlated. Fourth, the distribution of estimates
                                                                      among subjects is not unimodal (discussed below).
                                                                      Thus, it is unlikely that any statistical test would have
4.1 Preliminary Analysis
                                                                      sufficient power if used for testing statistical
                                                                      significance.
    Two specific hypotheses, derived from the
research questions are stated below. The first
                                                                          Thus, in the following analysis, we report the
hypothesis compares the forecasts between the PM
                                                                      complete distribution of the data obtained from the
and Poll treatments and is stated as follows:
                                                                      experiment. This makes sense to us given the
    H1: The PM forecast is not significantly different
                                                                      relatively low power of any test with such sample
from Poll forecast.
                                                                      sizes.
    A stronger test is the comparison between PM
forecasts and the actual, objective project outcomes.                 4.3 Further Analysis for H1
The hypothesis can be stated as:
                                                                         For the PM case, ten subjects provided a total of
   H2: The PM forecast is not significantly different                 twenty bids or predictions.       The number of
from the actual project outcome.                                      predictions exceeds the number of subjects because
                                                                      each subject is allowed to bid as many times as

                                                                                                                                   4
Proceedings of the 44th Hawaii International Conference on System Sciences - 2011
needed until the end of the PM session. All subjects insufficient information about the software project at
were made aware of the ending time of the PM this time for making informative judgments as well
session. as to revise beliefs.
4.3.1 Requirements Stage analysis for H1: 4.3.2 Release 1 stage analysis for H1
Data collected at the end of requirements stage for After the requirements stage, the software team
poll and PM treatments was subjected to a non worked on the project for three weeks and released an
parametric test (Mann-Whitney). The PM treatment early version of the product. We call this Release 1
has N=20 predictions (each subject, on average, and discuss data collected after this stage through the
revised his estimate once) and the PM treatment has a PM and Poll. The subjects knew about what the
mean of 90.85 and a standard deviation of 4.36. features are being released via a central repository
Immediately after the PM was closed, subjects database maintained at the firm.
participated in a poll (ten predictions, one per
subject) which has a mean of 90.6, and a standard Subjects provided one estimate each for
deviation of 6.19. A Mann-Whitney test, based on probability judgment of contract completion and the
median ranks, yields a one-sided (PM > poll) p-value Poll line shows the distribution. The same subjects
= 0.482 and two-sided (PM poll) = 0.965. Thus, it revised their estimates multiple times in the PM
is concluded that there is no significant difference session (39 estimates of probability judgment by 10
between PM and Poll data. Thus, the null hypothesis subjects) and the data from all 39 judgments is
of no difference between PM and Poll is supported. presented as PMAll. The last prediction from each
subject, prior to market close is presented as PMclose
More insight is obtained by viewing the data (thus, this line plots 10 observations). The data is
distribution presented in Fig. 1 below. The x-axis presented in Fig.2 and we discuss the data
refers to the forecast and the y-axis to the frequency distribution intuitively rather than rely on a statistical
of the forecast (normalized by dividing with the test of questionable power.
number of bids, so that they can fit into the same
graph). In Fig.1, we represent the distribution of 1. The Poll data has a clear mode at about 65%
forecast data using requirements stage data. Two and is tightly dispersed at the mode.
versions of PM data are presented - PMAll denotes 2. The PMAll data contains all the data
all predictions made by subjects during the including revised beliefs.
experiment and thus reflects multiple revised 3. The PM Close distribution is nearly uniform
forecasts by subjects while PMClose denotes the last with support between [60%, 80%] and is
prediction (one for each subject) before the PM was significantly different from Poll data.
closed. Thus, while Poll and PMClose have 10
observations, PMAll can have more than 10 We interpret the data as suggesting that PM
observations. and Poll yield different forecasts at the Release 1
stage.
We can see that PMAll data has a bi-modal
distribution with one mode near 85% and another at 4.3.3 Release 2 stage analysis for H1
95% while the poll data seems have one clear mode The software was worked on further and a
at 85%. PM Close line shows the distribution of data, different and final version was released as Release 2.
one per each subject, prior to market closing - thus Fig. 3 contains the distribution of forecasts obtained
the mean of PM close is the equilibrium price. thru Poll and PM methods.
1. The Poll shows two modes with a prominent
Note that the Poll mode (at 85%) nearly coincides mode at 70.
with the PMAll mode (at 85%) - thus, it can be 2. The PMAll data, because it has numerous
argued that subjects started with an estimate of 85% modes, is nearly un-interpretable. The PMClose
chance that the contract of >80% specifications data is dispersed narrowly with support in [72%,
fulfilled. However, after participating in the PM and 80%] range with a prominent mode at 75%.
observing other people's bids, a majority seems to
have changed their judgments and the mode in PM A Mann-Whitney test for median differences
close suggests that most subjects believed that the between PMClose and Poll indicates a statistically
probability of meeting the contract is around 95%. significant difference. Visually scanning the two
distributions also suggests that PMClose distribution
We feel that since this data was collected at the is different from the Poll forecast distribution.
early requirements stage, there is probably
5Proceedings of the 44th Hawaii International Conference on System Sciences - 2011
Overall, we conclude that PMClose Release 2 Yes
forecasts are different from the forecasts generated
through a Poll at Release 2 stage.
4.4 Further Analysis for H2
Req. Prob. Distribution The PM and poll are two different ways of
0.3 forecasting probabilities. The key question, however,
0.27
0.24 is whether one or the other method is a good
Probability
0.21
0.18 predictor of eventual success rate for the software
0.15
0.12
PM
project. The following analysis focuses on the second
0.09
0.06
0.03
Poll
question which is repeated below:
0 PM Close
70 75 80 85 90 95 100
How well does a prediction market forecast software
Estimates
correctness compared to actual measures of software
correctness?
Fig1. Probability Distribution for H1 with Req.
data The actual error rate in the software project used
in the task was assessed by the project manager on
completion of the project (i.e., after Release 2 stage)
Rel1. Prob. Distributions to be 76%. This was arrived by manually counting
0.6
0.56 the number of specifications that were fully
0.52
0.48
0.44
functional. The number of original specifications for
0.4
implementation was 25 and after the Release2, the
Probability
0.36
0.32
PM All
0.28
0.24
0.2
project manager counted the user approved
Poll
0.16
0.12
0.08
specifications that were fully functional which turned
PM close
0.04
0 out to be 19 that makes the actual error rate to be
45 50 55 60 65 70 75 80 85 90 95 100 76%.
Estimates
The hypotheses can be stated as follows:
H2: At [requirements/release 1/ release 2] stage, the
Fig2.Probability Distribution for H1 with Rel1 forecast using [PM/poll] is the same as actual error
data rate of 76%.
H2a: The forecasts are different from true error rates.
Rel2. Prob. Distribution The data is summarized below in Figures 4-6.
0.4
Note that the data for PMAll, PMClose and Poll is
0.36
0.32
identical to those in the first set of graphs (Fig. 1-3).
0.28 The actual error rate is overlaid on the same graphs
Probability
0.24
0.2 PM All as a visual guide. Due to issues of small sample size,
0.16
0.12 Poll multimodality of distributions and correlation among
0.08
0.04 PM close forecasts, we chose not to use statistical tests for
0 significance. Instead, we interpret the data based on
50 55 60 65 70 75 80 85 90 95 100
the distributions and note that our conclusions may
Estimates not be statistically significant and other
interpretations are possible.
Fig3.Probability Distribution for H1 using Rel2
data
In summary, the results are:
Table 3: Forecasts from PM and Poll at stages
Stage Is PM different from poll?
Requirements No
Release 1 Yes
6Proceedings of the 44th Hawaii International Conference on System Sciences - 2011
1 are indistinguishable from true error rates while
Poll forecasts fall short.
Figure 6 contains the data for Release 2 stage. Poll
data has much of distribution to the left of the true
error rate and consistently underestimates it. The
forecasts obtained from subjects prior to market
close, or PMClose, have two modes on either side of
the true rate of data and narrower support of
[75,80%] around the true rate of 76%. Thus, Poll
forecasts seem different from actual while PMClose
data do not.
Fig 4. Probability distribution for H2 at Requirements
The results of our analysis are summarized in the
table below:
Table 4: Summary of Analysis
Stage Is the PM Is the poll
forecast forecast
different from different
Actual? from Actual?
Requirements Yes Yes
Release1 No Yes
Fig 5. Probability distribution for H2 at Release1
Release2 No Yes
5. Summary, Limitations and Future
Research
5.1 Summary
In this research, we use a prediction market to
generate aggregate forecasts of quality judgments for
a software project in progress. Ten stakeholders
Fig 6. Probability distribution for H2 at Release2 including business managers, project management
team, development team and end user community are
Figure 4 presents Poll data (mean forecast of 91%) used as subjects. The ten subjects provide their
and PMClose data (mean forecast of 92%) as well as forecasts at three different stages of the project - at
actual error rate (76%) for the requirements stage. requirements stage, at an early release stage and a
We judge the situation as one in which neither the final release stage. Subject judgments of an aspect of
Poll method nor the PM method as being good at quality (specification completeness) is assessed using
forecasting the true error rate. the PM and Poll (a "naive" bench mark) at the three
stages. On completion of the project, the true error
Figure 5 contains the data for Release 1 stage. The rate in the project is collected as well.
Poll has a unimodal distribution with the mode at
65% and all data fall within [60%, 75%]. Thus, Poll An analysis of data suggests that, as one
data at Release 1 stage does not seem to predict true progresses through the stages of software
error rates correctly and definitely underestimates it. development from requirements to later releases, the
The PMClose distribution is nearly uniform with differences in predictions from PM diverge from
support between [60%, 85%] with a mean around those in a Poll. Unlike in a Poll, in a PM subjects can
73%. We thus conclude that PM forecasts at Release use the market information available thru ongoing
7Proceedings of the 44th Hawaii International Conference on System Sciences - 2011
trades on the contract and thus adjust their software releases for next year (particularly during
predictions. holiday season). These predictions could help the
management in aligning the resources appropriately.
Comparison of PM and Poll forecasts with the
true outcomes suggests that forecasts generated by
subjects when using PM are closer to the true error 6. References
rates than forecasts generated thru Polls. Thus, this
study provides preliminary evidence to using the PM [1] Briand, L.C., Basili, V.R. and Hetmanski, C.”
method for predicting software forecasts. Developing interpretable models for optimized set
reduction for identifying high-risk software components,”
5.2. Limitations of the Study IEEE Transactions on Software Engineering, 1993, pp
1028–1034.
The application of PM to software project [2] Cavano, J., McCall, J. “A framework for the
milestones is new and conducting one using a live measurement of software quality”, Proceedings of the
project in the field (as opposed to the lab) placed software quality assurance workshop on Functional and
considerable constraints on our ability to control the performance issues 1978, pp 133-139.
environment. Since this is a novel application, we
had to settle for a small scale project. Ideally, a
[3] Grosser, D., Sahraoui, H.A. and Valtchev, P. “Analogy-
prediction market can be "designed" for each based software quality prediction.” Object-Oriented
forecasting task. In this study, we did not have the Software Engineering, 2003.
luxury of "designing" a mechanism.
[4] Hanson, R. and Oprea, R.” Manipulators Increase
This was the first time that the Wall Street Information Market Accuracy”, 2005, George Mason
Company employed a virtual market for software University.
estimation and the participants were especially [5] ISO/IEC 9001:2000. Quality management systems—
delighted about using the market. To some extent, Requirements, International Organization for
this mitigated the weaker incentive system (one Standardization.
vacation day to the winner in the trading) because we
felt that the subjects were quite motivated. [6] Juran J. and Gryna F. Quality Planning and Analysis,
2nd ed., McGraw-Hill, New-York., 1980.
5.3 Suggestions for Future Work
[7] Khosgoftaar, T.M and Munson, J.C. “Predicting
In this study, the forecasts of the PM are software development errors using software complexity
compared with a Poll and actual outcomes. Polls may metrics.”, IEEE Journal on Selected areas in
Communications, 1990.
be viewed as a "naive judgment aggregation"
mechanism and future research might use alternate
mechanisms other than Polls as a baseline in testing [8] Khosgoftaar, T.M., Lanning, D.L., and Pandya, A.S.” A
comparative study of pattern recognition techniques for
PM's.
quality evaluation of telecommunications software,”,
IEEE Journal on Selected areas in Communications, 1994,
As a future study, a suggested use of PM could be pp 279–291.
to consider the market concept as a means to estimate
the confidence in quality estimates. That is, as a [9] Li, P.L, Herbsleb, J., Shaw, M., and Robinson, B.
secondary perspective or validation rather than the “Experiences and results from initiating field defect
primary estimate. prediction and product test prioritization efforts at abb
inc.”, Proceedings of The 28th International Conference on
In this study, we used a specific attribute of Software Engineering, 2006.
quality called software correctness as the object of
forecast. Future research could also consider using [10] Nagappan, N., Williams, L., Vouk, M., and Osborne,
contracts on multiple attributes such as a joint J. “Early estimation of software quality using in-process
prediction task in which both correctness and say, testing metrics: a controlled case study,” Proceedings of the
usability are traded in a PM. PMs could also be used third workshop on Software quality, 2005, pp 1-7.
in other project management tasks such as predicting
[11] Paulk, M.C., Weber, C.V., Curtis, B., and Chrissis,
implementation date and project cost. In addition
M.B. The Capability Maturity Model: Guidelines for
PMs can be used in organizational management Improvement of the Software Process, Addison-Wesley.,
decisions such as software product sales, number of 1995.
8Proceedings of the 44th Hawaii International Conference on System Sciences - 2011
[12] Schneider, V. “Some experimental estimators for
developmental and delivered errors in software
development projects.:, ACM SIGMETRICS Performance
Evaluation Review, 1981, pp 169–172.
[13] Smith, V. “Monetary rewards and decision cost in
experimental economics.” In Vernon L. Smith, editor,
Bargaining and Market Behavior, 2000, pp. 41–60.
[14] Subramanyam, R., Krishnan, M.S.” Empirical
Analysis of CK Metrics for Object-Oriented Design
Complexity: Implications for Software Defects,” IEEE
Transactions on Software Engineering, 2003, pp 297 –
310.
[15] Surowiecki, J. The Wisdom of Crowds. Random
House, Inc., 2004.
[16] Vigder, M.R. and A.W. Kark. “Software Cost
Estimation and Control, National Research Council,”,
1994, Canada, Retrieved from
http://www2.umassd.edu/SWPI/NRCca/NRC37116.pdf.
[17] Wolfers, J and Zitzewitz, E. “Prediction Markets,”
Journal of Economic Perspectives, 2004, 18(2), 107-126.
[18] Wolfers, J and Zitzewitz, E.“Interpreting Prediction
Market Prices as Probabilities,” 2005,
http://bpp.wharton.upenn.edu/jwolfers/Papers/InterpretingP
redictionMarketPrices.pdf.
[19 ] Wolfers, J. , Servan-Schreiber , E., Pennock, D.
Galeback, B. Prediction Markets: Does Money Matter?
Electronic Markets, 1422-8890, Volume 14, Issue 3, 2004,
Pages 243 – 251.
Appendix I
Software Quality Predictor Sample Screens
9You can also read