RUDAR: WEATHER RADAR DATASET WITH VARIETY OF GEOGRAPHICAL AND CLIMATIC CONDITIONS
←
→
Page content transcription
If your browser does not render page correctly, please read the page content below
RuDar: Weather Radar Dataset with Variety of
                  Geographical and Climatic Conditions

                                                    Anonymous Author(s)
                                                        Affiliation
                                                         Address
                                                          email

                                                          Abstract

 1                Precipitation nowcasting, a short-term (up to six hours) rain prediction, is arguably
 2                one of the most demanding weather forecasting tasks. To achieve accurate pre-
 3                dictions, a forecasting model should consider miscellaneous meteorological and
 4                geographical data sources. Currently, available datasets provide information only
 5                about precipitation intensity, vertically integrated liquid (VIL), or maximum reflec-
 6                tivity on the vertical section. Such single-level or aggregated data lacks description
 7                of the reflectivity change in vertical dimension, simplifying or distorting the cor-
 8                responding models. To fill this gap, we introduce an additional dimension of the
 9                precipitation measurements in a RuDar dataset that incorporates 3D radar echo
10                observations. Measurements are collected from 30 weather radars located mostly
11                in the European part of Russia, covering multiple climate zones. Radars product
12                updates every 10 minutes with a 2 km spatial resolution. The measurements include
13                precipitation intensity (mm/hr) on the 600 m altitude, reflectivity (dBZ) and radial
14                velocity (m/s) on 10 altitude levels from 1 km to 10 km with 1 km step. We
15                also add the topography information as it affects the intensity and distribution of
16                precipitation. The dataset includes over 100K timestamps over a two-year period
17                from March 2019 to March 2021, totaling in more than 500 GB of data. We
18                evaluate several baselines, including optical flow and neural network models, for
19                precipitation nowcasting on the proposed data. We believe that RuDar dataset
20                will become a reliable benchmark for precipitation nowcasting models and also
21                will be used in other machine learning tasks, e.g., in data shift studying, anomaly
22                detection, or uncertainty estimation. Both dataset and code for data processing,
23                model preparation and training are publicly available 1 .

24   1       Introduction
25   Precipitation nowcasting is the task of forecasting a rainfall situation (precipitation location and
26   strength) for a short period of time (usually up to six hours). Due to climate change the frequency
27   and magnitude of extreme weather events, e.g. sudden downpours, increase, and the techniques for
28   forecasting such events are needed. Precipitation nowcasting can provide information about such
29   events with a high spatiotemporal resolution. Such kind of weather forecasting plays an essential role
30   in resource planning in the agricultural industry, aviation, sailing, etc. as well as daily life.
31   Incorrect precipitation forecasting could have a negative impact on human life activity, and data
32   with diverse meteorological and geographical characteristics are needed for improving precipitation
33   nowcasting models. The different benchmark datasets usage could improve the quality of precipitation
34   nowcasting models to minimize the risk of forecasting error.
         1
             The link will be available shortly after review

     Submitted to 35th Conference on Neural Information Processing Systems (NeurIPS 2021). Do not distribute.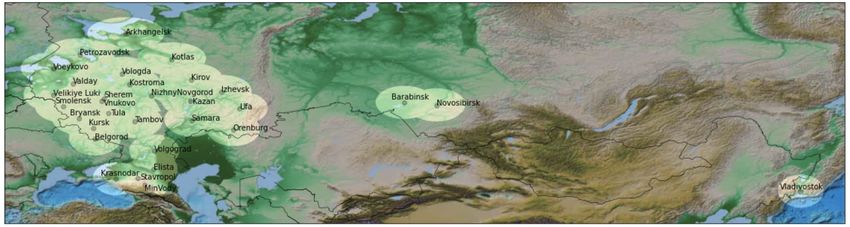
Figure 1: The geographical area covered by the proposed weather radar dataset for a precipitation
     nowcasting task (light areas). The dataset covers varied climatic conditions and topographical features.
     Best viewed in color.

     Table 1: Comparative table of various international open sources of radar data. The data were
     compared by spatial, temporal and pixel resolution, as well as by time periods, geographical coverage
     and the number of radars involved. The main products contained in the datasets are base and
     composite reflectivity, as well as derived products: precipitation, maximum reflectivity and vertically
     integrated liquid (VIL). If there is more than one radar, all except NEXRAD and RuDar combine
     measurements from different radars into one frame.
      Dataset         Time                Spatial resolution   Temporal           Pixel resolution   Geography        No.
                      periods             (km per pixel)       resolution (min)   per frame                           of radars
      NEXRAD [3]      1994–               1                    5                  460×460            United States    160
      Radarnet [8]    1970–               1                    5                  1536×1280          United Kingdom   15
      HKO-7 [2]       2009–2015           1.06                 6                  480×480            Hong-Kong        1
      KNMI [9]        2008–2018           1                    5                  400×400            Netherlands      2
      TAASRAD19 [5]   2010–2019           0.5                  5                  480×480            Italian Alps     1
      SEVIR [6]       2017–2019           1                    5                  384×384            United States    160
      RADOLAN [4]     Dec 2014-Nov 2017   1                    5                  900×900            Germany          18
      RuDar (Ours)    2019–2021           2                    10                 252×252            Russia           30

35   Previously published benchmarks [1, 2, 3, 4, 5, 6] provide data collected with one or several weather
36   radars. Some of those datasets only contain information about precipitation intensity, others provide
37   vertically integrated liquid value (VIL) or maximum reflectivity on the vertical section.
38   For extreme weather events forecasting a single measurement type is often not enough. For that reason,
39   we propose a RuDar dataset that contains several measurement products: reflectivity (dBZ) and
40   radial velocity (m/s) on ten altitude levels from 1 km to 10 km with 1 km step and intensity (mm/hr)
41   on a 600 m altitude level. Each measurement was carried out with a 2 km spatial resolution and
42   a 10 minute temporal resolution. The dataset is collected by 30 weather radars, maintained by the
43   Central Aerological Observatory of Russia. For each radar, we additionally provide information
44   about the surrounding topography [7]. The radars are located mostly in the European part of Russia
45   as shown in Figure 1, therefore, a wide range of geographical and climatic conditions is considered.
46   The proposed dataset includes more than 100 000 timestamps over a two year period from 2019 to
47   2021, allowing to investigate the effect of seasonality on rainfall forecast.
48   The main paper contributions are:

49         1. The published weather radar dataset with different geographical and climatic conditions;

50         2. Studies of the main characteristics of the proposed dataset;

51         3. Evaluations of common precipitation nowcasting models;

52         4. Accompanying source code for data processing and experiments.

53   The structure of the paper is as follows: Section 2 covers previously published datasets for a
54   precipitation nowcasting task, Section 3 describes the proposed dataset , Section 4 introduces the
55   nowcasting benchmark, and Section 5 concludes the paper.

                                                                2
56 2 Related work
57 Doppler weather radar is the most effective tool for detecting precipitation. The radar measures
58 reflectivity of radio waves from precipitation drops, which can then be converted into precipitation
59 intensity using Z-R relation [10]. Reflectivity is usually measured at several different heights, then
60 the measurement data can either be aggregated somehow or given as is. The main ways of obtaining
61 one total measurement from measurements at several levels is either taking measurements from only
62 the lower level, or aggregating these measurements by the maximum value. The first product is
63 called base reflectivity, the second is composite reflectivity. In addition, a Doppler radar can detect
64 movement towards or away from itself, which allows measuring the speed of precipitation movement
65 along or against the direction of the radar. The latter type of measurement is called radial velocity.
66 In the public domain, one can find quite a variety of weather radar datasets collected and maintained
67 by international agencies. We summarized the information about some of them in Table 1, where we
68 provided a comparison by spatial, temporal and pixel resolution, time periods, geographic coverage
69 and number of radars from which measurements were taken.
70 The first two data sources in Table 1 are more large databases than ready-made ML benchmarks:
71 • NEXRAD [3] by US National Oceanic and Atmospheric Service (NOAA), which has been
72 collected since 1994 and contains reflectivity data, radial velocity, and derivative products.
73 • Radarnet [8] by UK Met Office, which has been collected since 1970 and contains compos-
74 ite precipitation data derived from reflectivity data.
75 The ready-to-go datasets, suitable for exploration by ML practitioners and researchers include:
76 • HKO-7 [2] by Hong Kong Observatory (HKO) contains a single-height reflectivity level
77 from a single radar at the center of Hong Kong for a six years period.
78 • KNMI [9] by the Royal Netherlands Meteorological Institute (KNMI) contains ten-year
79 single-height composite reflectivity data from two radars.
80 • TAASRAD19 [5] by Meteotrentino contains nine-year aggregated reflectivity data from a
81 single radar located in the Italian Alps. It is interesting due to geographical specifics and
82 large amount of extreme phenomena, such as snowstorms, hails, downpours, etc.
83 • SEVIR [6] by NOAA and the Geostationary Environmental Satellite System (GOES)
84 contains US radar and satellite data for a two year-period, sampled either randomly or on
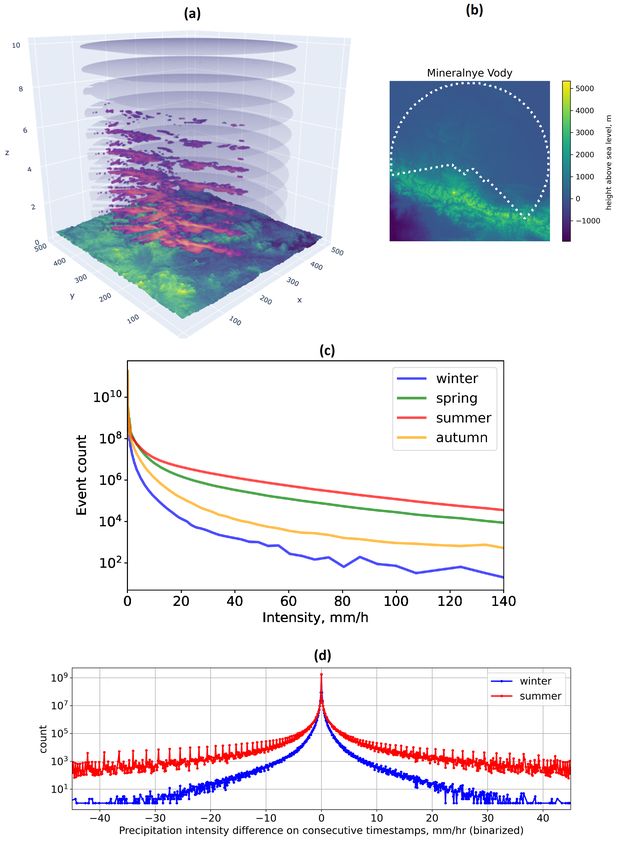
85 event basis. It is focused on detection of storm events.
86 • RADOLAN [4] by the German Weather Service contains three-year reflectivity and precipi-
87 tation data collected by 18 radars in Germany.
88 Our dataset was collected by 30 radars of the Central Aerological Observatory (CAO) and contains
89 two years of observations (2019 – 2021). Measurements were carried out mainly in the European
90 part of Russia, but some areas of the Siberian and Far Eastern regions were also captured.
91 The main advantages of our dataset relative to the above are as follows:
92 1. A large area is covered with different climatic conditions – from the extreme north
93 (Arkhangelsk) to the southern regions (Krasnodar).
94 2. The data are continuous measurements over two years, which allows taking into account the
95 influence of seasonal dependence on strength and distribution of precipitation.
96 3. The data presents several radar products at once: reflectivity and radial velocity at 10
97 altitudes (1 – 10 km) and precipitation (600 m). We do not specifically aggregate the
98 reflectivity and radial velocity data, as we believe that it can be useful for forecasting to
99 know how precipitation and its velocity are distributed depending on the height. There are
100 situations when precipitation has not yet appeared at low levels, but at the same time, at high
101 levels, there is information about future precipitation (see an example in Figure 3).
102 4. In addition to the radar data itself, we provide information about the topography in the area
103 around each radar. These data allow one to investigate the influence of the surrounding
104 topography in predicting precipitation.
3105 3 Dataset Description and Processing
106 The proposed RuDar dataset contains measurements from 30 weather radars mainly located in the
107 European part of Russia (Figure 1). Radars product updates every 10 minutes with a 2 km spatial
108 resolution on the area with 250 km radius. The dataset covers two years from 2019 to 2021 and has
109 over 100 000 unique timestamps.
110 Each data sample is a three-dimensional tensor that contains the result of a ten-minute scan of the
111 atmosphere with a single radar. Tensors have 21 channels with a spatial resolution of 252 × 252 pixels.
112 The first channel contains information about precipitation intensity (mm/hr) on the 600 m altitude
113 level. Precipitation rate is calculated from reflectivity values (dBZ) with Marshal-Palmer type of
114 Z-R relationship [10]. The next ten channels contain reflectivity measurements (dBZ) taken from ten
115 altitude levels from 1 km to 10 km with 1 km step. And in the last ten channels, radial velocity (m/s)
116 is presented. The radial velocity measurements are also taken from ten altitude levels from 1 km to
117 10 km with 1 km step. The topography surrounded each radar in the dataset is provided [7] as well as
118 latitude and longitude coordinates. The data example is partially shown in Figure 2a.
119 3.1 Precipitation intensity
120 Precipitation intensity on a 600 m altitude level is represented with one channel and its values are
121 stored in mm/hr units. It is not a direct measurement: the precipitation rate is calculated from
122 reflectivity values with Marshal-Palmer type of Z-R relationship [10]. In addition to mm/hr values
123 two special values are presented in data: -2e6 value marks areas where measurements are not
124 available, -1e6 value marks areas where no precipitation events have been detected. Both values can
125 be converted to 0 mm/hr, and we additionally filtered points with -2e6 values to prepare a binary
126 mask for each radar frame.
127 As shown in Figure 2c the precipitation event behaviour depends on the season and events with high
128 precipitation rates are more probable in summer than winter.
129 We investigated the distribution of precipitation intensity difference between two adjacent radar
130 images: as Figure 2d shows, in the winter season the precipitation rate difference between two
131 adjacent radar images is much lower than in summer season, showing the seasonal dependence in
132 data.
133 Peaks which are visible in Figure 2d are the result of specificity of the combination of radar-side
134 filtration algorithms and Marshall-Palmer type of Z-R relationship.
135 3.2 Radar reflectivity
136 Reflectivity values represent direct radar measurements in dBZ units. That signal provides information
137 about the amount of moisture in the atmosphere. The measurements are taken for ten altitude levels
138 from 1 km to 10 km with 1 km step. We report the reflectivity on a number of levels as we believe that
139 this kind of differentiation covers more important cases such as the sudden precipitation occurrence,
140 see Fig. 3.
141 The radar reflectivity is both seasonally and geographically dependent measurement. As Figure 2c
142 shows in the winter season reflectivity values are lower than in summer, and demi-seasonal measure-
143 ments also vary.
144 In order to demonstrate the geospatial diversity, we compare the mean reflectivity for two radars:
145 Arkhangelsk (on the north) and Krasnodar (on the south) in Figure 4. It can be seen that both seasonal
146 and altitudinal dependencies are different for these radars, which shows the wide range of weather
147 conditions and data variability.
148 3.3 Radial velocity
149 Radial velocity (m/s) describes the horizontal wind speed over X and Y axes mapped into a single
150 value. The data is provided for ten altitude levels from 1 km to 10 km with 1 km step similar to
151 reflectivity data. Positive values mark the movement from the radar center, while negative values
152 describe the movement to the radar center. According to Figure 4 radial velocity values are also
153 seasonally dependent.
4Figure 2: Featuring RuDar dataset. (a) The sky above the Moscow Region, Vnukovo Radar; axes
ticks are given in kilometers. Ten levels of the precipitation intensity are shown (for each height
level from 1 km to 10 km), together with the topography (magnified for visualization purposes)
on the bottom. The lined cuts on the left part of the plot demonstrate a specific case of urban
obstruction in the radar vision: skyscrapers are not shown in the topography map yet they affect the
scan result. (b) Natural obstructions near Mineralnye Vody city: the mountain chain on the south
blocks the radar, reducing the receptive field down to the area denoted by the white dotted line. (c)
Seasonal dependence of the precipitation intensity distribution (mm/hr per pixel). During the winter
season events with high precipitation rates are much less represented than in the summer season.
We clipped high precipitation rates ( > 140 mm/hr). (d) The distribution of precipitation intensity
difference between two adjacent radar images (mm/hr per pixel) in RuDar dataset. In the winter
season, precipitation events change slower than in the summer season. The periodical peaks are the
result of a peculiarity of the combination of radar-side filtration algorithms and Marshall-Palmer type
of Z-R relationship.
5Figure 3: An example of sudden precipitation occurrence. The image shows radar measurements of
precipitation rate (mm/h) at ground level (up to 600 meters, top row) and reflectivity (dBZ converted
to mm/h by Marshall–Palmer relation) at an elevation of 3 km (bottom row) for 3 consequent time
moments with an interval of ten minutes. The data from a 3 km height provide information about
future precipitation before the actual rain starts. The example is for June 19th, 2020, 9:30 AM UTC,
Moscow, Russia.
Figure 4: Comparison of two different regions: Krasnodar (on the south) and Arkhangelsk (on the
north) in terms of mean reflectivity (left) and mean radial velocity (right) on different height levels.
Only non-zero values are taken into account. Regions demonstrate different patterns in the altitude
intensity and radial velocity distribution as well as the seasonal changes.
154 3.4 Geographical information
155 In addition to atmosphere scans, RuDar dataset contains topography and geographical coordinates
156 associated with each radar. Geographical coordinates (latitudes and longitudes) are provided for each
157 point where measurements are presented. Topography information (meters) [7] is resampled to used
158 coordinate grid. Topography data is represented as a two-dimensional tensor where positive values
159 describe the altitude above the sea level and negative values are responsible for the altitude below the
160 sea level. The example of topography is shown in Figure 2b where the case of natural radar vision
161 obstruction is demonstrated. Note that the topography measurements do not include the urban areas,
162 and Figure 2a shows that the skyscrapers in Moscow may also pose a problem.
6Table 2: The dates used in each split of the RuDar dataset.
Training Validation Test
Spring March, 2019 – May, 2019 March, 2020 April, 2020 – May, 2020
Summer June, 2019 – August, 2019 June, 2020 July, 2020 – August, 2020
Autumn September, 2019 – November, 2019 September, 2020 October, 2020 – November, 2020
Winter December, 2019 – February, 2020 December, 2020 January, 2021 – February, 2021
163 4 Nowcasting Baselines
164 4.1 Problem Statement
165 We consider a precipitation nowcasting problem as a sequence-to-sequence video prediction task
166 where we want to find a function f (·) that predicts k future radar images (output sequence) with
167 precipitation rate in mm/hr using m previous radar images (input sequence):
f (·) : Rm×width×height 7→ Rk×width×height . (1)
168 We use pixelwise mean squared error (MSE, eq. 2) and F1 -measure (eq. 3) on threshold for evaluating
169 the forecasting results.
170 We use raw mm/hr values over C = k × width × height output sequence pixels to calculate MSE.
171 This measure shows the quality of predicting precipitation strength.
1 X
M SE = (y − ŷ)2 , (2)
C
172 where y — a ground truth sequence of radar images and ŷ — a predicted sequence.
173 In order to calculate F1 -measure, we beforehand binarize ground truth and predicted sequences with
174 some threshold. In our experiments threshold value is equal to 0.1 mm/hr. This measure shows the
175 quality of predicting precipitation presence.
2 · TP
F1 = , (3)
2 · TP + FP + FN
176 where T P – cases when precipitations are presented in both ground truth and predicted sequences,
177 F P – cases when precipitations were predicted while there are no precipitation events in ground
178 truth, F N – cases when there are no precipitation in predicted sequences and there are precipitation
179 events in ground truth.
180 4.2 Experimental Setup
181 4.2.1 Data setup
182 In the following experiments, we use subsets of RuDar dataset described in Table 2.
183 We set a maximum precipitation intensity value to 50 mm/hr and assign all points with greater
184 precipitation rates to that maximum value. We chose that value because strong precipitation events
185 with high precipitation rates are rare in the given geographical area.
186 4.2.2 Models
187 We represented f (·) with a persistent model as a weak baseline and used a state-of-the-art optical flow
188 approach as a strong baseline. There are several neural network-based approaches, e.g. MetNet [11]
189 and GAN-like [12], but we do not consider them here for simplicity.
190 Persistent. In the persistent model, we consider the latest radar image from an input sequence as a
191 forecast for all k images of an output sequence. So it is a constant prediction of precipitation events.
192 Optical Flow. We take a state-of-the-art optical flow approach from Rainymotion library [13], and
193 use Dense Inverse Search model with constant-vector advection scheme. The advantage of this
7Table 3: The baseline resulting metrics on the dataset test splits. The first value in the cell is MSE,
the second value is F1 .
Spring Summer Autumn Winter
Persistent 0.8641 / 0.6090 1.9881 / 0.6111 0.3103 / 0.6379 0.1399 / 0.7376
Optical Flow 0.6200 / 0.7052 1.5015 / 0.7285 0.2078 / 0.7337 0.1042 / 0.7686
194 particular optical flow approach over others was shown in previously published works [11] and our
195 experiments.
196 4.3 Results
197 We evaluate described above baseline models on season test splits of the RuDar dataset. For focusing
198 on the rain events we apply an importance sampling approach from [12] which randomly peaks radar
199 frame sequences with probability proportional to an average precipitation rate of the sequence. The
200 results are shown in Table 3.
201 We also evaluated neural network baseline models on the RuDar dataset but on different dates; results
202 are presented in Section B of Supplementary Materials.
203 5 Discussion
204 5.1 Summary
205 In this paper, we propose a weather radar dataset a with wide variety of geographical and climatic
206 conditions and show in contrast to previously published works that a precipitation nowcasting task
207 can be a seasonal dependent problem. This encourages the usage of the seasonal models and separate
208 models for precipitation rate forecasting and precipitation events existence.
209 We believe that our proposed dataset will become a reliable benchmark for precipitation nowcasting
210 models. The code for data preprocessing and model preparation is publicly available 2 . This dataset
211 is provided under the CC BY NC SA 4.0 license.
212 5.2 Limitations
213 We would like to point out a few limitations of out work:
214 • Dataset size. We included the two-year period only in order for the dataset to be compre-
215 hensible and processible by the community, as its size already exceeds 500 GB. This dataset
216 is not intended for a study of long-term climatic changes.
217 • Data shift. Like any other piece of real-world data, our dataset may contain several pecu-
218 liarities. In the text, we discuss the seasonal dependence and geographical shifts, however, it
219 should be noted that the measurements within the sample are also not simultaneous as they
220 obtained by combining the measurements from the narrow beam that scans the atmosphere.
221 • Baselines. We provide the readers with the simplest baselines supporting the dataset.
222 However, we plan to benchmark a number of neural network-based baselines, like MetNet
223 [11] and [12], in future studies.
224 5.3 Possible Prospects
225 A two-year dataset may be applicable not for the nowcasting task only but in a number of contemporary
226 ML problems, including:
227 Rare event detection. Various storms and rare weather conditions are of special interest both to the
228 researchers and end-users. Some works even emphasize this area of research [6]. We expect various
229 anomaly detection algorithms to be of great use here.
2
The link to the full dataset will be available after review, sample is available at https://disk.yandex.
ru/d/hFSeySpFkR2T1Q.
8230 Data shift and uncertainty estimation. The variety of both geographical and temporal conditions
231 makes this dataset a good candidate for the modeling of distribution shift scenarios (see, e.g., [14]),
232 where test data may naturally vary from the training data dramatically. In this case, various uncertainty
233 estimation approaches, like in [15] may be helpful.
234 Active learning. One of the most important scenarios for the day-to-day forecasting systems is active
235 learning, since continuous data flow allows for the production model to learn on its own mistakes,
236 correcting previous predictions. However, processing and retraining on huge amounts of data poses a
237 challenge, and one may use smarter ways of data sampling (of both past archives and daily chunks of
238 data) in order to reduce the data processing and model training times.
239 References
240 [1] I. Holleman, “Bias adjustment and long-term verification of radar-based precipitation estimates,”
241 Meteorological Applications, vol. 14, no. 2, pp. 195–203, 2007.
242 [2] X. Shi, Z. Gao, L. Lausen, H. Wang, D.-Y. Yeung, W.-k. Wong, and W.-c. WOO, “Deep
243 learning for precipitation nowcasting: A benchmark and a new model,” in Advances in Neural
244 Information Processing Systems (I. Guyon, U. V. Luxburg, S. Bengio, H. Wallach, R. Fergus,
245 S. Vishwanathan, and R. Garnett, eds.), vol. 30, Curran Associates, Inc., 2017.
246 [3] S. Ansari, S. D. Greco, E. Kearns, O. Brown, S. Wilkins, M. Ramamurthy, J. Weber, R. May,
247 J. Sundwall, J. Layton, A. Gold, A. Pasch, and V. Lakshmanan, “Unlocking the potential of
248 NEXRAD data through NOAA’s big data partnership,” Bulletin of the American Meteorological
249 Society, vol. 99, no. 1, pp. 189 – 204, 2018.
250 [4] T. Ramsauer, T. Weiß, and P. Marzahn, “Comparison of the GPM IMERG final precipitation
251 product to RADOLAN weather radar data over the topographically and climatically diverse
252 germany,” Remote Sensing, vol. 10, no. 12, 2018.
253 [5] G. Franch, V. Maggio, L. Coviello, M. Pendesini, G. Jurman, and C. Furlanello, “TAASRAD19,
254 a high-resolution weather radar reflectivity dataset for precipitation nowcasting,” Scientific Data,
255 vol. 7, no. 1, pp. 1–13, 2020.
256 [6] M. Veillette, S. Samsi, and C. Mattioli, “SEVIR : A storm event imagery dataset for deep
257 learning applications in radar and satellite meteorology,” in Advances in Neural Information
258 Processing Systems (H. Larochelle, M. Ranzato, R. Hadsell, M. F. Balcan, and H. Lin, eds.),
259 vol. 33, pp. 22009–22019, Curran Associates, Inc., 2020.
260 [7] J. J. Becker, D. T. Sandwell, W. H. F. Smith, J. Braud, B. Binder, J. Depner, D. Fabre, J. Factor,
261 S. Ingalls, S.-H. Kim, R. Ladner, K. Marks, S. Nelson, A. Pharaoh, R. Trimmer, J. V. Rosen-
262 berg, G. Wallace, and P. Weatherall, “Global bathymetry and elevation data at 30 arc seconds
263 resolution: SRTM30_PLUS,” Marine Geodesy, vol. 32, no. 4, pp. 355–371, 2009.
264 [8] J. G. Fairman, D. M. Schultz, D. J. Kirshbaum, S. L. Gray, and A. I. Barrett, “Climatology of
265 Size, Shape, and Intensity of Precipitation Features over Great Britain and Ireland,” Journal of
266 Hydrometeorology, vol. 18, no. 6, pp. 1595–1615, 2017.
267 [9] A. Overeem and R. Imhoff, “Archived 5-min rainfall accumulations from a radar dataset for the
268 netherlands,” Mar 2020.
269 [10] J. S. Marshall and W. M. K. Palmer, “The distribution of raindrops with size,” Journal of
270 Atmospheric Sciences, vol. 5, no. 4, pp. 165 – 166, 1948.
271 [11] C. K. Sønderby, L. Espeholt, J. Heek, M. Dehghani, A. Oliver, T. Salimans, S. Agrawal,
272 J. Hickey, and N. Kalchbrenner, “Metnet: A neural weather model for precipitation forecasting,”
273 arXiv preprint arXiv:2003.12140, 2020.
274 [12] S. Ravuri, K. Lenc, M. Willson, D. Kangin, R. Lam, P. Mirowski, M. Fitzsimons, M. Athanas-
275 siadou, S. Kashem, S. Madge, et al., “Skillful precipitation nowcasting using deep generative
276 models of radar,” arXiv preprint arXiv:2104.00954, 2021.
277 [13] G. Ayzel, M. Heistermann, and T. Winterrath, “Optical flow models as an open benchmark for
278 radar-based precipitation nowcasting (rainymotion v0.1),” Geoscientific Model Development,
279 vol. 12, no. 4, pp. 1387–1402, 2019.
280 [14] A. Malinin, N. Band, G. Chesnokov, Y. Gal, M. J. Gales, A. Noskov, A. Ploskonosov,
281 L. Prokhorenkova, I. Provilkov, V. Raina, et al., “Shifts: A dataset of real distributional
282 shift across multiple large-scale tasks,” arXiv preprint arXiv:2107.07455, 2021.
9283 [15] P. Grönquist, T. Ben-Nun, N. Dryden, P. Dueben, L. Lavarini, S. Li, and T. Hoefler, “Predicting
284 weather uncertainty with deep convnets,” arXiv preprint arXiv:1911.00630, 2019.
285 Checklist
286 1. For all authors...
287 (a) Do the main claims made in the abstract and introduction accurately reflect the paper’s
288 contributions and scope? [Yes]
289 (b) Did you describe the limitations of your work? [Yes] See Section 5
290 (c) Did you discuss any potential negative societal impacts of your work? [Yes] See
291 Section 1
292 (d) Have you read the ethics review guidelines and ensured that your paper conforms to
293 them? [Yes]
294 2. If you are including theoretical results...
295 (a) Did you state the full set of assumptions of all theoretical results? [N/A]
296 (b) Did you include complete proofs of all theoretical results? [N/A]
297 3. If you ran experiments...
298 (a) Did you include the code, data, and instructions needed to reproduce the main experi-
299 mental results (either in the supplemental material or as a URL)? [Yes] See Abstract
300 and Section 5
301 (b) Did you specify all the training details (e.g., data splits, hyperparameters, how they
302 were chosen)? [Yes] See Supplementary materials
303 (c) Did you report error bars (e.g., with respect to the random seed after running experi-
304 ments multiple times)? [No]
305 (d) Did you include the total amount of compute and the type of resources used (e.g., type
306 of GPUs, internal cluster, or cloud provider)? [No]
307 4. If you are using existing assets (e.g., code, data, models) or curating/releasing new assets...
308 (a) If your work uses existing assets, did you cite the creators? [N/A]
309 (b) Did you mention the license of the assets? [Yes]
310 (c) Did you include any new assets either in the supplemental material or as a URL? [N/A]
311
312 (d) Did you discuss whether and how consent was obtained from people whose data you’re
313 using/curating? [N/A]
314 (e) Did you discuss whether the data you are using/curating contains personally identifiable
315 information or offensive content? [N/A]
316 5. If you used crowdsourcing or conducted research with human subjects...
317 (a) Did you include the full text of instructions given to participants and screenshots, if
318 applicable? [N/A]
319 (b) Did you describe any potential participant risks, with links to Institutional Review
320 Board (IRB) approvals, if applicable? [N/A]
321 (c) Did you include the estimated hourly wage paid to participants and the total amount
322 spent on participant compensation? [N/A]
10You can also read