Overview of the 2021 ImageCLEFdrawnUI Task: Detection and Recognition of Hand Drawn and Digital Website UIs - CEUR ...
←
→
Page content transcription
If your browser does not render page correctly, please read the page content below
Overview of the 2021 ImageCLEFdrawnUI Task:
Detection and Recognition of Hand Drawn and
Digital Website UIs
Raul Berari1 , Andrei Tăuteanu1 , Dimitri Fichou1 , Paul Brie1 , Mihai Dogariu2 ,
Liviu Daniel Ştefan2 , Mihai Gabriel Constantin2 and Bogdan Ionescu2
1
 teleportHQ, Romania, dimitri.fichou@teleporthq.io
2
 Politehnica University of Bucharest, Romania, bogdan.ionescu@upb.ro

 Abstract
 An appealing web-page is a must have for most companies nowadays. The creation of such user inter-
 faces is a complex process involving various actors such as project managers, designers and developers.
 Facilitating this process can democratize access to the web to non-experts. The second edition Image-
 CLEFdrawnUI 2021 addresses this issue by fostering systems that are capable of automatically generat-
 ing a web-page from a sketch. Participants were challenged to develop machine learning solutions to
 analyze images of user interfaces and extract the position and type of its different elements, such as im-
 ages, buttons and text. The task is separated into two subtasks, the wireframe subtask with hand drawn
 images and the screenshot subtask with digital images. In this article, we overview the task require-
 ments and data as well as the participants results. For the wireframe subtask, three teams submitted
 21 runs and two of the teams outperformed the baseline, with the best run scoring 0.9 compared to a
 baseline of 0.747 in terms of mAP@0.5 IoU. For the screenshot subtask, one team submitted 7 runs and
 all runs scored better than the baseline in terms of mAP 0.5@IoU, the best run obtaining 0.628 against
 0.329 for the baseline.

 Keywords
 Object Detection, User Interface, Machine Learning

1. Introduction
Recently, the use of machine learning techniques with the aim of automatizing the creation of
User Interfaces (UI) gained interest. Several data sets have been made available to help this effort.
In 2017, the RICO data set was released by Deka et al. [1] and consisted of 72,219 screenshots of
mobile applications along with the associated position and tree structure of their UI elements
present on screen. This data set had later been used as template to create the SWIRE data set
in which 3,802 wireframes were drawn by designers and used to demonstrate the retrieval of
similar UI after deep learning embedding and nearest neighbour search [2]. As the positions of
the UI elements in the RICO data set were extracted automatically, the bounding boxes were not
always overlapping with the elements in the images. The VINS data set was collected to address
those drawbacks by manually annotating 4,543 images and use them in two ways, to retrieve
similar UIs to a query screenshot and for object detection [3]. Similarly to this last example of

CLEF 2021 – Conference and Labs of the Evaluation Forum, September 21–24, 2021, Bucharest, Romania
 © 2021 Copyright for this paper by its authors. Use permitted under Creative Commons License Attribution 4.0 International (CC BY 4.0).
 CEUR
 Workshop
 Proceedings
 http://ceur-ws.org
 ISSN 1613-0073 CEUR Workshop Proceedings (CEUR-WS.org)
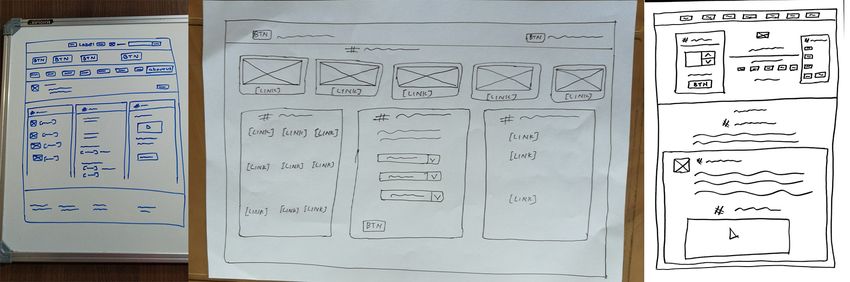
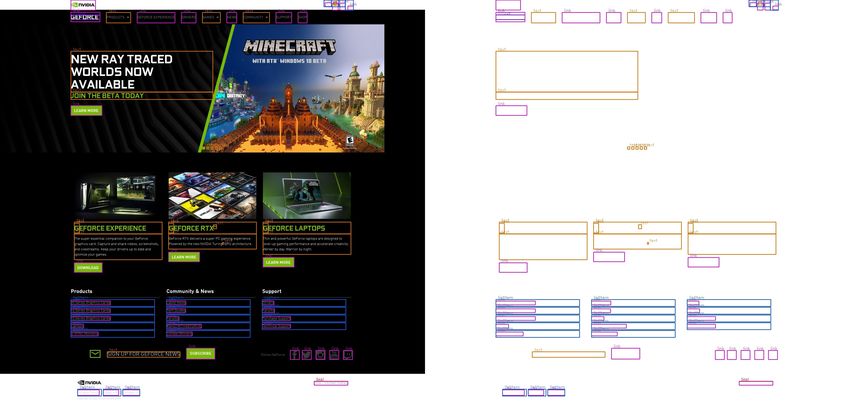
Figure 1: Website screenshot (left) and its bounding boxes (right).

object detection, several end-to-end approaches were explored. Pix2code [4] and UI2code [5]
were introduced to analyze screenshots and translate them into domain specific languages via
Convolutional Neural Network encoding followed by Recurrent Neural Network decoding.
 This paper presents the second edition of the ImageCLEFdrawnUI task as part of the Image-
CLEF1 benchmarking campaign [6] which is itself part of CLEF2 (CROSS Language Evaluation
Forum). As in the previous edition [7, 8, 9, 10], the participants must develop a machine learning
system able to detect the position and type of different UI elements in images. The task is
separated in two subtasks, one focused on hand drawn UI like last year and a new one taking as
input digital screenshots (see an example in Figure 1).
 The next sections are organized as follows. The data sets are presented in Section 2. The
evaluation methodology is described in Section 3. In Section 4, the task results are presented
and finally, Section 5 discusses the results and the future work for this task.

2. Data set
Two separate data sets have been created for the subtasks of the challenge. The former, cor-
responding to the wireframe subtask, is an improved version of the 2020 ImageCLEFdrawnUI
task and consists of pictures of hand-drawn website representations. The wireframes are highly
abstract, a fact which encouraged the creation of a standard for defining 21 clearly differentiated
classes of UI elements. The annotation process took place manually.
 The latter, representing the screenshot sub-task, is a novel data set obtained through the
recursive parsing and screen capturing of a large number of websites. After applying several
filters to eliminate most low quality data points, the resulting collection consists of both
partial and full representations of websites as they are found on the internet. To account for
the high variance between instances from the same class of UI elements, the set of possible
 1
 https://www.imageclef.org/2021/drawnui
 2
 http://www.clef-campaign.org/
categories numbered 6 classes. Annotation was a predominantly automated process, with
manual intervention for about 30% of the images.

2.1. Wireframe Subtask
Wireframes represent abstract, paper-drawn drawings of websites, created with the intent of
reducing an interface to its simplest parts. For example, a web page could be depicted through
an arrangement of abstract shapes corresponding to the images, text, and buttons visible to
the user. Such depictions are used by designers in their work with either clients, developers or
business owners as a simplified way of portraying interfaces and user interactions.

Figure 2: Ground truth: the 21 visual representations for the UI elements.

 To reduce the ambiguity present when ‘translating’ a website into its wireframe form, a
convention was created, establishing strict rules for differentiating between the classes of
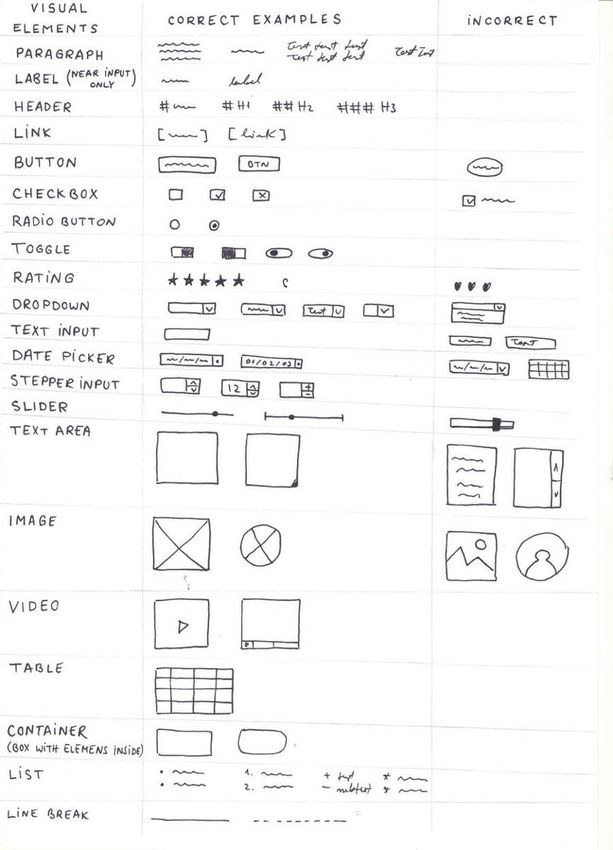
Figure 3: Three data points of the wireframe data set.

elements (see Figure 2). A single data point represents a picture of such a wireframe, annotated
according to the convention. The data set consists of 3,218 images used for training the object
detection model and 1,073 used in testing it. Figure 3 illustrates three random data points.
 Similar to the version from last year, the data points were created by taking pictures under
different lightning and scanning wireframe drawings. Although the UI elements respect the con-
vention mentioned above, the color of the contour and the lighting conditions differ throughout
the data set. Annotation was provided manually, using the open-source Microsoft tool, VoTT3 .

2.1.1. Changes from Last Year
The wireframe data set from the ImageCLEFdrawnUI task in 2020 lacked the proper representa-
tion of certain UI elements, such as the stepper input, video, list and table classes. Additionally,
the split between the training and testing sets did not take into account this fact, which conse-
quently resulted in an unequal proportion of the UI classes between the two. To account for this
issue, we have supplanted the data set with an additional 1,200 images, prioritizing the ones
which contain one or more instances of the rare classes (table, stepper input, list and video).
Splitting the data set also received special attention, with the resulting subsets denoting a better
representation (see Figure 5).
 Another problem that arose after analysing the 2020 submissions and working notes was that
similar-looking data points were present in both the training and the testing sets. This may
have caused the models to overfit on some examples, lowering the difficulty of the challenge. In
2021 the data set split included all versions of a wireframe (which differ by lighting or type of
capture) in only one of the subsets.

2.1.2. Data set Analysis
As Figure 4 shows, the density of UI elements per image has increased on average, with 54
compared to last year’s 28. While the minimum number of elements per image has remained the
same (4), the maximum number of elements per image has increased to 175, from a maximum

 3
 https://github.com/microsoft/VoTT/
Figure 4: Distribution of the number of UI elements per image.

Figure 5: The proportion of each class of UI elements in the training and testing sets.

of 131 in 2020. This is the result of supplanting with a significant number of dense data points,
for the most part wireframes representing desktop versions of websites.
 Figure 5 illustrates that given the nature of the data, which reflects patterns found in the
majority of websites, some UI classes will inherently be more common than others. Combined
with the fact that wireframes seldom include only a few elements, manipulating the data set
split to create a more proportional representation in the rare classes will essentially skew other
classes into non-proportional ratios. For example, wireframes containing a table, which is a
rare class, will naturally have a higher number of elements, firstly because tables are more
common on desktop web pages, and secondly because tables themselves contain a number
of other elements. As an example, taken by the number of data points, the train-test ratio is
approximately 3:1, whereas tables are relatively over-represented in the test set (train-test ratio
is less than 2:1). This could have resulted in discrepancies affecting other classes of elements by
under-representing them in the training set.
 Although under-representation as a by-product skews the proportion of more common
elements towards the test set, we regarded the number of instances of under-represented items
to be too high to pose any problems to the model performance. Since all under-represented
classes number thousands of instances, the impact would be minimal.
2.2. Screenshot Subtask
The second data set consists of a collection of sections and full-page screenshots, extracted from
a set of selected websites. The data points were acquired using a multi-step process, which will
be described in the following section. The data set is split into 6,555 images used for training,
1,818 for testing, and 903 for validation.
 Considering that working with websites imply a large number of diverse HTML tags,
analysing a large amount webpages using the default tags would not be a suitable approach. As
an initial solution, a mapping of each tag into 10 classes – each encapsulating the use case of
that respective tag on the web page – had been adopted as follows: text, image, svg, video, link,
input, list item, table, button and line break. After analysing the data set and testing an object
detection model on it, it could be noticed that a number of classes created a level of ambiguity
which reduced its performance. Consequently, the list item, video, table and line break classes
have been removed, the image and svg classes merged, and the text class split into text and
heading.
 The following is a set of short descriptions of the 6 classes that can be found throughout the
data set:

 • Text: One or multiple lines of text, generally in a smaller font size.
 • Heading: Usually one line of text, written in a different color or a bigger font size.
 • Link: Text usually present inside the header and footer. If inside the page, it is often
 written in a different color, or underlined.
 • Image: A simple image or icon.
 • Input: Text inputs present in forms, usually having a placeholder.
 • Button: A rectangular element that contains text and generally has a different background
 color.

2.2.1. Acquisition
Acquiring the data set implied a multi-step process. Firstly, an in-house web parser was built
in order to allow data gathering and screenshots by automatically processing a list of popular
websites. However, a significant amount of data points were not fit to be used for object
detection, as they contained issues such as bounding box overlapping or 404 pages. To discard
most of those data points, a machine learning-based classifier was created to predict the usability
of a website. The pipeline was further enhanced to be capable of also parsing the links found in
websites of high-probability, therefore creating a recursive loop, and exponentially increasing
the number of data points.
 Then, an algorithm that detects and score sections inside the websites was created. A section
is a point of interest, inside a website, consisting of a collection of elements, such as a header, a
footer, a navbar, a form or a Call-To-Action.
 Using both the full-page screenshots and section data sets, a selection of the highest quality
data points was made, in order to be used in the final data set. The initial selection has been
done solely based on the probabilities returned by the scoring algorithms for both types of data.
Afterwards, using an Interquartile Range built upon different properties such as page height,
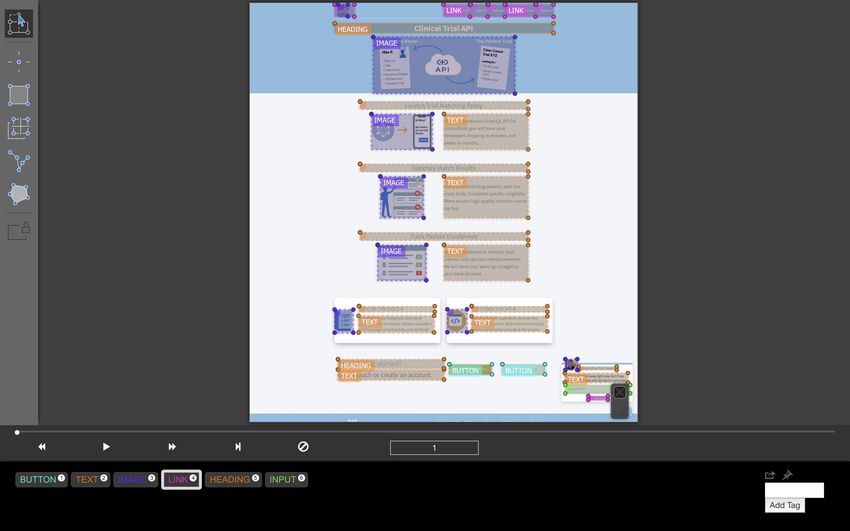
Figure 6: Screenshot of an annotation using VoTT.

page width or number of elements, everything that was bellow or above a given threshold,
has been removed in order to remove the outliers. Further into the data processing, the most
optimal 10,000 data points – consisting of both full-page screenshots, and sections – have been
selected. From the 10,000, a last clean-up and a split has been done, resulting in the three sets
mentioned in the previous section.

2.2.2. Annotation
Image annotation was provided by a single member of our team, using the desktop application
VoTT (see Figure 6). Each element was annotated using a rectangle shape, which covers the
object in its entirety, regardless of potential overlap with other elements. Only the test and
validation sets were manually annotated, in order to provide an accurate verification. The train
set is using the position of the elements that has been retrieved from the websites, so some
inaccuracy might be present.

2.2.3. Data set Analysis
As the sections are much smaller than the full-page screenshots, the difference between the
number of elements of the two types of data points is visible, which can be observed in Figure
7. Given the reduced number of elements inside sections, the detection of elements inside
them may have a higher accuracy than on full-page screenshots. Because the data points
were acquired from a list of popular websites, the number of elements per class mirrors their
frequency in a web page design (see Figure 8).
 The most common class is the text, which is the main way to provide information. This
Figure 7: Distribution of the number of UI elements per screenshot image.

category includes HTML tags, such as paragraphs, labels or spans. Initially, the headings were
included in the text class, but were then put in their own category to take into account their
different usage. While the text is used to provide specific information, the headings are used to
draw and direct the attention to a specific section or content. They are also designed in bigger
fonts or different colors, and can be easily distinguished from the regular text.
 The links are the second most common class, mainly because they are treated individually,
and not as a group inside a given section. For example, a navbar can contain up to 10 links,
while a footer can contain more than 20. The links are usually distinguishable by their position
in the page, their font or their decorations. Moreover, if a link has been accessed before, the
browser usually displays that link in a different style.
 As images in a web page increase the number of views by up to 90%, it means that they are
present in a consistent amount in the data set. As the other classes consist mainly of text in
different styles or positions, the images can be easily differentiated from the rest, so certain
ambiguities are diminished. The last 2 classes are the inputs and buttons, which are used in
specific cases like in Forms or Call-To-Action sections of the websites.

3. Evaluation Methodology
Two methods are used to compute the scores for each run: mean average precision (mAP) and
recall. Both require a minimum of 0.5 IoU overlap between the ground truth and the detection
Figure 8: Tree map with the number of UI elements per screenshot class.

boxes to be taken into account by the evaluator. The algorithm used in this process is the Python
API offered by COCO4 :

 • mAP@0.5 IoU: The localised mean average precision for each submission.
 • Recall@0.5 IoU: The localised mean recall for each submission,

 The mean average precision is used as the primary metric for deciding the leader, while
the recall provides a secondary metric in the case where two participants score equally in the
former.

4. Results
Three teams submitted a total of 21 runs for the wireframe subtask and one team submitted
7 runs for the screenshot subtask. Each subtask had a submission limit of 10 runs per team.
Table 1 and Table 2 display the mean average precision and recall at 0.5 IoU for each run of each
task.
 The baseline score was obtained by training a Faster R-CNN [11] model (with a resnet101
backbone), using the detectron2 API [12] on an Amazon Web Services EC2 instance. The
instance was equipped with an nVidia K80 GPU, CUDA 10.0 and Python 3.6. The batch size was
set to 2 and the number of steps to 100,000. Apart from the learning rate being set at 0.00025,
all the other default options were kept.
 For the wireframe task, team pwc started with a baseline score of 0.649 and enhanced it to
0.836 mAP@0.5 IoU using data augmentation and parameter optimization, placing them on the
 4
 https://github.com/cocodataset/cocoapi
Table 1
Wireframe Subtask results: 0.5 and 0.5 for each run. The baselines and best values for
each metric are in bold.
 Team Run id Method mAP@0.5 R@0.5
 vyskocj 134548 ResNeXt-101 (RGB) 0.900 0.934
 vyskocj 134829 ResNeXt-101 (RGB, train+val, +5 epochs) 0.900 0.933
 vyskocj 134728 ResNet-50 (train+val, greyscale) 0.895 0.927
 vyskocj 134723 ResNet-50 (train+val, RGB, 2× epochs) 0.894 0.928
 vyskocj 134181 ResNet-50 (anchor settings, greyscale) 0.889 0.923
 vyskocj 134232 ResNet-50 (train+val, RGB) 0.888 0.925
 vyskocj 134180 ResNet-50 (anchor settings, RGB) 0.882 0.918
 pwc 134137 Run 132583 with 0.01 confidence cutoff 0.836 0.865
 pwc 134133 Run 132583 with 0.05 confidence cutoff 0.832 0.858
 vyskocj 134175 ResNet-50 (augmentations, RGB) 0.830 0.863
 pwc 134113 Run 132583 with 0.1 confidence cutoff 0.829 0.852
 pwc 134099 Run 132583 with 0.15 confidence cutoff 0.824 0.844
 pwc 134090 Run 132583 with 0.2 confidence cutoff 0.824 0.844
 pwc 132583 YOLOv5x with pre-trained weights , LR, Early Stopping 0.820 0.840
 pwc 132575 YOLOv5l with pre-trained weights 0.810 0.826
 vyskocj 134095 ResNet-50 (baseline, RGB) 0.794 0.832
 vyskocj 134092 ResNet50 0.794 0.832
 dimitri.fichou Faster RCNN with resnet 101 backbone 0.747 0.763
 pwc 132592 YOLOv5x with pre-trained weights and only heads trained 0.701 0.731
 pwc 132567 YOLOv5s with pre-trained weights 0.649 0.675
 pwc 132552 YOLOv5s baseline 0.649 0.675
 AIMultimediaLab 134702 Faster RCNN with VGG16 backbone 0.216 0.319

Table 2
Screenshot Subtask results: 0.5 , and 0.5 for each run. The baselines and best values
for each metric are in bold.
 Team Run id Method mAP@0.5 Recall@0.5
 vyskocj 134224 ResNet-50 (train+val, RGB) 0.628 0.830
 vyskocj 134716 ResNet-50 (train+val, RGB, 2× epochs) 0.621 0.821
 vyskocj 134215 ResNet-50 (anchor settings, RGB) 0.609 0.834
 vyskocj 134214 ResNet-50 (augmentations, RGB) 0.602 0.822
 vyskocj 134217 ResNet-50 (anchor settings, greyscale) 0.601 0.827
 vyskocj 134207 ResNet-50 (baseline, RGB) 0.594 0.815
 vyskocj 134603 ResNeXt-101 (RGB) 0.590 0.807
 dimitri.fichou Faster RCNN with resnet 101 backbone 0.329 0.408

second place. They improved the visual qualities of the data set using histogram equalisation,
followed by conversion to black and white. Several object detection and segmentation models
were considered, but were discarded based on their complexity (U-Net) or poor performance in
detecting small objects (Mask-RCNN). Given its speed and flexibility, the authors chose YOLOv5
for their experiments. Their first five runs checked for the influence of pre-trained weights,
model size, learning rate and layer freeze on the results, concluding that the best score was
achived with the largest model (YOLOv5x) using pre-trained COCO weights and a learning rate
scheduler. Finally, post-processing implied multi-pass inference and confidence cutoff variation.
The former did not improve the results, while the latter offered marginal improvements.
 Team vyskocj increased their wireframe score from the 0.794 baseline to 0.900, while the
screenshot one was improved from 0.594 to 0.628, placing the team on the first place in both
challenges. DETR was considered as an object detector, but given the training time required, the
authors opted for a Faster R-CNN architecture supplemented by a Feature Pyramid Network.
For the screenshot task, a filtering algorithm was implemented to remove noisy data based on
color similarity between bounding boxes. It offered marginal improvements. Augmentation via
resizing was employed, the authors opting for Random Relative Resize, a data processor that
prevents the more aggressive resizing which reduces small object detection accuracy. Cutout
augmentation was also used by removing a number of objects at random from the training
images. Anchor box aspect-ratio was modified in accordance with their frequency in the training
set. For the backbone architecture, the smaller ResNet-50 converged faster and achieved better
results in the Screenshot task. The larger variant, ResNeXt-101, showed better performance on
the Wireframe task.

5. Discussion and Conclusions
Compared to the highest score of the 2020 edition, the wireframe subtask mAP@0.5 IoU
score improved from 0.79 to 0.90, indicating a significant improvement in model performance.
The participants used state-of-the-art model architectures and diversified their modifications,
showcasing unique ways in which the task came to be resolved. These changes brought this
specific challenge closer to its full completion.
 For the screenshot subtask, although the participation rate was very low, the best results
are still higher than expected when compared to the baseline score. The 0.62 mAP score (the
best run from team vyskocj) shows space for further improvement on this much harder task.
The lower scoring derives from the increased level of complexity inherent in screenshots when
compared to wireframes, as well as the relative "pollution" of the data set, which was left in
as a challenge for the contestants. To tackle this, vyskocj produced a filtering algorithm for
removing the noisy data points based on color similarity. They also demonstrated that the
smaller architecture variant, ResNet50, converged faster and obtained better results for the
same number of epochs compared to the bigger model, ResNeXt101.
 Despite the low number of competitors, the results indicate an interest in bridging the gap
between the visual representation of a website and its code, by using object detection tools. For
further editions of the task, our aim is to continue developing the current data sets by making
them more challenging from a technical, object detection perspective, as well as more attractive
to designers or web-developers interested in tackling machine learning problems.

Acknowledgement
Mihai Dogariu, Liviu-Daniel Stefan, Mihai Gabriel Constantin and Bogdan Ionescu’s contribution
is supported under project AI4Media, A European Excellence Centre for Media, Society and
Democracy, H2020 ICT-48-2020, grant #951911.

References
 [1] B. Deka, Z. Huang, C. Franzen, J. Hibschman, D. Afergan, Y. Li, J. Nichols, R. Kumar, Rico: A
 mobile app dataset for building data-driven design applications, in: UIST 2017 - Proceedings
of the 30th Annual ACM Symposium on User Interface Software and Technology, 2017,
 pp. 845–854. doi:10.1145/3126594.3126651.
 [2] F. Huang, J. F. Canny, J. Nichols, Swire: Sketch-based User Interface Retrieval, CHI
 ’19, Association for Computing Machinery, New York, NY, USA, 2019, pp. 1–10. URL:
 https://doi.org/10.1145/3290605.3300334. doi:10.1145/3290605.3300334.
 [3] S. Bunian, K. Li, C. Jemmali, C. Harteveld, Y. Fu, M. S. Seif El-Nasr, VINS: Visual Search
 for Mobile User Interface Design, in: Proceedings of the 2021 CHI Conference on Human
 Factors in Computing Systems, 2021, pp. 1–14.
 [4] T. Beltramelli, pix2code : Generating Code from a Graphical User Interface Screenshot,
 Proceedings of the ACM SIGCHI Symposium on Engineering Interactive Computing
 Systems (2018) 1–9. arXiv:arXiv:1705.07962v2.
 [5] C. Chen, T. Su, G. Meng, Z. Xing, Y. Liu, From UI Design Image to GUI Skeleton : A Neural
 Machine Translator to Bootstrap Mobile GUI Implementation, International Conference
 on Software Engineering 6 (2018).
 [6] B. Ionescu, H. Müller, R. Peteri, A. Ben Abacha, M. Sarrouti, D. Demner-Fushman, S. A.
 Hasan, S. Kozlovski, V. Liauchuk, Y. Dicente, V. Kovalev, O. Pelka, A. G. S. de Herrera,
 J. Jacutprakart, C. M. Friedrich, R. Berari, A. Tauteanu, D. Fichou, P. Brie, M. Dogariu, L. D.
 Ştefan, M. G. Constantin, J. Chamberlain, A. Campello, A. Clark, T. A. Oliver, H. Moustahfid,
 A. Popescu, J. Deshayes-Chossart, Overview of the ImageCLEF 2021: Multimedia retrieval
 in medical, nature, internet and social media applications, in: Experimental IR Meets
 Multilinguality, Multimodality, and Interaction, Proceedings of the 12th International
 Conference of the CLEF Association (CLEF 2021), LNCS Lecture Notes in Computer
 Science, Springer, Bucharest, Romania, 2021.
 [7] P. Gupta, S. Mohapatra, HTML Atomic UI Elements Extraction from Hand-Drawn Website
 Images using Mask-RCNN and novel Multi-Pass Inference Technique, CLEF2020 Working
 Notes. CEUR Workshop Proceedings, CEUR-WS. org< http://ceur-ws. org>, Thessaloniki,
 Greece (September 22-25 2020) (2020).
 [8] N. Narayanan, N. N. A. Balaji, K. Jaganathan, Deep Learning for UI Element Detection:
 DrawnUI 2020, CLEF2020 Working Notes. CEUR Workshop Proceedings, CEUR-WS. org<
 http://ceur-ws. org>, Thessaloniki, Greece (September 22-25 2020) (2020).
 [9] A. Zita, L. Picek, A. Ríha, Sketch2Code: Automatic hand-drawn UI Elements Detection with
 Faster-RCNN., in: CLEF2020 Working Notes. CEUR Workshop Proceedings, CEUR-WS.
 org< http://ceur-ws. org>, Thessaloniki, Greece (September 22-25 2020), 2020.
[10] D. Fichou, R. Berari, P. Brie, M. Dogariu, L. D. Ştefan, M. G. Constantin, B. Ionescu,
 Overview of ImageCLEFdrawnUI 2020: the detection and recognition of hand drawn
 website UIs task, in: CLEF2020 Working Notes. CEUR Workshop Proceedings, CEUR-WS.
 org< http://ceur-ws. org>, Thessaloniki, Greece (September 22-25 2020), 2020.
[11] S. Ren, K. He, R. Girshick, J. Sun, Faster R-CNN: Towards Real-Time Object Detection with
 Region Proposal Networks, in: Advances in Neural Information Processing Systems, 2015.
 arXiv:1506.01497v3.
[12] Y. Wu, A. Kirillov, F. Massa, W.-Y. Lo, R. Girshick, Detectron2, https://github.com/
 facebookresearch/detectron2, 2019.
You can also read