ECONOMIC CONTRIBUTION OF THE AUSTRALIAN BREWING INDUSTRY 2017-18 - FROM PRODUCERS TO CONSUMERS - Acil Allen Consulting
←
→
Page content transcription
If your browser does not render page correctly, please read the page content below

REPORT TO
BREWERS ASSOCIATION OF AUSTRALIA
APRIL 2019

ECONOMIC
CONTRIBUTION OF
THE AUSTRALIAN
BREWING
INDUSTRY 2017-18
 FROM PRODUCERS TO CONSUMERS
ACIL ALLEN CONSULTING PTY LTD
                                                                                                   ABN 68 102 652 148

                                                                                                   LEVEL NINE
                                                                                                   60 COLLINS STREET
                                                                                                   MELBOURNE VIC 3000
                                                                                                   AUSTRALIA
                                                                                                   T+61 3 8650 6000
                                                                                                   F+61 3 9654 6363

                                                                                                   LEVEL ONE
                                                                                                   50 PITT STREET
                                                                                                   SYDNEY NSW 2000
                                                                                                   AUSTRALIA
                                                                                                   T+61 2 8272 5100
                                                                                                   F+61 2 9247 2455

                                                                                                   LEVEL FIFTEEN
                                                                                                   127 CREEK STREET
                                                                                                   BRISBANE QLD 4000
                                                                                                   AUSTRALIA
                                                                                                   T+61 7 3009 8700
                                                                                                   F+61 7 3009 8799

                                                                                                   LEVEL ONE
                                                                                                   15 LONDON CIRCUIT
                                                                                                   CANBERRA ACT 2600
                                                                                                   AUSTRALIA
                                                                                                   T+61 2 6103 8200
                                                                                                   F+61 2 6103 8233

                                                                                                   LEVEL TWELVE, BGC CENTRE
                                                                                                   28 THE ESPLANADE
                                                                                                   PERTH WA 6000
                                                                                                   AUSTRALIA
                                                                                                   T+61 8 9449 9600
                                                                                                   F+61 8 9322 3955

                                                                                                   167 FLINDERS STREET
                                                                                                   ADELAIDE SA 5000
                                                                                                   AUSTRALIA
                                                                                                   T +61 8 8122 4965

                                                                                                   ACILALLEN.COM.AU

SUGGESTED CITATION FOR THIS REPORT                                                                CONTRIBUTING TEAM MEMBERS:

ACIL ALLEN CONSULTING (2019), ECONOMIC CONTRIBUTION OF THE AUSTRALIAN BREWING INDUSTRY 2017-18:   JYOTHI GALI
FROM PRODUCER TO CONSUMER. REPORT PREPARED FOR BREWERS ASSOCIATION OF AUSTRALIA AND               GUY JAKEMAN
NEW ZEALAND INC., CANBERRA.

© ACIL ALLEN CONSULTING 2019
C            O             N             T      E          N          T          S
      EXECUTIVE SUMMARY                                                                                I
      GLOSSARY OF TERMS                                                                          VII
      1
       BEER INDUSTRY OVERVIEW                                                                          1
1.1    Introduction                                                                                    1
1.2    Recent trends                                                                                   1

      2
       MEASURING ECONOMIC CONTRIBUTION                                                                 5
2.1    Direct economic contribution                                                                    5
2.2    Indirect economic contribution                                                                  6
2.3    Data sources                                                                                    7

      3
       BEER PRODUCTION BY STATE                                                                        11
3.1    Direct economic contribution                                                                    11
3.2    Indirect economic contribution (supply chain)                                                   12
3.3    Wholesale prices                                                                                14

      4
       BEER RETAILING BY STATE                                                                         17
4.1    Retail prices                                                                                   17
4.2    Retail cost structure                                                                           19
4.3    Direct economic contribution                                                                    19
4.4    Indirect economic contribution (supply chain)                                                   20

      5
       TOTAL ECONOMIC CONTRIBUTION                                                                     22

      FIGURES
      FIGURE ES 1    AUSTRALIAN EMPLOYMENT ASSOCIATED WITH DOMESTICALLY BREWED AND RETAILED BEER
                      (2017-18)                                                                         II
      FIGURE ES 2    CONTRIBUTION TO AUSTRALIAN GDP FROM THE CONSUMPTION OF AUSTRALIAN BREWED
                      BEERS (2017-18)                                                                  III
      FIGURE ES 3    EMPLOYMENT BY BEER MANUFACTURING BUSINESSES                                       V
      FIGURE ES 4    BREWING INDUSTRY TOTAL ECONOMIC CONTRIBUTION BY STATE (2017-18)                   VI
      FIGURE 1.1      AUSTRALIAN BEER CONSUMPTION BY CATEGORY, 2011-12, 2015-16 AND 2017-
                      18                                                                                2
      FIGURE 1.2      COMPONENTS OF AVERAGE RETAIL PRICE OF AUSTRALIAN PRODUCED AND CONSUMED BEER,
                      2017-18                                                                           2
      FIGURE 1.3      INDICATIVE COST STRUCTURE OF A CARTON OF FULL-STRENGTH BEER                       3
      FIGURE 1.4      AUSTRALIAN PRODUCTION AND APPARENT CONSUMPTION OF BEER, 2017-18                   4
      FIGURE 1.5      SHARE OF VOLUME AND VALUE OF BEER CONSUMPTION BY SALES CHANNEL, 2017-18           4
      FIGURE 2.1      CALCULATION OF DIRECT VALUE ADDED                                                 6
      FIGURE 3.1      MAP OF THE PRODUCTION COSTS OF AUSTRALIAN COMMERCIAL BREWING INDUSTRY, 2017-18   13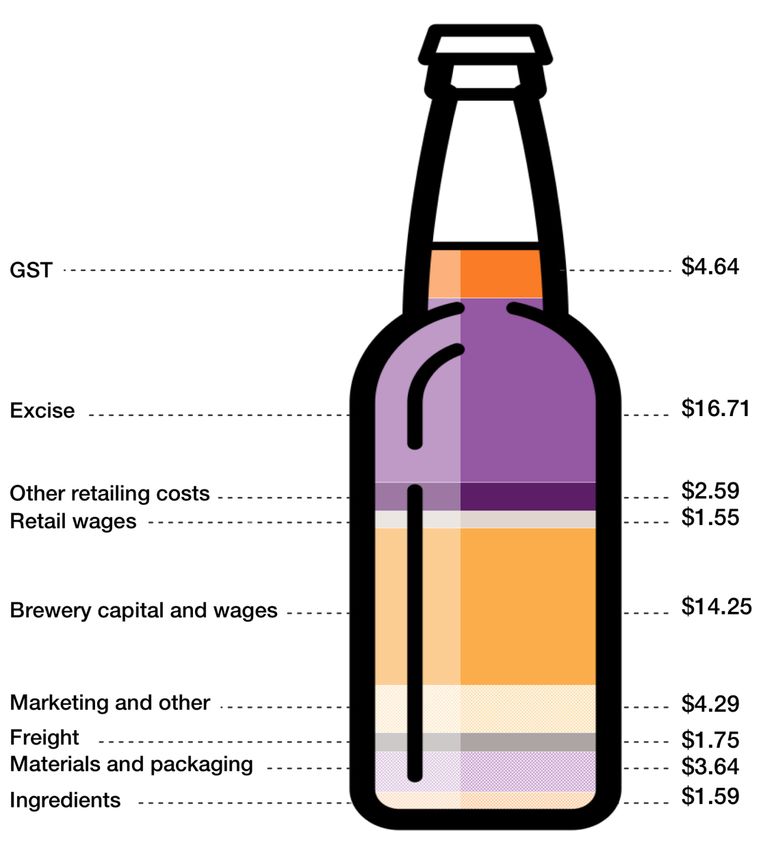
C           O           N           T          E          N           T          S
FIGURE 3.2    AVERAGE WHOLESALE PRICE OF AUSTRALIAN PRODUCED KEG AND PACKAGED BEER (PER
              LITRE), 2017-18                                                                 15
FIGURE 3.3    AVERAGE WHOLESALE PRICE OF AUSTRALIAN PRODUCED KEG AND PACKAGED BEER, 2017-18   16
FIGURE 4.1    AVERAGE RETAIL PRICES FOR KEG AND PACKAGED BEER BY SALES CHANNEL, 2017-18       18
FIGURE 4.2    VALUE OF DOMESTICALLY PRODUCED COMMERCIAL BEER SALES TO AUSTRALIAN
              CONSUMERS BY SALES CHANNEL, 2017-18                                             18
FIGURE 4.3    BASIC COST STRUCTURE OF RETAIL BEER BY SALES CHANNEL IN AUSTRALIA, 2017-18      19
FIGURE 5.1    AUSTRALIAN EMPLOYMENT ASSOCIATED WITH DOMESTICALLY BREWED AND RETAILED BEER,
              2017-18                                                                         25
FIGURE 5.2    CONTRIBUTION TO AUSTRALIAN GDP FROM THE CONSUMPTION OF AUSTRALIAN BREWED
              BEERS, 2017-18                                                                  26
FIGURE 5.3    TOTAL BREWING INDUSTRY CONTRIBUTION BY STATE, 2017-18                           27

TABLES
TABLE ES 1   ECONOMIC CONTRIBUTION OF THE AUSTRALIAN BREWING INDUSTRY, 2017-18                IV
TABLE ES 2   EMPLOYMENT CONTRIBUTION OF THE AUSTRALIAN BREWING INDUSTRY, 2017-18               V
TABLE 2.1     MAJOR BREWERS BY STATE, 2017-
              18                                                                               8
TABLE 2.2     ESTIMATED BEER PRODUCTION BY STATE, 2017-18                                      9
TABLE 2.3     ESTIMATED BEER CONSUMPTION BY STATE, 2017-18                                     9
TABLE 2.4     DATA SOURCES                                                                    10
TABLE 3.1     DIRECT ECONOMIC CONTRIBUTION: BEER PRODUCTION, 2017-18                          11
TABLE 3.2     SUPPLY CHAIN ECONOMIC CONTRIBUTION: BEER PRODUCTION, 2017-18                    12
TABLE 3.3     DIRECT AND INDIRECT EMPLOYMENT CONTRIBUTION: BEER PRODUCTION, 2017-18           14
TABLE 4.1     DIRECT ECONOMIC CONTRIBUTION: ON-LICENCE RETAIL VENUES, 2017-18                 19
TABLE 4.2     DIRECT ECONOMIC CONTRIBUTION: OFF-LICENCE RETAIL VENUES, 2017-18                20
TABLE 4.3     RETAILING SUPPLY CHAIN ECONOMIC CONTRIBUTION: ON-LICENCE AND OFF-LICENCE
              VENUES, 2017-18                                                                 20
TABLE 4.4     INDIRECT EMPLOYMENT CONTRIBUTION: ON-LICENCE AND OFF-LICENCE VENUES, 2017-18    21
TABLE 5.1     TOTAL CONTRIBUTION, 2017-18                                                     24

BOXES
BOX 2.1       ABS DEFNITIONS OF VALUE-
              ADDED                                                                           7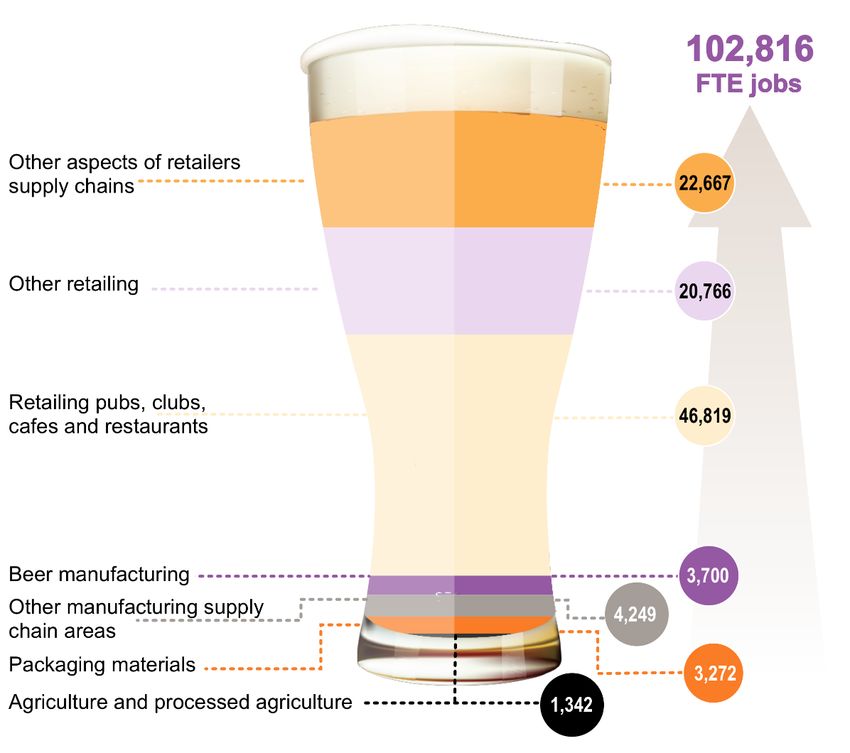
EXECUTIVE
       SUMMARY

    This report presents the state and national economic contribution of the production and consumption
    of Australian brewed beer (from grain to glass) in the 2017-18 financial year.
    This report updates previous ACIL Allen reports estimating the economic contribution of the Australian
    brewing industry in the 2011-12 and 2015-16 financial years.
    The estimates in this report include the direct contribution made by the industry to State GSP and
    employment along with the contribution embodied in the industry’s supply chain.

    Australia
    The analysis finds that, in 2017-18, the production and consumption of Australian beers resulted in
    $16.5 billion of Australian economic output, comprising:
—   $6.0 billion of economic output from the brewing industry with a direct economic contribution of $4.6
    billion and an indirect contribution of a further $1.4 billion through their supply chain
—   $7.1 billion from the on-licence retailing industry with a direct economic contribution of $4.6 billion and
    an indirect contribution of a further $2.5 billion through their supply chain (excluding the brewing
    component)
—   $3.4 billion from the off-licence retailing industry with a direct economic contribution of $2.5 billion and
    an indirect contribution of a further $930 million through their supply chain (excluding the brewing
    component).
    The analysis finds that, in 2017-18, the production and consumption of Australian beers resulted in
    102,816 full-time equivalent (FTE) employed people (Figure ES 1), comprising:
—   12,564 FTE jobs in the brewing industry supply chain with direct employment of 3,700 FTE jobs and
    indirect employment of 8,864 FTE jobs through their supply chain
—   63,290 FTE jobs in the on-licence retailing industry supply chain with direct employment of 46,819
    FTE jobs and indirect employment of 16,471 FTE jobs through their supply chain (excluding the
    brewing component)
—   26,962 FTE jobs in the off-licence retailing industry supply chain with direct employment of 20,766
    FTE jobs and indirect employment of 6,196 FTE jobs through their supply chain (excluding the
    brewing component).
    To put these estimates another way, for every direct full-time equivalent job in the Australian brewing
    industry, there are 26.8 FTE jobs required elsewhere in the Australian economy to produce and retail
    the beer (see Figure ES 1).

        ECONOMIC CONTRIBUTION OF THE AUSTRALIAN BREWING INDUSTRY 2017-18 FROM PRODUCERS TO                 i
                                                                                CONSUMERS
FIGURE ES 1 AUSTRALIAN EMPLOYMENT ASSOCIATED WITH DOMESTICALLY BREWED AND RETAILED BEER (2017-18)
A. Total employment contribution
B. Contribution per direct brewing industry employee
SOURCE: ACIL ALLEN
ECONOMIC CONTRIBUTION OF THE AUSTRALIAN BREWING INDUSTRY 2017-18 FROM PRODUCERS TO ii
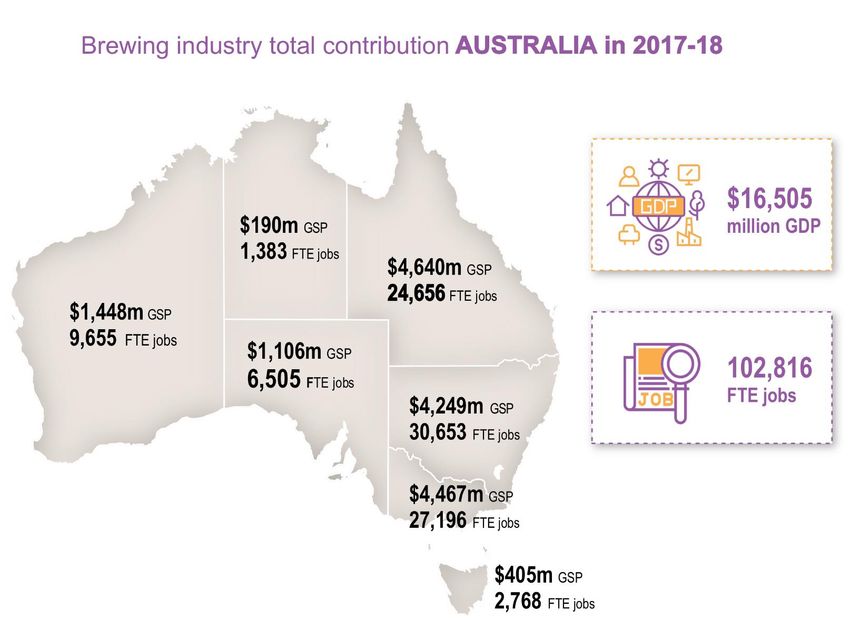
CONSUMERSSimilarly, based on a 425ml schooner size and the average container size of packaged beer, it is
estimated that every Australian made beer sold on licensed premises contributed $6.46 to Australia’s
GDP while every beer sold off licensed premises contributed $2.72.
As per Figure ES 2, on average, every Australian made beer sold domestically contributed $4.07 to
Australia’s GDP, comprising:
— $0.04 in the agriculture and processed agriculture inputs for the brewing industry
— $0.14 from the packaging materials industry inputs for the brewing industry
— $0.15 from other supply chain areas inputs for the brewing industry
— $1.13 by the beer manufacturing stage
— $1.13 from pubs, clubs, cafes and restaurants to sell the beer
— $0.62 from all other retailers to sell the beer
— $0.86 from all other aspects of the retailers supply chains.
FIGURE ES 2 CONTRIBUTION TO AUSTRALIAN GDP FROM THE CONSUMPTION OF AUSTRALIAN BREWED BEERS (2017-18)
Note: The ‘average beer’ comprises an estimated volume weighted average container size of 370ml for packaged beer and an assumed 425ml schooner size for keg beers.
SOURCE: ACIL ALLEN
ECONOMIC CONTRIBUTION OF THE AUSTRALIAN BREWING INDUSTRY 2017-18 FROM PRODUCERS TO iii
CONSUMERSTaking into account the estimated shares of full-time versus part-time employment in the brewing
industry and the various supply chains it is estimated that the total number of people employed
supported by brewing industry was 141,195 in 2017-18, comprising:
― 13,675 people in the brewing industry supply chain
― 91,644 people in the on-licence retailing industry supply chain
― 35,876 people in the off-licence retailing industry supply chain.
State level brewing industry contribution
The total economic contribution of domestic brewing industry to the state economies are provided in
Table ES 1, Table ES 2 and Figure ES 4.
Of all the states, Queensland’s brewing industry and its supply chain are the largest, accounting for
nearly forty per cent of the total economic contribution of beer production to the Australian economy.
This is followed by the brewing industry in Victoria (29 per cent) and New South Wales (16 per cent).
The indirect economic contribution of beer production in states like Western Australia and the
Northern Territory, are noticeably smaller compared to their direct contribution because of the greater
share of intermediate inputs sourced from outside of their state.
In contrast to beer production, the economic contribution associated with retailing Australian produced
beers, more closely follows the population of each jurisdiction.
TABLE ES 1 ECONOMIC CONTRIBUTION OF THE AUSTRALIAN BREWING INDUSTRY, 2017-18
NSW/ACT Vic. Qld SA WA Tas. NT Australia
$ million $ million $ million $ million $ million $ million $ million $ million
Beer production 688 1,361 1,765 355 297 105 29 4,600
Beer producer’s supply chain 242 375 540 118 51 32 5 1,362
Beer production including
930 1,735 2,305 472 348 137 34 5,962
supply chain
On-licence retailing of
2,237 1,855 1,571 424 740 178 104 7,109
domestically produced beer
Off-licence retailing of
1,082 876 764 210 360 90 52 3,434
domestically produced beer
TOTAL CONTRIBUTION 4,249 4,467 4,640 1,106 1,448 405 190 16,505
Notes: Estimates of the economic contribution of retailing only includes the retailing of Australian produced beers. Totals may not add due to rounding.
SOURCE: ACIL ALLEN CONSULTING
Employment by beer manufacturing businesses
In terms of employment contribution, it is important to note that many Australian beer manufacturing
businesses employ people outside of direct manufacturing (including administration) activities. Many
craft breweries, for example, operate attached retailing venues. Consequently, total employment by
domestic brewers is greater than the estimated 3,700 FTE jobs specifically associated with beer
manufacturing. As shown in Figure ES 3, total employment by beer manufacturing businesses within
Australia is estimated to be 5,765 FTE jobs – approximately 59 per cent of which are employed by the
major brewers (Lion, AB InBev and Coopers).
ECONOMIC CONTRIBUTION OF THE AUSTRALIAN BREWING INDUSTRY 2017-18 FROM PRODUCERS TO iv
CONSUMERSFIGURE ES 3 EMPLOYMENT BY BEER MANUFACTURING BUSINESSES
7,000
1,147
6,000
5,000 918
2,390
4,000 1,243
3,000 2,457
2,000
3,375
1,000
FTE jobs
Manufacturing - Major Manufacturing - Other Retailing and venues - Retailing and venues - Total
brewers brewers Major brewers Other brewers
Major brewers Other brewers
Note: Major brewers comprise Lion, CUB and Coopers.
SOURCE: ACIL ALLEN CONSULTING
State level employment contribution
The estimated total employment supported by the brewing industry and its supply chain is provided in
Table ES 2. NSW/ACT’s brewing industry and its supply chain are the largest and contributes a third
of the Australian brewing industry employment contribution. This is followed by the brewing industry in
Victoria and Queensland.
Of all the states, Queensland’s brewing industry and its supply chain are the largest, accounting for
just over forty per cent of total employment embodied in beer production across Australia. This is
followed by the brewing industry in Victoria (29 per cent) and New South Wales (17 per cent).
In contrast to beer production, employment associated with retailing Australian produced beers, more
closely follows the population of each jurisdiction.
TABLE ES 2 EMPLOYMENT CONTRIBUTION OF THE AUSTRALIAN BREWING INDUSTRY, 2017-18
NSW/ACT Vic. Qld SA WA Tas. NT Australia
FTE jobs FTE jobs FTE jobs FTE jobs FTE jobs FTE jobs FTE jobs FTE jobs
Beer production 1,209 943 1,143 262 27 110 5 3,700
Beer producer’s supply chain 1,549 2,471 3,476 793 309 234 32 8,864
Beer production including
2,759 3,414 4,619 1,055 336 344 38 12,564
supply chain
On-licence retailing of
19,524 16,811 14,021 3,789 6,527 1,687 932 63,290
domestically produced beer
Off-licence retailing of
8,370 6,972 6,017 1,661 2,792 737 413 26,962
domestically produced beer
TOTAL CONTRIBUTION 30,653 27,196 24,656 6,505 9,655 2,768 1,383 102,816
Notes: Estimates of the economic contribution of retailing only includes the retailing of Australian produced beers. Totals may not add due to rounding.
SOURCE: ACIL ALLEN CONSULTING
ECONOMIC CONTRIBUTION OF THE AUSTRALIAN BREWING INDUSTRY 2017-18 FROM PRODUCERS TO v
CONSUMERSFIGURE ES 4 BREWING INDUSTRY TOTAL ECONOMIC CONTRIBUTION BY STATE (2017-18)
Note: NSW includes ACT.
SOURCE: ACIL ALLEN
ECONOMIC CONTRIBUTION OF THE AUSTRALIAN BREWING INDUSTRY 2017-18 FROM PRODUCERS TO vi
CONSUMERSGLOSSARY OF
TERMS
AAG Average Annual Growth
ABS Australian Bureau of Statistics
ABV Alcohol by volume
ATO Australian Taxation Office
Billion 1x10⁹ (or 1,000 million) as per the US convention
¢ Australian cents
CPI Consumer price index
FTE Full time equivalent
GDP Gross Domestic Product. Equivalent to economic output at the national level.
GST Goods and services tax
IO Input-output
l Litres
LAL Litres of pure alcohol
ml Millilitres (1,000ml = 1l)
ECONOMIC CONTRIBUTION OF THE AUSTRALIAN BREWING INDUSTRY 2017-18 FROM PRODUCERS TO vii
CONSUMERS1 BEER INDUSTRY
OVERVIEW Beer industry over view
1
1.1 Introduction
This report presents the economic footprint of the brewing industry to the Australian state and national
economies in the 2017-18 financial year. More specifically, it describes the full production chain from
the production of raw materials such as grain, hops and sugar, to the domestic brewing industry
through to the retail sales of domestically produced beer (both on-premises and off-premises).
The analysis does not consider any potential social costs or benefits, nor does it consider any indirect
implications on other industries beyond the direct purchasing chain.
ACIL Allen has previously estimated the economic contribution of the Australian brewing industry for
the 2011-12 and 2015-16 financial years. This report provides Australian state level economic and
employment contributions of the Australian brewing industry for the 2017-18 financial year.
At the time of this analysis, the ABS — Apparent Consumption of Alcohol, Australia 2017-18 data was
yet to be released, and is not expected until September 2019. ACIL Allen has therefore estimated the
total consumption of beer in 2017-18, relying on ATO 2017-18 excise data and other published data
sources.
The state level analysis considers key important relationships in the brewing supply chain, including:
— where beer manufacturing occurs and the relative production costs
— where manufacturers source their intermediate inputs
— where consumption occurs and the relative retail prices.
The estimates provide the economic footprint of the Australian brewing industry to the Australian GDP
and State GSPs. It includes the direct contribution made by the industry and its’ contribution embodied
in its supply chain.
1.2 Recent trends
There have been some significant changes in the Australian beer market since 2011-12.
Per capita beer consumption has continued to decline faster than population growth resulting in total
beer consumption falling from 1.76 billion litres in 2011-12 to approximately 1.69 billion litres in 2017-
18, at annual average decline of 0.7 per cent.
In percentage change terms, over the past six years consumption of low strength beers has fallen the
fastest (–54.7 per cent) continuing a long running trend. Consumption of full-strength beers declined
by –15.4 per cent while consumption of mid strength beers increased by +22.9 per cent (Figure 1.1).
Both keg and packaged low- and mid- strength beers experienced similar percentage changes in
volumes, but packaged full strength beers suffered most of the decline in consumption within the full-
ECONOMIC CONTRIBUTION OF THE AUSTRALIAN BREWING INDUSTRY 2017-18 FROM PRODUCERS TO 1
CONSUMERSstrength category. Although category shifting by consumers towards cider is part of the reason for the
changes in beer volumes, there has also been an overall decline in alcohol consumption per person.
Within beer, the movement toward more expensive craft and premium beers within the full-strength
category is probably also a significant factor in affecting total volumes.
FIGURE 1.1 AUSTRALIAN BEER CONSUMPTION BY CATEGORY, 2011-12, 2015-16 AND 2017-18
1,600
1,400 1,352 1,322
1,240
1,200
1,000
800
600
381
400 350
297
200
113
71 68
ML
2011-12 Packaged 2011-12 Keg 2015-16 Packaged 2015-16 Keg 2017-18 Packaged 2017-18 Keg
Note: Keg beer is beer sold in containers exceeding 48 litres.
SOURCE: ACIL ALLEN BASED ON ATO (2018) BEER CLEARENCE SUMMARY DATA
Figure 1.2 summarises the components of the value chain for domestically brewed and sold beer on a
dollar per litre basis in 2017-18, while Figure 1.3 presents the approximate cost structure for an
indicative carton of full strength beer. In 2017-18, the Australia brewing industry is estimated to have
brewed and sold beer into the domestic market with retail sales value of $17.6 billion.
FIGURE 1.2 COMPONENTS OF AVERAGE RETAIL PRICE OF AUSTRALIAN PRODUCED AND CONSUMED BEER, 2017-18
14.0
1.16 12.81
7.21
12.0
10.0
8.0
6.0
1.46
4.0
1.72
2.0 0.48
0.40 0.19
0.18
$/litre
Ingredients Materials and Freight Marketing Brewery Excise Retailing GST Average retail
packaging and other Capital and margins price
Wages
Note: EBITDA = earnings before interest, tax depreciation and amortisation.
SOURCE: ACIL ALLEN
ECONOMIC CONTRIBUTION OF THE AUSTRALIAN BREWING INDUSTRY 2017-18 FROM PRODUCERS TO 2
CONSUMERSFIGURE 1.3 INDICATIVE COST STRUCTURE OF A CARTON OF FULL-STRENGTH BEER
Note: Calculations based on a 24-bottle carton of 375ml bottles of 4.9% LAL beer costing $51.
SOURCE: ACIL ALLEN
Total beer consumption in Australia in 2017-18 is estimated to have been 1,690 million litres
(Figure 1.4).
Data on domestic beer production is not provided by the Australian Bureau of Statistics (ABS) but
based on excise data from the Australian Tax Office (ATO) and production reports from the major
brewers, domestic breweries were the major source of beer, producing an estimated 1,342 million
litres. Home brewing produced an estimated 37 million litres and craft brewers produced an estimated
58 million litres.
Beer exports in 2017-18 were approximately 22 million litres (ABS 2018 special data request). By
implication, imports in 2017-18 are estimated to have been 275 million litres. These statistics highlight
the fact that beer production is principally a domestic industry serving domestic consumers even
though imports of beer have been rising rapidly in recent years.
ECONOMIC CONTRIBUTION OF THE AUSTRALIAN BREWING INDUSTRY 2017-18 FROM PRODUCERS TO 3
CONSUMERSFIGURE 1.4 AUSTRALIAN PRODUCTION AND APPARENT CONSUMPTION OF BEER, 2017-18
SOURCE: ACIL ALLEN BASED ON VARIOUS DATA SOURCES
In 2017-18 approximately 61 per cent of beer volume and 52 per cent of beer by wholesale value was
sold through off-licence retail stores. Bars and clubs are the next largest sales channel, estimated to
have sold approximately 28 per cent of beer by volume, representing 37 per cent by wholesale value
(Figure 1.5).
FIGURE 1.5 SHARE OF VOLUME AND VALUE OF BEER CONSUMPTION BY SALES CHANNEL,
2017-18
100%
90%
80%
70%
60% Home brew
50% Cafes and restaurants
Bars and clubs
40%
Off-licence retailers
30%
20%
10%
0%
Volume Wholesale value Retail value
Note: Wholesale value is inclusive of beer excise. The estimated share of wholesale value for bars and clubs is lower than their share of volume. This is
principally due to the lower cost of keg beer compared to packaged beer.
SOURCE: ACIL ALLEN
ECONOMIC CONTRIBUTION OF THE AUSTRALIAN BREWING INDUSTRY 2017-18 FROM PRODUCERS TO 4
CONSUMERS2 MEASURING
ECONOMIC
CONTRIBUTION Measuring economic contr ibution
2
As per the methodology used in previous reports, ACIL Allen has used input-output multiplier analysis
to estimate the economic footprint (economic contribution) of the Australian brewing and beer retail
industry. This is a methodology that is frequently used to understand the full linkages of an industry
throughout the economy. The economic footprint analysis describes:
— the direct contributions the Australian brewing industry makes to the economies of each state and to
Australia as a whole, plus
— the full extent of the indirect contributions the brewing industry makes to each economy through their
demand for intermediate inputs from other industries (feed, packaging materials, electricity,
machinery, freight etc.) as well as through demand stimulated by the wages and salaries of
employees.
For this analysis, the estimates of the economic footprint of the Australian brewing industry have been
estimated using what are known as ‘Simple Multipliers’. Consequently, the estimates in this report
include the direct contribution made by the industry to Australia’s GDP and employment along with the
contribution embodied in the industry’s supply chain. They do not include what is referred to as the
‘Consumption-induced effect’. That is, they do not include the economic effects associated with
workers within the industry (or its supply chain) spending their after-tax incomes on other Australian
goods and services (such as hairdressers, travel, retail trade etc.).
Estimates of the brewing industry from ‘Simple Multipliers’ are additive with the same estimates for
other non-overlapping industries (such as beef, milk, petroleum, aluminium, etc.) and will never add to
more than Australia’s total GDP or employment. While these estimates of the industry footprint are
useful for many contexts, they are a conservative estimate of the total economic activity or
employment that could be affected by a change in the industry. 1
More details of direct and indirect contribution (footprint) analysis are provided below.
2.1 Direct economic contribution
The standard measure of economic contribution is the extent to which it increases the value of goods
and services generated by the economy as a whole – in other words, the extent to which it increases
economic activity as measured by gross domestic product (GDP).
An economy has a range of factors of production (including labour and capital stock) and access to
various intermediate inputs. By using the factors of production appropriately industries are able to add
value to intermediate inputs by converting them into a range of goods and services more suited for
1 In particular, it is important to avoid double counting related to the intra-sectoral purchases and vertical supply chain activities. For
example, when adding the impact of related industries (where industry A supplies to industry B, for example) it is necessary to not include
the value of A’s sales to B when calculating industry B’s contribution. In reality, ensuring that industries are completely non-overlapping is
complex and certain simplifying assumptions would generally need to be made.
ECONOMIC CONTRIBUTION OF THE AUSTRALIAN BREWING INDUSTRY 2017-18 FROM PRODUCERS TO 5
CONSUMERSuse by consumers or other industries. An industry or business’ contribution to GDP measures the total
value added generated and is defined as the income that an industry or business generates, less the
cost of the inputs that it uses to generate that income, plus certain taxes paid. The direct contribution
of an industry or a company to the Australian economy can therefore be estimated by determining
their payments to the factors of production plus the taxes (less subsidies) payable on production and
imports. The direct economic contribution is shown graphically in Figure 2.1.
Box 2.1 provides a summary of the definitions used by the ABS as part of the System of National
Accounts 1993 (SNA93).
2.2 Indirect economic contribution
The intermediate inputs used by beer manufacturing industry can be sourced either from within the
Australian economy or from foreign economies. If purchased from within the Australian economy, then
the portion of value added embodied in the intermediate input is indirectly associated with the activity
of the purchaser. The calculation of the indirect contribution quickly becomes difficult as one considers
that value-added embodied in the intermediate inputs of the intermediate input. For example, to
manufacture beer, consider the malting of barley grains, fertiliser used in farming the barley, the
feedstock used in the fertiliser manufacturing, and so on.
FIGURE 2.1 CALCULATION OF DIRECT VALUE ADDED
Total sales
Direct
Intermediate inputs
Value added
Compensation to
Taxes payable on
employees EBITDA (payments
production and
(payments to to capital)
imports
labour)
Note: EBITDA is equivalent to the SNA93 definition of gross operating surplus
SOURCE: ACIL ALLEN CONSULTING
ECONOMIC CONTRIBUTION OF THE AUSTRALIAN BREWING INDUSTRY 2017-18 FROM PRODUCERS TO 6
CONSUMERSBOX 2.1 ABS DEFNITIONS OF VALUE-ADDED
An industry’s direct contribution to Gross Domestic Product or Gross State Product is well defined under the
standard national accounting framework used by the Australian Bureau of Statistics (ABS), which is known as
the System of National Accounts 1993 (SNA93). SNA93 recognises three different measures of value added:
a) Value added at Purchasers’ Prices. This is defined as output valued at purchasers’ prices, less
intermediate consumption valued at producer prices. This measure is equivalent to the traditional
measure of value added at market prices.
b) Value added at Basic Prices. In this measure, the output is valued at basic prices while intermediate
consumption is valued at producer prices. In the case of beer production this measure excludes beer
excise as they are viewed as production taxes levied on output.
c) Value added at factor Cost. This measure excludes all production taxes net of subsidies. In other words, it
excludes all production taxes – such as payroll taxes, fringe benefit taxes etc – and not just those that are
levied on output.
The measure of value added to be used depends on the nature of the analysis that is to be conducted. When
presenting an industry view of GDP for example, the ABS uses value added at basic prices and adds an
aggregate estimate of net taxes on products in question to give a total measure of GDP at purchasers’ prices
(ABS 1999).
Given the significance of beer excises for the Australian brewing industry, it is appropriate to use GDP at
purchasers’ prices when determining their economic contribution.
SOURCE: ACIL ALLEN CONSULTING
In a global context, the value-added chain can simply be measured by the value of the final goods and
services consumed. In a national context, input-output tables and the associated ‘input-output
multipliers’ can be used to estimate the indirect economic contributions. Input-output multipliers are
summary measures generated from input-output tables that can be used for predicting the total impact
on all industries in the economy of changes in demand for the output of any one industry. The tables
and multipliers can also be used to measure the relative importance of the production chain linkages
to different parts of the economy.
It should be noted that some of the assumptions underpinning input-output multipliers can be an
impediment to credible analysis. Understanding these assumptions is necessary to prevent the
inappropriate application of input-output multipliers – for example, in situations where economic
constraints are present or when the profile of a business or project differs substantially from the
industry average. We do not consider that these conditions apply for the purpose of this analysis and
that the use of input-output multipliers to estimate the economic footprint of the brewing industry is
appropriate. Further information on input-output tables and the calculation of multipliers can be found
in ABS Catalogue number 5246.0.2
2.3 Data sources
There are a range of publicly available estimates of the size and characteristics of the Australian
brewing industry. Unfortunately, there are often inconsistencies between the various estimates and it
was necessary for ACIL Allen to choose between different sources to undertake the analysis for this
report. Core data at the national level included:
— Australian Tax Office Taxation Statistics (principally the 2017-18 excise payment data3 and Beer
clearance summary data for financial years including 2017-18)4 were used as the primary data source
2 ABS 1995, Information Paper, Australian National Accounts: Introduction to Input-Output Multipliers, 1989-90, Cat No: 5246.
http://www.abs.gov.au/AUSSTATS/abs@.nsf/DetailsPage/5246.01989-90?OpenDocument
3 ATO (2018), Taxation Statistics 2016-17, Excise Table 2. https://data.gov.au/dataset/taxation-statistics-2013-14/resource/febefad7-5398-
4a73-8691-4993dd36aa12?inner_span=True
4 ATO (2018), Excise beer clearance data, https://www.ato.gov.au/about-ato/research-and-statistics/in-detail/general-statistics/excise-beer-
clearance-data/
ECONOMIC CONTRIBUTION OF THE AUSTRALIAN BREWING INDUSTRY 2017-18 FROM PRODUCERS TO 7
CONSUMERSfor excise payments by domestic breweries. The ATO data is in litres of alcohol by the excise category
— low strength, mid strength or full strength and whether packaged or keg beer.
— ABS Apparent Consumption of Alcohol (catalogue number 4307.0)5 was used as the primary data
source for the volume of total beer consumption (i.e. in million litres). The latest publication provides
the data only for 2016-17. ACIL Allen has estimated the volume of beer consumption for 2017-18
based on ATO data and previous years data provided by ABS.
— A special data request from the ABS on the volume of beer imports and exports in 2017-18 were
obtained. It has both volume and value data.
— Combining the ATO excise data with the average alcohol concentration by beer category assumed by
the ABS allows the volume of domestically produced beer sold domestically to be estimated at the
national level.
— Retail prices estimates by category (light, mid strength, regular and premium packaged and keg
beers) have been taken from ACIL Allen’s own databases used for previous modelling but which have
been updated for this analysis.6
Within the parameters set by the above national level information, a range of additional data sources
were used to understand the production cost structure along with the locations of consumption at the
state level. These are described in more detail in the following sections.
2.3.1 Production, production costs and intermediate inputs
On the production side, expenses on major cost items and gross value added were supplied
confidentially by major Australian brewers (some of which are also in the public domain). These
brewers account for just under 95 per cent of the Australian brewing industry by volume. The data
provided included:
— volume and value of production by state
— brewery COGS by state
— other beer operations expenses by state (such as head office costs, for example)
— the source of any intermediate inputs, particularly if sourced from interstate.
The major producers also provided employment and wages data on their production facilities and
other locations in each state. This data is supplemented with the 2016 Census information on beer
manufacturing employment by state. The information on cost items was supplemented with detailed
information from the ABS Australian National Accounts: Input-Output Tables (catalogue number
5209.0.55.001), ABS Australian Industry (catalogue number 8155.0), IBISWorld (Industry reports
C1212, C2182 and H4520) and other publicly available information. Major brewers by state are
provided in Table 2.1.
TABLE 2.1 MAJOR BREWERS BY STATE, 2017-18
Owner Name Main beers State Location
Lion Malt Shovel Hahn Premium, Hahn Super Dry, Hahn Super Dry NSW Camperdown, Sydney
3.5, Hahn Premium Light, Hahn White, Hahn
Harvest
Tooheys Tooheys New, Tooheys Darling Pale Ale, Tooheys NSW Lidcombe, Sydney
Old, Tooheys Extra Dry
Castlemaine Perkins XXXX Bitter, XXXX Gold, XXXX Light, XXX Summer Qld Milton, Brisbane
Bright Lager
South Australian Brewing West End Draught, Southwark Bitter SA Thebarton, Adelaide
Little Creatures Little Creatures WA and Vic. Freemantle and Geelong
J.Boag & Sons James Boag's Premium, Boag's Draught Tas. Launceston
5 ABS (2016) Apparent Consumption of Alcohol, Australia 2013-14,
http://www.abs.gov.au/AUSSTATS/abs@.nsf/DetailsPage/4307.0.55.0012013-14?OpenDocument
6 Fogarty, J.J. and G. Jakeman 2011, “Wine tax reform: The Impact of Introducing a Volumetric Excise Tax for Wine”, Australian Economic
Review, Vol. 44, No. 4, pp. 387-403.
ECONOMIC CONTRIBUTION OF THE AUSTRALIAN BREWING INDUSTRY 2017-18 FROM PRODUCERS TO 8
CONSUMERSOwner Name Main beers State Location
AB InBev Carlton & United Victoria Bitter, Crown Lager, Carlton Draught, Pure Vic. Abbotsford, Melbourne
Breweries Blonde, Reschs Pilsener, Great Northern Brewing
Co.
Qld Yatala, Gold Coast
Cascade Brewery Cascade Premium Lager, Cascade Light, Mercury Tas. Hobart
Cider
4 Pines Brewing 4 Pines NSW Sydney
Pirate Life Brewing Pirate Life SA Adelaide
Cooper Coopers Brewery Sparkling Ale, Original Pale Ale, Best Extra Stout, SA Regency Park, Adelaide
Family Dark Ale, Mild Ale, Carlsberg
SOURCE: VARIOUS
The estimated beer production by state are provided in Table 2.2. Queensland is a major state both in
terms of volume and value of beer production in Australia in 2017-18. This is followed by Victoria and
NSW/ACT.
TABLE 2.2 ESTIMATED BEER PRODUCTION BY STATE, 2017-18
NSW/ACT Vic. Qld SA WA Tas. NT Australia
Volume of production (ML) 267.8 371.4 565.1 171.7 17.6 42.8 1.0 1,437
Value of production ($ million) 617 1,150 1,497 320 237 101 24 3,946
SOURCE: ACIL ALLEN ESTIMATES BASED ON VARIOUS DATA SOURCES
2.3.2 Consumption and retail prices
Understanding the consumption by state is more complicated. Major beer manufacturers do not have
any strong way of understanding where their products are sold (particularly for bulk sales through the
major retail chains) and the ABS only provides data on apparent consumption at the national level and
does not estimate consumption by demography characteristics such as state/territory, region, sex or
country of birth.
ACIL Allen explored a range of possible sources of beer consumption by state. For this study, the
estimates of beer consumption by state were estimated using the ABS Consumer Price Index (17th
Series Weighting Pattern, 2017, Cat No: 6473.0), which provides the weekly household expenditure
on beers by major capital cities. This is the latest data that is available that provides indicative beer
consumption by state. This data has been forecasted using the beer CPI data and combined with the
national apparent consumption of alcohol in 2017-18 to estimate the household consumption of beer
by state. This is consistent with the aggregate data that we have estimated from the ABS Apparent
Consumption of Alcohol data at the national level.
The estimated total beer consumption by state is provided in Table 2.3. NSW/ACT is a major
consumer both in terms of volume and expenditure in Australia in 2017-18. This is followed by Victoria
and Queensland. However, in terms of per capita consumption, NT is the highest per capita consumer
followed by Tasmania and Queensland.
TABLE 2.3 ESTIMATED BEER CONSUMPTION BY STATE, 2017-18
NSW/ACT Vic. Qld SA WA Tas. NT Australia
Volume of consumption (ML) 435 370 313 85 153 38 21 1,415
Household expenditure ($
4,925 4,185 3,537 959 1,729 434 243 16,013
million)
Per capita consumption
63.6 70.3 77.5 59.0 72.7 87.9 110.0 69.7
(litres/Population 15+)
SOURCE: ACIL ALLEN ESTIMATES BASED ON VARIOUS DATA SOURCES
ECONOMIC CONTRIBUTION OF THE AUSTRALIAN BREWING INDUSTRY 2017-18 FROM PRODUCERS TO 9
CONSUMERSA summary of data sources used to estimate the state contribution are provided in Table 2.4.
TABLE 2.4 DATA SOURCES
Data item Source Details and comments
Beer production data
Beer production at national Unpublished data from main brewers Major brewers provided data on volume of beer production in
level – volume ATO beer clearance data litres for the financial year 2017-18
Beer production at national Unpublished data from main brewers Major brewers provided data on revenue, employment (full-time,
level – value IBISWorld Report part time and casual), wages and operating expenses and profits
ABS Input-output tables for the financial year 2017-18.
ABS Australian Industry IBISWorld Report provided data on revenue, industry gross value-
added, employment, wages, exports, imports and domestic
demand. It also provided major cost categories – profit,
depreciation, advertising expenses, R&D, administrative and legal
expenses, freight costs, packaging, malt, refined sugar, hops etc.
It also provided market, product and services segmentation.
ABS 2015-16 input-output tables is a recent publication on beer
manufacturing industry cost structure and beer sales pattern at
national level.
ABS Australian industry has 2016-17 data on revenue, wages
and employment at national level.
Beer production at state Unpublished data from main brewers Major brewers provided data on volume of beer production in
level – volume litres by their production facilities in each state.
Beer production at state Unpublished data from main brewers Major brewers provided data on value of beer production by their
level – value production facilities in each state.
Beer consumption data
Household expenditure on ABS Household Expenditure Survey, Average weekly household expenditure by state in 2009-10 is
beer 2009-10 updated with the beer CPI in each state to obtain household
expenditure on beer for the 2015-16 financial year. A key
limitation of this data is the base year is 2009-10.
ABS State Accounts, Cat No: 5206.0 Information on final consumption expenditure on alcohol
beverages is available but not reported separately for the beer.
ABS Consumer Price Index, 17th Average weekly household expenditure by state in September
Series Weighing Pattern, 2017, 2017 is forecasted with the beer CPI in each state to obtain
Cat No: 6473.0 household expenditure on beer for the 2017-18 financial year.
SOURCE: VARIOUS SOURCES
A container deposit scheme was implemented in New South Wales in December 2017 and in
Queensland in November 2018. The scheme will be implemented in Western Australia by 2020. The
container deposit schemes in all states are broadly based on the South Australian model. Unlike in
South Australia, however, participating New South Wales brewers must pay the container deposit levy
prior to sales they make, rather than based on actual redemptions. Bottles and cans must be returned
undamaged and the barcode must be able to be read whereas in South Australia, the only
requirements is that the refund statement be clearly visible. This has had some impact on the retail
prices and, as a result, is likely to have impacted on consumption of beer in 2017-18.
ECONOMIC CONTRIBUTION OF THE AUSTRALIAN BREWING INDUSTRY 2017-18 FROM PRODUCERS TO 10
CONSUMERS3 BEER
PRODUCTION BY
STATE Beer production by state
3
3.1 Direct economic contribution
According to the Australian Taxation Office (ATO)7, the domestic brewing industry sold 44.6 million
litres of excisable alcohol to domestic consumers, 10.4 million litres of which was keg sales with the
remainder packaged beer sales.
In total, these sales raised an estimated $2,008.6 million in excise payments in 2017-18.
In 2017-18, the direct economic contribution of the Australian beer production industry at the national
level is estimated to have been $4,816.4 million, comprising:
— $2,607 million of gross value add comprising wages and salaries and pre-tax returns to capital
(EBITDA)
— $2,209.5 million of taxes on domestic beer sales (comprising $2,008.6 million of alcohol excise and
$200.9 million GST payable on the excise).
Australia’s gross domestic product (GDP) in 2017-18 was $1,848 billion8 implying that the direct
economic contribution of the brewing industry accounted for 0.26 per cent (or one-400th) of Australia’s
total economic output.
The estimated direct economic contribution of the Australian brewing industry at the state level is
provided in Table 3.1.
TABLE 3.1 DIRECT ECONOMIC CONTRIBUTION: BEER PRODUCTION, 2017-18
NSW/ACT Vic. Qld SA WA Tas. NT Australia
$ million $ million $ million $ million $ million $ million $ million $ million
Gross value add: Wages and
salaries and Returns to 352.5 705.8 923.6 175.2 168.3 48.8 16.4 2,391
capital
Excise a 304.8 595.3 764.9 163.0 117.4 51.5 11.7 2,009
GST on excise 30.5 59.5 76.5 16.3 11.7 5.1 1.2 201
Direct contribution 687.7 1,360.6 1,764.9 354.5 297.4 105.4 29.4 4,600
Per cent of GSP/GDP 0.11% 0.32% 0.51% 0.33% 0.11% 0.34% 0.11% 0.25%
a This is only excise on domestically produced beer and is exclusive of customs taxes on imported beer.
SOURCE: ACIL ALLEN
7 ATO Australian Taxation Statistics, Beer products subject to excise, 2017-18 financial year.
8 ABS catalogue 5220.0 Australian National Accounts: State Accounts, Table 1, issued 16 November 2018.
ECONOMIC CONTRIBUTION OF THE AUSTRALIAN BREWING INDUSTRY 2017-18 FROM PRODUCERS TO 11
CONSUMERS3.2 Indirect economic contribution (supply chain)
3.2.1 Value-add contribution
The direct contribution of an activity in terms of value added is confined to the initial or first round
impacts on the activity. In turn, each of these first-round impacts subsequently leads to further rounds
of impacts. For example, the businesses that sell goods and services to the Australian brewing
industry need to employ people and capital and to purchase intermediate goods and services from
other businesses. In turn, each of these transactions would generate a third round of impacts.
A simple estimate of the value added associated with the Australian brewing industry’s inputs is the
value of the intermediate inputs sourced from domestic suppliers. However, this does not recognise
the fact that the supplier to the Australian brewing industry may have a large share of foreign
components. Consequently, the appropriate measure of the indirect value added needs to exclude all
foreign products used in any part of the product chain of the industry’s intermediate input suppliers. As
discussed in Section 2.2, this information is embodied in input output tables of the Australian economy
and the indirect economic contribution can be measured using the relevant multipliers. Based on
information from the ABS, ACIL Allen has developed (and regularly updates) detailed input output
tables for Australia and each State and Territory (along with various regional areas, when necessary).
From these tables, ACIL Allen has calculated a range of multipliers to facilitate economic analysis.
For this analysis, ACIL Allen have estimated a detailed input cost structure based on publicly available
and confidential data provided by the major brewers in conjunction with the ABS detailed input-output
tables of the Australian brewing industry.9
In total it is estimated that the Australian brewing industry spent $1,742 million on intermediate goods
and services in 2017-18. This comprised:
— $246 million on ingredients
— $562 million on materials and packaging
— $271 million on transportation and freight
— $472 million on marketing and selling
— $191 million on administration and other expenses.
A more detailed breakdown of production costs is presented in Figure 3.1.
Allocating the Australian intermediate inputs to their respective industries, accounting for margins and
applying the appropriate simple multipliers for the Australian value added and employment it is
possible to estimate the total Australian value added and employment embodied in the Australian
produced intermediate inputs consumed by Australian brewing industry.
In total, it is estimated that the Australian value added embodied in the Australian inputs used by the
industry in 2017-18 was $1,362 million. The estimated indirect economic contribution of the brewing
industry at the state level is provided in Table 3.2.
TABLE 3.2 SUPPLY CHAIN ECONOMIC CONTRIBUTION: BEER PRODUCTION, 2017-18
NSW/ACT Vic. Qld SA WA Tas. NT Australia
$ million $ million $ million $ million $ million $ million $ million $ million
Indirect contribution 242.2 374.7 540.2 118.0 50.9 31.6 4.8 1,362
Per cent of GSP/GDP 0.04% 0.09% 0.15% 0.11% 0.02% 0.10% 0.02% 0.07%
SOURCE: ACIL ALLEN
9 ABS catalogue number 5209.0.55.001, Australian National Accounts: Input-Output Tables 2015-16, released 15 June 2018.
ECONOMIC CONTRIBUTION OF THE AUSTRALIAN BREWING INDUSTRY 2017-18 FROM PRODUCERS TO 12
CONSUMERSFIGURE 3.1 MAP OF THE PRODUCTION COSTS OF AUSTRALIAN COMMERCIAL BREWING INDUSTRY, 2017-18
Note: GST estimate excludes exported products.
SOURCE: ACIL ALLEN
3.2.2 Employment contribution
An estimated 8,864 FTE people are employed indirectly due to the presence of brewing industry in
Australia. Of the employment in the brewing industry supply chain:
— 1,342 are in agriculture (including processing) implying 0.36 jobs per direct brewing industry job
— 3,272 jobs are in packaging materials, implying 0.88 jobs per direct brewing industry job
— 4,249 jobs are in other supply chain areas, implying 1.15 jobs per direct brewing industry job.
It should be noted that the estimation method excludes all foreign products used in any part of the
product chain and consequently does not include any value added associated with Australian
components used in imported products. This component is not deemed to be of significance for the
current analysis. The total number of people employed in the Brewing industry’s supply chain was
estimated by assuming the 2017-18 shares of full-time versus part-time employment in each industry
was the same as the latest ABS10 detailed estimates. On average, 83.2 per cent of people employed
in the supply chain were full time implying the total number of people employed in 2017-18 was 9,648,
comprising:
— 1,441 employees in agriculture
— 3,280 employees in packaging materials
— 4,928 employees in other supply chain areas.
The estimated direct and indirect employment associated with the Australian production of beers at
the state level is provided in Table 3.3.
10 Table 20 from ABS catalogue number 5209.0.55.001 for 2012-13.
ECONOMIC CONTRIBUTION OF THE AUSTRALIAN BREWING INDUSTRY 2017-18 FROM PRODUCERS TO 13
CONSUMERSTABLE 3.3 DIRECT AND INDIRECT EMPLOYMENT CONTRIBUTION: BEER PRODUCTION, 2017-18
NSW/ACT Vic. Qld SA WA Tas. NT Australia
Full Time Equivalent (FTE) jobs)
Beer production 1,209 943 1,143 262 27 110 5 3,700
Beer producer’s supply chain 1549 2471 3476 793 309 234 32 8,864
Number of people
Beer production 1,316 1,027 1,244 285 30 120 6 4,027
Beer producer’s supply chain 1,686 2,689 3,783 863 336 255 35 9,648
SOURCE: ACIL ALLEN
3.3 Wholesale prices
The estimated average wholesale prices of packaged and keg beer are presented in Figure 3.2 and
Figure 3.3. It is estimated that the average production cost of keg beer is approximately 20 per cent
cheaper than packaged beer. The principal reasons for the price difference are the lower excise costs
along with significantly lower packaging costs. As keg beer is sold through bars and clubs but not
through off-licence retailers, this price difference influences the final retailing costs between alternative
sales channels (discussed more in Chapter 4).
ECONOMIC CONTRIBUTION OF THE AUSTRALIAN BREWING INDUSTRY 2017-18 FROM PRODUCERS TO 14
CONSUMERSFIGURE 3.2 AVERAGE WHOLESALE PRICE OF AUSTRALIAN PRODUCED KEG AND PACKAGED BEER (PER LITRE), 2017-18
A. Packaged beer
B. Keg beer
Note: Keg beer is beer sold in containers exceeding 48 litres. Excludes exports.
SOURCE: ACIL ALLEN
ECONOMIC CONTRIBUTION OF THE AUSTRALIAN BREWING INDUSTRY 2017-18 FROM PRODUCERS TO 15
CONSUMERSFIGURE 3.3 AVERAGE WHOLESALE PRICE OF AUSTRALIAN PRODUCED KEG AND PACKAGED BEER, 2017-18
A. Packaged beer (average cost per 370ml bottle)
B. Keg beer (average cost per 425ml schooner)
Note: Keg beer is beer sold in containers exceeding 48 litres. Excludes exports.
SOURCE: ACIL ALLEN
ECONOMIC CONTRIBUTION OF THE AUSTRALIAN BREWING INDUSTRY 2017-18 FROM PRODUCERS TO 16
CONSUMERS4 BEER RETAILING
BY STATE Beer retailing by state
4
For the purpose of the analysis in this chapter, retailing has been divided into two categories:
— On-licence retailers
— Off-licence retailers.
On-licence retailers includes all pubs, clubs, bars, cafes and restaurants while off-licence retailers
comprise all other sales.
Brewery products sold for non-commercial purposes and home brew kits/products/inputs have been
excluded.
4.1 Retail prices
It is estimated that 1,378 million litres of commercially produced domestic beer was sold domestically
in 2017-18. Of this volume, 317 million litres were keg beer.
Data on the share of packaged beer sold through different sales channels was not provided by the
major brewers for this exercise and was not publicly available from the ABS or the ATO.
Consequently, the IBISWorld C2182 estimates of the share of wholesale sales by major market were
used as the basis for the analysis in this section. After adjusting for exports and malt, it is estimated
that 48 per cent of the wholesale value of production was sold through off-licence retailers in 2017-18
(as per Figure 1.5 in Section 1.2).
The share of packaged beer sold through different sales channels can be estimated by:
— taking ACIL Allen’s estimates of the average wholesale prices of keg and packaged beer (Figure 3.2)
— assuming that the entire volume of keg production is sold through licenced premises, and
— assuming that, on average, there are no special discounts to different sales channels.
Following these steps, it is estimated that 25 per cent of domestically brewed packaged beer was sold
through on-licence premises. Combining this estimate with ACIL Allen’s estimates of the average retail
prices of product sold through different sales channels (see Figure 4.1) allowed the retail value of
domestically brewed beer by sales channel to be estimated (see Figure 4.2).
As shown in Figure 4.2, the total estimated retail value of domestically brewed beer consumed within
Australia in 2017-18 was $17,654 million (excluding home brew). It should be noted that there are
some uncertainties around the volume of beer sold through alternative sales channels and the
average retail margins and this should be kept in mind when using this analysis.
ECONOMIC CONTRIBUTION OF THE AUSTRALIAN BREWING INDUSTRY 2017-18 FROM PRODUCERS TO 17
CONSUMERSFIGURE 4.1 AVERAGE RETAIL PRICES FOR KEG AND PACKAGED BEER BY SALES CHANNEL,
2017-18
20.0
18.0
16.0
14.0
12.0
10.0
8.0
6.0
4.0
2.0
$/litre
Keg beer Packaged beer Packaged beer Average - all beer
- on-licence - off-licence
Average wholesale price Retail margins GST
Source: ACIL Allen
FIGURE 4.2 VALUE OF DOMESTICALLY PRODUCED COMMERCIAL BEER SALES TO AUSTRALIAN
CONSUMERS BY SALES CHANNEL, 2017-18
20,000
18,000
16,000
14,000
12,000
10,000
8,000
6,000
4,000
2,000
A$m
Keg beer Packaged beer - on- Packaged beer - off- Total - all beer
licence licence
Wholesale value Retail margins GST
Source: ACIL Allen
ECONOMIC CONTRIBUTION OF THE AUSTRALIAN BREWING INDUSTRY 2017-18 FROM PRODUCERS TO 18
CONSUMERS4.2 Retail cost structure
The cost structure for the on-licence and off-licence retailers has been based on the cost structure of
the ABS input-output tables for Food and Beverage Services, and Retail Trade (which includes liquor
retailing), respectively. The retail cost structures for beer sales are summarised in Figure 4.3.
FIGURE 4.3 BASIC COST STRUCTURE OF RETAIL BEER BY SALES CHANNEL IN AUSTRALIA, 2017-
18
12,000
10,000
8,000
6,000
4,000
2,000
A$m
On-licence Off-licence
Beer Other inputs Retailing wages and salaries Retailing EBITDA GST
Source: ACIL Allen
4.3 Direct economic contribution
The estimated direct economic contribution (see Table 4.1) of domestically produced beer sold
through On-licence retail venues is $4,567 million, comprising:
— $2,318 million of wages and salaries, directly employing 46,819 FTE people
— $1,479 million of returns to capital
— $771 million of GST
NSW/ACT is a major state where On-licence retail venues directly contributed over $1.4 billion to the
NSW/ACT economy. Victoria and Queensland are two other major states for On-licence venues for
beer sales. In terms of per cent of state economic output, On-licence venues in Tasmania contributes
0.4 per cent of the state’s economic output, followed Queensland (0.3 per cent).
TABLE 4.1 DIRECT ECONOMIC CONTRIBUTION: ON-LICENCE RETAIL VENUES, 2017-18
NSW/ACT Vic. Qld SA WA Tas. NT Australia
$ million $ million $ million $ million $ million $ million $ million $ million
Wages and salaries 712.9 605.8 512.0 138.8 250.3 62.8 35.2 2,318
Returns to capital 454.8 386.5 326.7 88.6 159.7 40.1 22.5 1,479
GST 239.0 196.5 171.5 47.4 83.1 21.3 12.1 771
Direct contribution 1,406.7 1,188.8 1,010.1 274.8 493.2 124.1 69.8 4,567
Per cent of GSP/GDP 0.22% 0.28% 0.29% 0.26% 0.19% 0.40% 0.26% 0.25%
SOURCE: ACIL ALLEN
ECONOMIC CONTRIBUTION OF THE AUSTRALIAN BREWING INDUSTRY 2017-18 FROM PRODUCERS TO 19
CONSUMERSThe estimated direct economic contribution of domestically produced beer sold through Off-licence
retail venues is $2,506 million (see Table 4.2), comprising:
― $1,109 million of wages and salaries directly employing 20,766 FTE people
― $764 million of returns to capital
― $632 million of GST.
TABLE 4.2 DIRECT ECONOMIC CONTRIBUTION: OFF-LICENCE RETAIL VENUES, 2017-18
NSW/ACT Vic. Qld SA WA Tas. NT Australia
$ million $ million $ million $ million $ million $ million $ million $ million
Wages and salaries 343.9 282.7 246.6 68.2 119.6 30.6 17.4 1,109
Returns to capital 237.0 194.8 170.0 47.0 82.4 21.1 12.0 764
GST 196.1 161.2 140.6 38.9 68.2 17.5 9.9 632
Direct contribution 776.9 638.6 557.2 154.1 270.2 69.2 39.3 2,506
Per cent of GSP/GDP 0.13% 0.15% 0.16% 0.14% 0.10% 0.22% 0.15% 0.14%
SOURCE: ACIL ALLEN
4.4 Indirect economic contribution (supply chain)
As with the brewing industry, the retailing of beer also includes a significant amount of other inputs
thereby indirectly contributing to the Australian and state economies. Using the same approach as
Section 3.2, the indirect contribution of the non-beer related supply chain in 2017-18 is estimated to
have been:
— $2,527.4 million for on-licence sales of beer, indirectly employing approximately 16,376 FTE people
— $721.2 million for off-licence sales of beer, indirectly employing approximately 4,815 FTE people.
As mentioned above, in estimating the indirect employment, ACIL Allen have relied on retail cost
structures estimated from the ABS input-output tables, particularly the share of value-added that is
paid to employees versus returns to capital. As per Section 3.2, the total number of people employed
in the retail industry and its non-beer related supply chain was estimated by assuming the 2017-18
shares of full-time versus part-time employment in each industry was the same as the latest ABS11
detailed estimates. The Food and beverage and Retail trade sectors of the economy have a large
share of part-time workers, averaging 60 and 49 per cent, respectively, while their non-beer related
supply chains have a higher share of full-time employees (78.4 and 80.1 per cent, respectively). The
indirect contribution of On-licence and Off-licence venue sales of Australian produced beer to each of
the state economies are provided in Table 4.3.
TABLE 4.3 RETAILING SUPPLY CHAIN ECONOMIC CONTRIBUTION: ON-LICENCE AND OFF-LICENCE VENUES, 2017-18
NSW/ACT Vic. Qld SA WA Tas. NT Australia
On-licence supply chain
Indirect contribution ($ million) 830.5 666.5 561.3 149.0 246.8 54.0 33.8 2,542.0
Per cent of GSP/GDP 0.13% 0.15% 0.16% 0.14% 0.10% 0.18% 0.13% 0.14%
Off-licence supply chain
Indirect contribution ($ million) 304.8 237.7 206.5 56.1 89.7 20.5 12.8 928.0
Per cent of GSP/GDP 0.05% 0.06% 0.06% 0.05% 0.03% 0.07% 0.05% 0.05%
SOURCE: ACIL ALLEN
11 Table 20 from ABS catalogue number 5209.0.55.001 for 2012-13.
ECONOMIC CONTRIBUTION OF THE AUSTRALIAN BREWING INDUSTRY 2017-18 FROM PRODUCERS TO 20
CONSUMERSYou can also read