Meat - Food and Agriculture Organization of the United Nations
←
→
Page content transcription
If your browser does not render page correctly, please read the page content below
162
6. Meat
This chapter describes the market situation and highlights the medium-term
projections for world meat markets for the period 2020-29. Price,
production, consumption and trade developments for beef and veal,
pigmeat, poultry, and sheepmeat are discussed. The chapter concludes
with a discussion of important risks and uncertainties affecting world meat
markets during the coming ten years.
OECD-FAO AGRICULTURAL OUTLOOK 2020-2029 © OECD/FAO 2020 163 6.1. Market situation World meat production decreased to 325 Mt in 2019, primarily due to the impact of African Swine Fever (ASF) in the People’s Republic of China (hereafter “China”). The ASF outbreak also spread into a number of African, Central European, some East Asian countries – Democratic People’s Republic of Korea, Korea and Mongolia, and to some South-East Asian countries – Cambodia, Indonesia, Lao People’s Democratic Republic, Myanmar, The Philippines, Timor-Leste, and Viet Nam. China’s overall meat output is estimated to have fallen by 10% in 2019, reflecting a contraction of at least 21% in pigmeat production, which was partially offset by higher production volumes of other meats. However, increased meat production in Argentina, the European Union, Turkey, and the United States resulted in limiting the global decline of meat output to slightly less than 2% for 2019. In countries where meat output continues to rise, productivity gains are the main factor. In the United States, for example, increased carcass weights have sustained growth. In the European Union, total meat output is also expected to expand despite a decline in bovine meat production. EU production gains are projected for all other categories of meat, especially pigmeat, reflecting robust import demand from China. In Argentina, meat production rose primarily to meet increased foreign demand. Measured by the FAO Meat Price Index, average prices in 2019 were 5.6% higher than in 2018, with pigmeat, in particular frozen pigmeat, recording the sharpest rise due to China’s surge in import demand. Poultry and bovine meat prices also strengthened due to stronger Asian demand, while limited supplies from Oceania supported the continued strength of sheepmeat prices. Global meat exports increased to 36 Mt in 2019, up 4% from 2018. The bulk of this increase is attributed to increased imports by China due to ASF-related production losses. China’s overall meat imports increased by 62% (around 2 Mt) across all meat categories in 2019. On the export side, much of the expansion in global volumes came from Argentina, Canada, the European Union, Thailand, and the United States. 6.2. Projection highlights Nominal meat prices are expected to remain, similar to or increase above the base period (2017 to 2019 average) level (Figure 6.1). Over the first half of the projection period, prices will be supported by supply constraints in several Asian countries and the consequent increased import demand. This is relevant for the pigmeat sector, where ASF-related culling has decreased production in Asia. Higher prices will improve profitability in meat production during the first half of the projection period, despite a gradual increase in feed costs (Figure 6.2). When pigmeat supplies begin to return to their long-term trend growth, pigmeat prices will decline in real terms over the remainder of the projection period as productivity growth is assumed to continue. While ongoing economic and population growth in developing countries are the main drivers of meat consumption globally, the Outlook projects a levelling-off in per capita meat consumption with a shift towards a demand for quality products in high-income countries. The real prices (in 2019 USD) for beef and sheepmeat are projected to decrease the most by 2029, to USD 3 472/t and USD 3 926/t carcass weight equivalent (c.w.e.), respectively. In real terms, pigmeat and poultry prices are projected to decline to USD 1 323/t c.w.e. and USD 1 508/t product weight (p.w.), respectively. In nominal terms, all meat prices will increase modestly by 2029 (Figure 6.1). Sheepmeat prices are projected to remain high during the outlook period due to a combination of strong import demand from Asia and supply constraints in Oceania arising from a mixture of drought-induced flock reductions in Australia and a steady decrease in ewe breeding in New Zealand. OECD-FAO AGRICULTURAL OUTLOOK 2020-2029 © OECD/FAO 2020
164
Figure 6.1. World meat prices
Nominal price Real price (in constant 2019 USD)
USD/t USD/t
3000 6 000
2500 5 000
2000 4 000
1500 3 000
1000 2 000
500 1 000
0
1999
2004
2009
2014
2019
2024
2029
1999
2004
2009
2014
2019
2024
2029
1999
2004
2009
2014
2019
2024
2029
1999
2004
2009
2014
2019
2024
2029
Pork Poultry Beef (right axis) Sheep (right axis)
Note: US Barrows and gilts, National base 51-52% lean c.w.e. Brazil: Export unit value for chicken (f.o.b.) product weight. US Choice steers,
5-area Direct c.w.e., Total all grades. New Zealand lamb price c.w.e., all grade average.
Source: OECD/FAO (2020), “OECD-FAO Agricultural Outlook”, OECD Agriculture statistics (database),
http://dx.doi.org/10.1787/agr-outl-data-en.
StatLink 2https://doi.org/10.1787/888934142463
At the global level, this year’s Outlook projects that meat production and consumption levels will reach a
low point in 2020 as a consequence of the multiple outbreaks of AFS across Asia. In the early years of the
outlook period, the overall growth in global meat output will be impacted negatively by a decline in
availability of pigmeat, only partially offset by higher production volumes of other meat types.
Growth in consumption of meat over the next decade is projected to increase by 12% by 2029 when
compared to the base period. However, over the medium term, growth rates will decrease in response to
slower income growth in several regions, ageing populations, and a levelling off in per capita meat
consumption in high-income countries as a result of saturation and dietary preferences for higher quality
meats. In light of these factors, global consumption per capita is projected to increase to only 34.9 kg retail
weight equivalent (r.w.e.) by 2029, an increase of 0.5 kg r.w.e., slightly more than 1%, compared to the
base period. Virtually all of this increase per capita is attributed to higher consumption of poultry meat.
The global expansion in meat supply is expected to increase by 40 Mt c.w.e. by 2029, when compared to
the base period. Over the course of the outlook period, a combination of herd and flock expansion in the
Americas and the European Union regions as well as increased productivity will support a supply-driven
market. Developing countries are projected to account for most of the total increase in production, poultry
meat remains the primary driver of growth in total meat production. Pigmeat output will remain subdued in
the first five years of the outlook period due to the ASF outbreaks, in China and Viet Nam in particular.
The share of traded meat at the global level is expected to increase at the start of the outlook period to
supply the Chinese market. For the medium term, the share of traded meat is projected to increase to meet
the growing demand from low-income countries, particularly in the least developed countries (LDCs) in
Africa, Asia and the Middle East, where national production will remain insufficient to meet demand. The
recent ratification by 28 countries (as of December 2019) of the African Continental Free Trade Agreement
is also expected to encourage more trade within Africa once the Agreement enters into force in July 2020.
Animal disease outbreaks, sanitary restrictions, and trade policies will remain the main factors that drive
the evolution and dynamics in world meat markets. Uncertainties related to existing or future trade
agreements over the outlook period (e.g. the United Kingdom’s exit from the European Union) could
OECD-FAO AGRICULTURAL OUTLOOK 2020-2029 © OECD/FAO 2020 165
change meat trade patterns. In the short term, the magnitude and duration of the impact of the current
outbreak of COVID-19 is uncertain but meat production (including both slaughtering and processing) and
consumption patterns, especially those of food services, are expected to be affected. Other factors that
could influence the meat outlook over the medium term include changing consumer preferences and
attitudes towards meat consumption in view of its impact on health, the environment, animal welfare, and
global greenhouse gas (GHG) emissions which may lead to more modest demand growth.
6.3. Prices
Meat prices will remain high in nominal terms over the outlook period (Figure 6.2). Real meat prices are
projected to continue to trend downwards due to slower growth in meat consumption, combined with an
expanding supply supported by low increase in feed grain prices. The actual path over time will differ by
meat type. In the short term, real beef prices will decline faster due to ample beef supply from major
producing countries such as Argentina, Brazil, and the United States following a rapid increase in herd
inventories in recent years. However, as beef cowherds decline and the rate of production growth slows,
nominal prices are projected to start to increase slowly.
Pigmeat prices are projected to decrease in real terms, but remain high in nominal terms, when compared
to the base period. Notable features of the global sector that will shape this trend are increased supply
from Brazil, the European Union, and the United States, and robust import demand from China in particular.
At the global level, a continued increase in poultry flock is expected. The combination of a rise in feed costs
and growing import demand will support an increase in nominal poultry prices over the projection period.
Sheepmeat prices in real terms are projected to remain high as contractions in flock will reduce supply and
restrict trade from the two leading exporters, Australia and New Zealand. This will maintain pressure on
global prices in the early years of the projection period. Strong growth in import demand from China is
expected to marginally increase in the second part of the projection period as the effects of ASF begin to
subside.
Figure 6.2. Feed cost index and meat to feed nominal price ratios
2009-11=1 2009-11=1
1.6 2.5
1.4 2.3
2.0
1.2
1.8
1.0 1.5
0.8 1.3
0.6 1.0
0.8
0.4
0.5
0.2 0.3
0.0 0.0
1999
2004
1999
2004
2009
2014
2019
2024
2029
2004
2009
2014
2019
2024
2029
1999
2009
2014
2019
2024
2029
1999
2004
2009
2014
2019
2024
2029
Feed Cost Index (left) Pig meat/Feed Index (right) Poulty/Feed Index (right) Beef/Feed Index (right)
Source: OECD/FAO (2020), “OECD-FAO Agricultural Outlook”, OECD Agriculture statistics (database),
http://dx.doi.org/10.1787/agr-outl-data-en.
StatLink 2https://doi.org/10.1787/888934142482
OECD-FAO AGRICULTURAL OUTLOOK 2020-2029 © OECD/FAO 2020166
6.4. Production
Over the medium term, production will benefit from favourable meat-to-feed price ratios (Figure 6.3).
Increased import demand will support meat prices, contributing to higher profitability in meat production
during the first half of the projection period. This is particularly relevant in the pigmeat sector, where ASF-
related culling has decreased production in East Asia. Inherent differences in the production system imply
that favourable meat-to-feed ratios are more beneficial to poultry and pigmeat production, whereas beef
producers have more flexibility in the intensity of feed use. Sheepmeat production is mostly pasture-based
and producers benefit less from lower meat-to-feed price ratios.
Over the course of the outlook period, a combination of herd and flock expansion in the Americas and
increased productivity in the region will support a supply-driven market. Poultry meat remains the primary
driver of growth in total meat production. Low production costs, a short production cycle, high feed
conversion ratios, and low product prices have contributed to making poultry the meat of choice for both
producers and consumers.
Global meat production is projected to expand by nearly 40 Mt by 2029, reaching 366 Mt. Overall, the bulk
of meat production growth is attributed to developing regions, which will account for 80% of the additional
output (Figure 6.3). In the short term, the supply response of the various meat types remains influenced
by ASF outbreaks in Asia, as well as reductions of beef cattle numbers and sheep flock in Australia due to
weather conditions. Post-2021, these factors will stabilise and a gradual recovery in the production of meat
is expected to follow.
Figure 6.3. Growth of meat production by region and meat type
2029 vs 2017-19
Note: c.w.e. is carcass weight equivalent, r.t.c. is ready to cook equivalent.
Source: OECD/FAO (2020), “OECD-FAO Agricultural Outlook”, OECD Agriculture statistics (database),
http://dx.doi.org/10.1787/agr-outl-data-en.
StatLink 2https://doi.org/10.1787/888934142501
Brazil, China, the European Union, and the United States are projected to produce nearly 60% of global
meat output by 2029. Production growth in Brazil will continue to benefit from an abundant supply of natural
resources, feed, grassland availability, productivity gains and, to some extent, the devaluation of the Real.
Production in China will benefit from growing economies of scale as small production units grow into larger
OECD-FAO AGRICULTURAL OUTLOOK 2020-2029 © OECD/FAO 2020 167 commercial enterprises. Production in the United States will benefit from strong domestic demand and higher slaughter weights in a low feed cost environment. The overall meat production in the European Union will remain stable reflecting a small reduction in domestic demand for both beef and pigmeat, while in African countries the ratification of the African Continental Free Trade Agreement, under which more than 90% of products traded within Africa will be duty free, is expected to promote additional meat production. Global beef production will grow over the outlook period, particularly in the main producing countries of the Americas such as Argentina, Brazil and the United States. Developing countries are projected to account for 81% of the additional beef produced by 2029, when compared to the base period. The majority of this expansion should occur in Argentina (despite the export tax on beef), Brazil, China, Pakistan, Sub-Saharan Africa, and Turkey. In developed countries, production is projected to be 4% higher by 2029 compared to the base period; this increase will be mainly due to high growth in Canada and the United States. Beef production in North America will be supported by both higher carcass weights, resulting from low feed costs, as well as increased slaughter numbers as herd rebuilding lead to higher livestock numbers. Beef supply will remain tight in Australia over the short term as a result of the drought conditions that have prevailed over the past few years. A gradual recovery in production is expected to follow, however, the herd rebuilding is expected to take some years. In the European Union and the United Kingdom, a downward trend in beef production is expected as dairy cowherds, which make up approximately two- thirds of the beef supply, will decrease following productivity gains in the milk sector. Other factors limiting the growth potential of this sector in the European Union are a reduction in suckler cowherds due to their low profitability, escalating competition in export markets, and declining domestic demand. Furthermore, it is projected that demand will shift as consumer taste changes to include more processed meat and ready- to-eat meals. The ASF outbreak across Asia, which has substantially shifted supply and demand since late 2018, continues to affect many countries, with China and Viet Nam suffering the greatest impact. It is projected that ASF outbreaks will continue to reduce global pigmeat output until 2021, after which it is expected to steadily increase over the remainder of the outlook period. This Outlook assumes that Chinese pigmeat production will decline in 2020 by 8%. Production and consumption in China is projected to reach 2017 levels in 2025/2026 and to resume a steady growth trend for the remainder of the outlook period. The increase in global pork production over the next decade will be largely driven by recovery from ASF in the Asian region, with China’s production growth aimed at supplying its own domestic market. This growth is expected to provide two-thirds of the additional global output. High production growth rates are also expected in Viet Nam over the outlook period. Pigmeat production in the European Union is projected to decrease slightly as environmental and public concerns are expected to limit its expansion. Poultry meat will continue to be the primary driver of meat production growth, albeit at a slower rate in the projection period relative to the past decade, accounting for half of all additional meat produced over the next decade. Its short production cycle allows producers to respond quickly to market signals, while also allowing for rapid improvements in genetics, animal health, and feeding practices. Production will expand rapidly from sustained productivity gains in China, Brazil, and the United States, and investments made in the European Union – in particular, Hungary, Poland and Romania which will take advantage of the lower production costs. Rapid expansion is also foreseen in Asia as the shift away from pigmeat consumption in the short term will benefit poultry in the medium term. Growth in sheepmeat production will mostly originate in Asia, led by China, but significant increases in production are projected to occur in Africa, particularly in the least developed countries of Sub-Saharan Africa. Despite limitations linked to urbanisation, desertification, and the availability of feed in some countries, sheep and goats in particular represent a popular stock well adapted to the region and the extensive production systems it utilises. In Oceania, production growth is expected to increase only moderately because of ongoing competition for pastureland from beef and dairy in New Zealand, which is OECD-FAO AGRICULTURAL OUTLOOK 2020-2029 © OECD/FAO 2020
168
the major exporter, as well as the extreme and prolonged drought in Australia where total sheep numbers
have fallen from 72 to 66 million from 2017 to 2019. Sheepmeat production in the European Union is
expected to remain stable, as it will be sustained by the voluntary coupled support in the main sheep-
producing Member States.
This Outlook provides projections for agricultural markets that incorporate assumptions of the effects of
the ASF outbreak in China. These assumptions include the 2019 government support plan over the next
three years and which includes a series of policies designed to stabilise, recover and stimulate pig
production. Increased financial support for the development of larger production facilities as well as
increased scientific research to develop a vaccine and technical services and guidelines to prevent and
control ASF are being implemented. It is expected this will result in the disappearance of many smaller
farms, which will receive subsidies for culling herd to the benefit of increasingly large integrated producers,
which generally have stronger biosecurity measures.1 In 2019, China’s pigmeat production decreased by
21%, and is projected to decline a further 8% in 2020. Starting from 2021, this Outlook assumes pigmeat
production will increase and reach pre-ASF production levels by 2025. This reflects the projections
presented by Ministry of Agriculture and Rural Affairs in the China Agricultural Outlook (2019-2028) that
are adjusted to account for 2019 market developments (Figure°6.4). Import volumes also increased in
2019 and are projected to reach 3 Mt by 2020, an increase of 24% over 2019. This should increase China’s
share of world imports from 17% in 2017 to about 29% in 2020. Most of China’s pigmeat imports are
expected to originate from Brazil, Canada, the European Union, and the United States. In addition, China
is expected to significantly increase its import of live sow to rebuild its inventory.
The effect of the current ASF outbreak has also been severe in Viet Nam, where the sector is dominated
by small producers. Since confirming the first outbreak in February 2019, ASF has spread rapidly to all
provinces. By March 2020, it was estimated that approximately 6 million pigs had been culled. Recent
signs of improvement are nonetheless evident with 35 of the 63 provinces reporting in early March 2020
no outbreaks within the last 30 days.2 It is assumed in this Outlook that production will remain weak in
2020 before starting a gradual recovery to reach 2018 levels by 2025 (Figure 6.4). Several other East
Asian countries have been affected to a lesser extent by ASF outbreaks; its impact in these countries is
analysed in this Outlook as of early January 2020.
ASF has led Chinese consumers to turn to alternative sources of meat, in particular poultry. In spite of the
recent resurgence of Highly Pathogenic Avian Influenza (HPAI), poultry, and egg production are projected
to increase in China so as to supply some of the additional domestic demand for alternative types of meat.
However, the sharp reduction in pig numbers still supports the expectation that growth in overall feed
demand will change in the early years of the outlook period. In the case of maize, feed demand is projected
to decline for the first two years of the projection period when Chinese pigmeat production is expected to
be at its lowest. This is primarily because of the greater amount of feed required to produce a given volume
of pigmeat (for more information on the interaction between China’s ASF affected meat production and
feedstock demand, see FAO, 20193).
The recent outbreaks of COVID-19 have also affected the meat market in China. Since the beginning of
2020, the lack of workers in the labour-intensive meat processing industry (abattoirs) and the transportation
bottlenecks that have been created have resulted in a shortage of meat at markedly higher prices.4
OECD-FAO AGRICULTURAL OUTLOOK 2020-2029 © OECD/FAO 2020 169
Figure 6.4. Pigmeat production
China Viet Nam
Mt c.w.e. Pigmeat production (left) Annual growth rate (right) % Mt c.w.e. Pigmeat production (left) Annual growth rate (right) %
60 15 5 15
10 4.5 10
50
4
5 5
3.5
40
0 3 0
30 -5 2.5 -5
-10 2 -10
20
1.5
-15 -15
1
10
-20 0.5 -20
0 -25 0 -25
2024
2025
2018
2017
2018
2019
2020
2021
2022
2023
2026
2027
2028
2029
2017
2019
2020
2021
2022
2023
2024
2025
2026
2027
2028
2029
Note: c.w.e. is carcass weight equivalent.
Source: OECD/FAO (2020), “OECD-FAO Agricultural Outlook”, OECD Agriculture statistics (database),
http://dx.doi.org/10.1787/agr-outl-data-en.
StatLink 2https://doi.org/10.1787/888934142520
6.5. Consumption
Growth in meat consumption is projected to increase in developing regions due to high population levels
and growth rates. It is expected this will result in an overall growth in the volume of meat consumption in
developing countries approximately five times that of developed countries. This is particularly relevant in
Africa and Asia, where growth rates are expected to be higher over the outlook period when compared to
the past decade. The ratification of the African Continental Free Trade Agreement is projected to positively
impact on trade flows within the continent due to the additional consumption resulting from lower prices.
Gains in per capita consumption are expected to remain small, however, as income growth occurs from a
small base. Nevertheless, high population growth implies that total consumption growth will be faster than
for any other region, despite limited and sometimes negative gains in per capita terms. Growth in meat
consumption in Asia will stem from a combination of increased availability as the ASF outbreak abates, in
addition to increased consumption per capita due to rising incomes, declining meat prices in real term, and
trade liberalisation.
At the country level, change in per capita meat consumption varies widely among countries and meat types
over the projection period (Figure 6.5). Global meat consumption per capita is projected to increase slightly
by 0.4 kg r.w.e. compared to the base period. Consumption levels in the higher income regions are, in
some cases, close to saturation. This Outlook projects that annual growth in per capita meat consumption
in developed countries will be 0.24% p.a., one-fourth of the annual growth rate of the preceding decade,
but 0.8% p.a. in developing countries, double that of the preceding decade.
How consumers spend their money on food is also changing. In high-income countries, increases in food
expenditure per individual are shifting from the purchase of fresh food prepared in one’s home towards
convenience food and eating-out.5 6This is the case, for example, in Japan, in particular amongst older and
single person households, and it is a trend that the Japanese government expects will increase over the
next decade. In addition, given that the Japanese population is expected to decline by 4%, when compared
to the base period, overall meat consumption is projected to decrease marginally. Other factors, such as
quality, will become increasingly important for consumers in high-income countries and influence their
choices.
OECD-FAO AGRICULTURAL OUTLOOK 2020-2029 © OECD/FAO 2020170
Figure 6.5. Top 5 countries increase/decrease in per capita consumption by different meat types
2029 vs. average 2017-19
Source: OECD/FAO (2020), “OECD-FAO Agricultural Outlook”, OECD Agriculture statistics (database),
http://dx.doi.org/10.1787/agr-outl-data-en.
StatLink 2https://doi.org/10.1787/888934142539
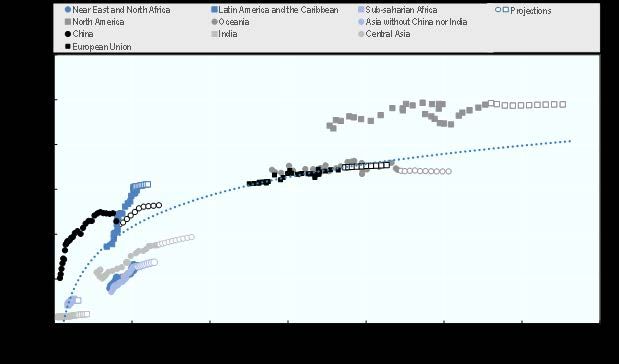
Meat demand continues to increase as income continues to grow in developing countries, where per capita
consumption is projected to increase further and per capita growth rates to be equivalent to those in
developed countries, when compared to the base period. In developed countries, changes in meat
consumption reflect a decline in the influence of factors such as income and price, and, as noted above,
many of these countries have reached saturation in their meat consumption levels (Figure 6.6). Other
factors include religious beliefs, cultural norms, urbanisation, and environmental, ethical, and health
concerns.
Historically, lower prices have contributed to making poultry the meat of choice for consumers in developing
countries. With slow growth in income over the projection period, this will continue to be the case and
poultry will constitute the largest share of additional per capita consumption at the global level.
Beef consumption is projected to increase to 76 Mt over the next ten years and to account for 16% of the
total increase in meat consumption compared to the base period. In per capita terms, beef consumption in
the developing world is expected to continue to remain lower, at about one-third in volume terms, relative
to developed countries. Asia is the only region where it is projected to increase its per capita beef
consumption over the projection period, albeit from a low base. Several countries that have high beef per
capita consumption will see their level of beef consumption decline in favour of cheaper pigmeat and
poultry meat.
Global pigmeat consumption is projected to increase to 127 Mt over the next ten years and to account for
28% of the total increase in meat consumption. On a per capita basis, pigmeat consumption is expected
to marginally decline over the outlook period as consumption declines in most of the developed countries.
In the European Union, for example, it is projected to decline as changes in the composition of the
population influences diets that will favour poultry to pigmeat; the former is not only cheaper but also
perceived as a healthier food choice. In developing countries, per capita consumption of pigmeat, which is
half of that in developed countries, is expected to marginally increase over the projection period. Growth
rates are sustained in most of Latin America, where per capita pigmeat consumption has grown rapidly,
backed by favourable relative prices that have positioned pork as one of the favoured meats, along with
OECD-FAO AGRICULTURAL OUTLOOK 2020-2029 © OECD/FAO 2020 171
poultry, to meet rising demand from the middle class. Several Asian countries, which traditionally consume
pork, are projected to increase consumption on a per capita basis once the impact of ASF wanes.
Consumption of poultry meat is projected to increase globally to 145 Mt over the projection period, with
poultry expected to account for 50% of the additional meat consumed. On a per capita basis, the expected
robust growth rates in poultry consumption reflect the significant role it plays in the national diets of several
populous developing countries, including China and India. Nevertheless, a substantial gap, mainly linked
to income levels, will remain with the developed countries, which consume nearly three times as much
poultry as developing countries.
Global sheepmeat consumption, a niche market in some countries and considered a premium component
of diets in many other countries, is projected to increase by 2 Mt over the outlook period and account for
6% of the additional meat consumed. Sheepmeat consumption worldwide, on a per capita basis, is
comparable in both developing and developed countries, and is expected to increase marginally over the
projection period as prices are expected to remain high. In many Middle Eastern and North African (MENA)
countries, where sheepmeat is traditionally consumed, per capita consumption is projected to continue its
long term decline at the benefit of poultry. Demand growth in this region is tightly linked to the oil market,
which influences substantially both the disposable income of the middle class and government spending
patterns.
Figure 6.6. Income impact on per capita meat consumption per region
1990 to 2029
Source: OECD/FAO (2020), “OECD-FAO Agricultural Outlook”, OECD Agriculture statistics (database),
http://dx.doi.org/10.1787/agr-outl-data-en.
StatLink 2https://doi.org/10.1787/888934142558
OECD-FAO AGRICULTURAL OUTLOOK 2020-2029 © OECD/FAO 2020172
6.6. Trade
Global meat traded (excluding live animals and processed products) are projected to be nearly 12% higher
in 2029 than in the base period. This represents a slow-down in the growth of meat trade to an annual
average rate of nearly 0.6%, compared to 3% during the previous decade. It is expected, however, that
the share of total meat output traded will increase slightly over time, in particular at the beginning of the
projection period.
Meat exports are concentrated, and the combined share of the three largest meat exporting countries –
Brazil, the European Union and the United States – is projected to be nearly 60% of world meat exports
by 2029. In Latin America, traditional exporting countries are expected to retain a high share of the global
meat trade, benefiting from the depreciation of their currencies and surplus feed grain production.
Rising imports over the next decade will be comprised mainly of poultry, the largest contributor, and beef.
Together, these two meat types are projected to account for most of the additional meat imports into Asia
and Africa where consumption growth will outpace the expansion of domestic production.
Import demand is expected to increase the fastest (in terms of growth rates) in Sub Saharan Africa, while
in volume terms the increase in meat imports is driven by Asia. The Asian region will account for 53% of
global trade by 2029. The greatest increases will originate from the Philippines, and Viet Nam, for poultry
meat. While Chinese meat imports will increase substantially in the early part of the projection period, a
gradual decline in imports is projected in the second half of the projection period as production recovers
from the ASF outbreak (Figure 6.4). The increased import demand for pigmeat in China is expected to
yield high benefits for Brazil, Canada, the European Union, and the United States. In the Russian
Federation, the long-term effects of the 2014 import ban on meat, which this Outlook expects to remain in
effect until the end of 2020, has stimulated domestic production, and meat import levels are expected to
continue to decline over the projection period.
Sheepmeat exports from Australia and New Zealand have benefitted from the weak NZD and AUD relative
to the US dollar, as well as from strong demand at the global level. Shipments to China are projected to
remain high as significant growth in Chinese demand for sheepmeat is expected for the duration of the
ASF outbreak. This demand contrasts with decreased demand from the United Kingdom and continental
Europe in the first half of the outlook period. As a result, Australia is expected to continue to increase its
lamb production at the expense of mutton. In New Zealand, export growth is projected to be marginal, as
land use has shifted from sheep farming to dairy.
6.7. Main issues and uncertainties
Trade policies remain a major factor affecting the dynamics of world meat markets. The implementation of
various trade agreements over the outlook period could diversify or consolidate meat trade considerably.
Unilateral and/or unexpected trade policy decisions are another risk factor in the projections. Domestic
policies also influence the competitiveness of meat producers. Argentina introduced a temporary meat
export tax in 2018, which is expected to negatively affect the country’s competitiveness on the world meat
market. Ongoing trade negotiations between the United Kingdom and the European Union will also
influence the various meat markets.
Animal diseases have disrupted poultry, beef and, pigmeat markets and this is likely to continue over the
outlook period. The medium-term impact of ASF on global pork production is uncertain, but measures to
contain this outbreak are assumed in this Outlook to depress global pork production in the next five years.
The medium-term impact of ASF, however, may be more or less severe than currently anticipated.
In the short term, the magnitude of the impact and the duration of the COVID-19 outbreak are uncertain.
Labour supply and transportation problems could hinder the marketing chain and affect meat production
OECD-FAO AGRICULTURAL OUTLOOK 2020-2029 © OECD/FAO 2020 173 (including both slaughtering and processing). This outbreak will also impact, in the short term, consumption patterns, in particular out-of-home consumption which in turn will impact demand for high value meat cuts usually consumed in restaurants. In addition, the threat of market-ready livestock that cannot be traded or processed given the current labour shortage could result in severe economic fallout in rural communities and a major animal welfare challenge. Finally, the duration of the economic slowdown and its impact on income growth is likely to dampen meat demand, which has a high income responsiveness, for part of the projection period. Aggregate consumption of meat has been on a continuous upward trajectory, driven by population and income increases. However, the pattern for individual meat types has not been homogenous. Differences in relative prices, combined with growing health and environmental concerns have led consumers to gradually decrease the share of red meat in their meat consumption, while increasing the share of poultry. There is evidence that growth rates in meat consumption are declining in response to slowing income growth rates. Many high income countries are reaching saturation levels in terms of per capita consumption (Figure 6.6). Changing consumer preferences – such as the rise in vegetarian or vegan lifestyles, societal concerns such as the negative impact of meat production on the environment, and other various socio- cultural aspects such as those dictated by religion or cultural norms – will also have an effect. Climate change, obesity, technology advancements and changing consumer lifestyles are also important factors, in particular as they influence policy initiatives and shifts towards environmentally sustainable consumption patterns. The increasing attention of consumers to animal treatment and how meat is produced (with a growing preference for organic meat and meat products) are relatively new factors that are difficult to assess at this point in time. If adopted by an increasing share of the population, however, they could affect global meat markets, although the extent to which consumers are willing and able to pay a premium for such goods is unclear. In many developing regions, affordability remains a primary concern. Notes 1 OECD (2020), Agricultural Policy Monitoring and Evaluation 2020, OECD Publishing, Paris. 2 http://www.fao.org/ag/againfo/programmes/en/empres/ASF/situation_update.html (as of 15 May 2020) 3FAO (2019), “African Swine Fever: Challenges for some, opportunities for others?” in Food Outlook, FAO Publications, Rome. 4 FAO (2020), COVID-19: Channels of transmission to food and agriculture, FAO Publications, Rome. http://www.fao.org/documents/card/en/c/ca8430en. 5See Chapter 2, “Consumer Trends of EC (2019)”, EU Agricultural Outlook for Markets and Income, 2019- 2030, European Commission, DG Agriculture and Rural Development, Brussels. 6 Yagi, K. (2019), “Regarding future estimates of food consumption in Japan, Continuing decreases in total food expenditure and externalization of our diet”, PRIMAFF Review, No. 92, pp.2-3. OECD-FAO AGRICULTURAL OUTLOOK 2020-2029 © OECD/FAO 2020
You can also read