Empowering people in their daily lives - Morgan Stanley TMT Conference San Francisco, 02 March 2020 - Schibsted

Page created by Bruce Bowen
 
CONTINUE READING
Empowering people in their daily lives - Morgan Stanley TMT Conference San Francisco, 02 March 2020 - Schibsted
Empowering people in
their daily lives
Morgan Stanley TMT Conference
San Francisco, 02 March 2020
Empowering people in their daily lives - Morgan Stanley TMT Conference San Francisco, 02 March 2020 - Schibsted
Disclaimer

    This presentation (hereinafter referred to as the "presentation") has been          There may have been changes in matters which affect the Company
    prepared by Schibsted ASA ("Schibsted" or the "Company") exclusively for            subsequent to the date of this presentation. Neither the issue nor delivery of
    information purposes and does not constitute an offer to sell or the solicitation   this presentation shall under any circumstance create any implication that the
    of an offer to buy any financial instruments.                                       information contained herein is correct as of any time subsequent to the date
                                                                                        hereof or that the affairs of the Company have not since changed.
    Reasonable care has been taken to ensure that the information and facts
    stated herein are accurate and that the opinions contained herein are fair and      The Company does not intend, and does not assume any obligation, to update
    reasonable, however no representation or warranty, express or implied, is           or correct any information included in this presentation.
    given by or on behalf of the Company, any of its directors, or any other person
    as to the accuracy or completeness of the information or opinions contained in      Alternative performance measures (APM) used in this presentation are
    this document and no liability is accepted for any such information or opinions.    described and presented in the section Definitions and reconciliations in the
                                                                                        quarterly report.
    This presentation includes and is based on, among other things, forward-
    looking information and statements. Such forward-looking information and
    statements are based on the current expectations, estimates and projections
    of the Company or assumptions based on information available to the
    Company. Such forward-looking information and statements reflect current
    views with respect to future events and are subject to risks, uncertainties and
    assumptions. The Company cannot give any assurance as to the correctness
    of such information and statements. Several factors could cause the actual
    results, performance or achievements of the Company to be materially
    different from any future results, performance or achievements that may be
    expressed or implied by statements and information in this presentation.

2
Empowering people in their daily lives - Morgan Stanley TMT Conference San Francisco, 02 March 2020 - Schibsted
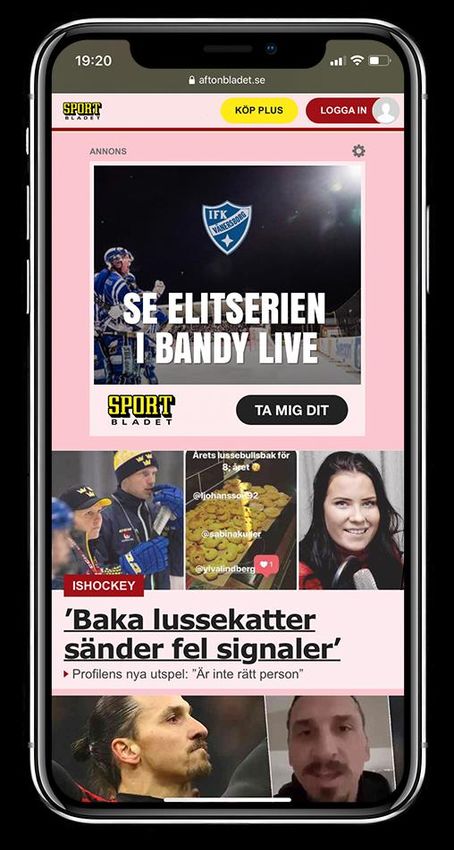
Three strong Nordic business areas after the
spin-off of Adevinta

                                                                                                                                     59% ownership in
      Nordic                                                                              Next                              leading pure-player in international
                                                  News
    Marketplaces                                                                                                                       marketplaces
                                                  Media

         Revenues 2019                          Revenues 2019                        Revenues 2019                                       Revenues 2019*
         NOK 3.1bn                              NOK 7.5bn                            NOK 3.2bn                                           NOK 6.7bn

           EBITDA 2019                           EBITDA 2019                           EBITDA 2019                                        EBITDA 2019*
         NOK 1.4bn                              NOK 0.8bn                            NOK 0.3bn                                           NOK 2.0bn

3   * Based on Adevinta ASA figures converted to NOK (9.8503 NOK/EUR); for more info and figures in EUR: adevinta.com/ir/
Empowering people in their daily lives - Morgan Stanley TMT Conference San Francisco, 02 March 2020 - Schibsted
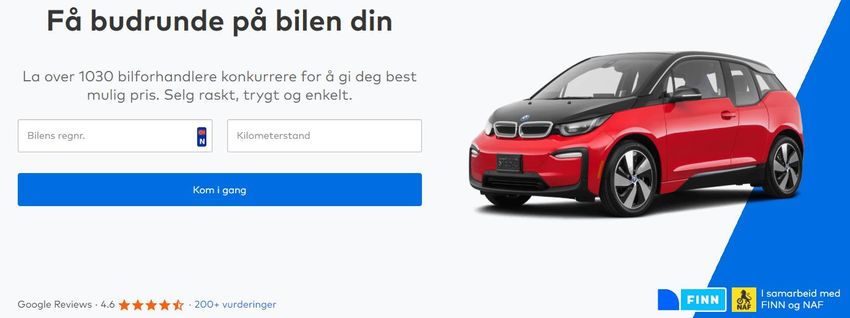
A Nordic digital front-runner with the purpose of value
creation for both shareholders and society

                       We create significant financial value to our shareholders, but we also
                       create significant value to society

                                  We utilize our position as a Nordic digital front-runner to
                                  grow further and build strong positions

                                              Schibsted is more than the sum of its parts

4
Empowering people in their daily lives - Morgan Stanley TMT Conference San Francisco, 02 March 2020 - Schibsted
Our businesses are important for building a sustainable and
democratic society, attracting talent and users
      Nordic
                   Next
    Marketplaces

               Help people make better    …reducing CO2 emissions and
               choices by…                empowering consumers

               Defending democratic and   …providing trusted and
               humanistic values by…      independent journalism

      News
      Media
5
Empowering people in their daily lives - Morgan Stanley TMT Conference San Francisco, 02 March 2020 - Schibsted
We have a 180 years track record of transformations…

                                                                                                                                             2019
                                                                                                                                     2018

                                                                                                                           2017

                                                                                                                 2016
                        JV with                                                                       2015

                                                                                           2014
                                                                                                                           Sale of operations in
                                                                                 2013                                      Romania

                                                                      2010
                                                            2006
                                                 2003
                                                                             Incorporation of Schibsted Classified Media
                                          2000
                                   1996
                            1992
                     1966                        Schibsted Listed on Oslo
                                                                                       Launch of
              1860                               Stock Exchange
       1839

6
Empowering people in their daily lives - Morgan Stanley TMT Conference San Francisco, 02 March 2020 - Schibsted
…creating value through bold investments and long-term
strategies
    Market cap (NOKbn)
                                                                                                                                                    90.1

                                                                                                                                                    27.1
                                                                                                                      65.1                 65.6

                                                                                                               51.2                 53.8
                                                                                                        43.3                 43.1

                                                                                                 25.4                                               63.0

                     16.3                                                 18.6            16.1
     15.4                                               14.1
                                        5.7

     2006            2007             2008              2009             2010             2011   2012   2013   2014   2015   2016   2017   2018   Feb-2020

       Adevinta spun-off part*
       Schibsted

7     * 35% of Adevinta which was distributed to Schibsted's shareholders in April 2019
Empowering people in their daily lives - Morgan Stanley TMT Conference San Francisco, 02 March 2020 - Schibsted
Value creation through targeted investment opportunities
combined with capital discipline
                            Recent examples
    Organically build new   Svosj (domestic distribution subscription)
    business

    International
                            Lendo Denmark, Poland, Austria
    expansion

    M&A and venture
                            Jobbsafari (Sweden), Nettbil (Norway), Habity
    activities

    Adjustment of capital   2% share buyback

    Adevinta ownership      Thoroughly managing our ownership stake

8
Empowering people in their daily lives - Morgan Stanley TMT Conference San Francisco, 02 March 2020 - Schibsted
Data and synergies make Schibsted more than the sum of its
parts

     Product development and integrations driven                            Highlights
                       by…                                                  • Utilizing user data across the Group entities
                                                                                • Better products for consumers and customers
                                                                                • Improved advertising targeting
                                                                            •   Opportunity to develop subscription products across
                                                                                the Group
       Nordic                               News              Next
                                                                            •   Cross linking traffic to supercharge growth of new
     Marketplaces                           Media                               services
        207m                                505m             114m
          Monthly visits                  Monthly visits   Monthly visits

                              …traffic and user data

9   Source: Company data, November 2019
Empowering people in their daily lives - Morgan Stanley TMT Conference San Francisco, 02 March 2020 - Schibsted
Highlights 2019

             Successful spin-off/IPO of Adevinta

             New tenured and solid management team established

             Refocusing Schibsted as Nordic digital front-runner well
             positioned for further growth

             Successful turnaround of Blocket after revenue decline in
             2018

10
Schibsted key take-aways

     Historical track record of incubating
     growth businesses

     Focus on growth based on unique
     position in the Nordics and cross
     divisional synergies

     Proven financial performance and
     strong balance sheet

     Supportive long-term owner of
     Adevinta with focus on optimizing
     shareholder value

11
Q4 2019 results –
highlights

12
Highlights Q4 2019

• Group revenues +8% in Q4 2019, +1% ex Adevinta
  • Q4 EBITDA for Schibsted ex Adevinta -3% YoY (-21% excluding IFRS 16) at NOK 460m
• Nordic Marketplaces: Solid revenue growth at a somewhat lower pace, increased EBITDA despite
  investments in Sweden. Revenues in Norway +6% despite somewhat lower volumes in jobs, Sweden +8%.
• News Media: Continuous good growth in digital subscription revenues, reduced advertising revenues, in
  particular in Sweden, leading to a decline of 35% (excluding IFRS 16) in EBITDA YoY.
• Financial Services: Continued growth in Lendo Sweden, Norway with stable development compared to
  last quarter but down YoY.
• Growth: Solid revenue and EBITDA growth driven by Distribution and Prisjakt.
• Proposed dividend of NOK 2.00 per share for 2019

13
Schibsted excl.
                                                                                                                                                                                       Adevinta

Continued good growth development in Q4 within key
strategic focus areas

                                                                         News Media
            Nordic
                                                                            digital                                                          Lendo                        Schibsted
          Marketplaces
                                                                         subscription                                                      revenues                        Growth
           revenues
                                                                          revenues**
                +6%*                                                                                                                       +4%*                           +16%*
                                                                            +21%

     Verticals driving growth,                                   Good growth driven by                                             Growth driven by                   Strong revenue growth
     jobs volumes in Norway                                      both volume and ARPU                                            continued double-digit                 primarily driven by
      somewhat lower in Q4                                             expansion                                                   growth in Sweden                         Distribution
        and start of 2020

14    * Foreign exchange neutral basis, Marketplaces Norway adjusted for termination of license revenue from Adevinta and "Mäklarprodukt” transferred to News Media
      ** Excluding combined (paper edition with digital access) subscriptions
Steady growth in Q4 for Schibsted Group

Schibsted Group                                                                     Schibsted excl. Adevinta                       Adevinta
Revenues, EBITDA (NOKm)                                                             Revenues, EBITDA (NOKm)                        Revenues, EBITDA (NOKm)

                                           +8%
                                                       5,101
                             4,742
     4,455
                                                                                                               +1%

                                                                                        3,171         3,275          3,316

                                                                                                                                                          +16%*
                                                                                                                                                                  1,844
                                                                                                                                                  1,494
                                                                                                                                    1,316
                                        897                       944
             695
                                                                                                416           476            460                          421             485
                                                                                                                                            279

      Q4 2017                  Q4 2018                   Q4 2019                            Q4 2017   Q4 2018         Q4 2019        Q4 2017       Q4 2018         Q4 2019

15    * In EUR on a proportionate basis including JVs, for more details: adevinta.com/ir/
Executing on our focused strategy to mitigate the negative
trend in digital advertising

                                                  • Reorganization of our Swedish sales force
                                                    completed
        Aftonbladet                               • Continuous product development aiming to
                               VG digital
           digital                                  distinguish our offerings from programmatic
                              advertising
        advertising                                 commodities
                                revenue
          revenue                                 • Bolt-on acquisition of “Matkanalen”
                              decline 4%
        decline 22%
                                                  • Strengthening our offering for tailor-made
                                                    content marketing by ramping up and
                                                    coordinating “Brand Studio”
                                                  • Launch of high-volume reach product “Norge
       Significant drop in   Volatile market in
                                                    NÅ” in Norway, reaching 1 million users within
     revenue from gaming          Norway
                                                    24 hours
       industry continued

16
Taking strategic measures in News Media to adapt

     1   Implementing initiatives to turn   2   Focused product and business
         around negative margin                 development to generate new
         development and secure long-           revenues
         term profitability for News
         Media                                  • Fast guaranteed reach
                                                  products within advertising
         • Tight cost control                   • Increasing value and product
         • Efficiency improvements in             experience for every subscriber
           combination with cost                • E24 – building a stronger
           reductions                             position for financial news in
         • Main effects in 2021                   Norway

17
Strong financial position and capital discipline

       Low level of net interest-bearing debt, targeting
       NIBD/EBITDA* 1-3x

       Ongoing ambition for M&A and growth
       investments

       Share buyback program announced in July
       2019 to be completed

       Dividend proposal of NOK 2.00 per share

18
Key take-aways Q4 2019

       Online classifieds               Digital subscriptions     Schibsted Growth
        verticals +12%                       revenues in          revenues +16%*,
         Blocket +8%                    News Media +21%           margin expansion

                                             Implementing         Capital discipline –
     Digital advertising in             initiatives to improve    dividend proposal
     News Media -11%,                    margins and secure      NOK 2.00 per share,
      driven by Sweden                    long-term healthy        complete share
                                        profits in News Media    buybacks up to 2%

19   * Foreign exchange neutral basis
Nordic Marketplaces

20
Revenue growth of 6% driven by key verticals in Norway and
car vertical in Sweden
Nordic Marketplaces                                                                                                               Revenue growth driven by verticals in Q4 2019
Revenues (NOKm), EBITDA margin (%)                                                                                                Revenues (NOKm)

                                      +6%*                                                                                                               +6%
                                                  758                                                                                                          758
                             714                                                                                                                   714         61     Other (0%)
       665                                                                                                                               665       61
                                                                                                                                          60                   83     Generalist (-11%)
                                                                                                                                                   93
                                                                                                                                          96                   126    Display advertising (1%)
      42%                   41%                   43%                                                                                              124
                                                                                                                                         128
                                                (41%)

                                                                                                                                                   436         489    Verticals (+12%)
                                                                                                                                         381

     Q4 2017            Q4 2018               Q4 2019                                                                                Q4 2017      Q4 2018   Q4 2019

        Revenues
        EBITDA margin
        (EBITDA margin ex IFRS 16)

21    * Foreign exchange neutral basis, adjusted for termination of license revenue from Adevinta and "Mäklarprodukt” transferred to News Media
      IFRS 16 effect Q4 2019: NOK 13m
Revenue growth of 6% driven by verticals and advertising,
margin expansion driven by lower costs
Marketplaces Norway
Revenues (NOKm), EBITDA margin (%)                   Highlights Q4 2019

                                       +6%           • 5% growth in classifieds revenues, 14%
                                             486       growth in advertising revenues
                          459
                                                     • Growth in classifieds due to higher ARPU in
       393                                             key verticals driven by performance products
                                                       (e.g. “Blink”)
                                             46%
      38%                 41%                        • Macro affecting jobs with somewhat lower
                                             (44%)     volumes in Q4 and start of 2020; real estate
                                                       volumes also slightly down YoY
                                                     • Costs and margin positively affected by lower
                                                       marketing spending
                                                     • Continued good traffic growth, +11% YoY in
     Q4 2017           Q4 2018           Q4 2019       Q4
        Revenues
        EBITDA margin
        (EBITDA margin ex IFRS 16)

22    IFRS 16 effect Q4 2019: NOK 9m
8% revenue growth driven by car vertical, increase in FTEs to
execute on growth strategy affecting margin
Marketplaces Sweden
Revenues (NOKm), EBITDA margin (%)                                                                                                Highlights Q4 2019

                                      +8%*                                                                                         • Turnaround of Blocket continues with highest
       249                                        248                                                                                quarterly revenue growth in 2019
                             230
                                                                                                                                   • 11%* growth in classifieds, 3%* decline in
                                                                                                                                     advertising
      54%
                            48%                                                                                                    • Growth in classifieds driven by “bump” feature
                                                  40%                                                                                and pricing model within cars for
                                                                                                                                     professionals
                                                (39%)
                                                                                                                                   • Improved Generalist product with free edits
                                                                                                                                     and extra images affecting revenues
                                                                                                                                     negatively
                                                                                                                                   • EBITDA decline driven by more FTEs within
     Q4 2017            Q4 2018               Q4 2019                                                                                product, tech and sales due to both growth
        Revenues
                                                                                                                                     strategy and catch-up investments
        EBITDA margin
        (EBITDA margin ex IFRS 16)

23    IFRS 16 effect Q4 2019: NOK 3m
      * Foreign exchange neutral basis, adjusted for termination of license revenue from Adevinta and "Mäklarprodukt” transferred to News Media
Solid platform in Finland with further significant
ramp-up potential
Tori (Finland)
Established in 2009

                                     #1 position in
          EUR 630m
     GMV (the value of goods sold    general goods
        through Tori in 2018)
                                       and traffic

                    4.1                     1.2m
         Monthly visits per capita    Unique visitors per week

24   Source: Company data
Our value creation levers to drive further growth within
Nordic Marketplaces
     1
         Consolidate Nordic market
                 positions

     2                                 ARPU expansion
           Become transactional

                                     New revenue streams
     3
         Expand into adjacent and
            new marketplaces

25
1
Opportunities for value enhancing in-market consolidations
in Sweden and Finland

                            Traffic   Listings   Revenue   Traffic   Listings   Revenue   Traffic   Listings   Revenue

         Generalist                                         1           1         1         1          1          1

         Cars                                               1           1         1         3          2          3
                                        1
         Real Estate                                        2           2         2         3          3          3

         Jobs                                               2           1         1

26   Source: Company data
2
FINN moving more and more into transactions,
e.g. simpler car transaction journey

     Condition report,     Safe payment   Digital            One-click
     contract with ad-on   with escrow    registration of    insurance, car club
     services              service and    ownership change   membership, fuel
                           financing                         discount credit
                           options                           card, maintenance,
                                                             current market
                                                             price, car sharing

27
2
Nettbil offers a fast, convenient and safe sales process

Nettbil business model                                                              Acquisition* of an end-to-end digital car auction
 • Digital marketplace for auction-based car sales                                  service in Norway
    towards dealers all over Norway                                                 •   Supplement to the sale of used cars on FINN with
                                                                                        high synergy potential
                                                                                    •   Example: Upsell to Nettbil if car is not sold on FINN
                                                                                        within e.g. 30 days
                        Book online and get price estimate

                        Deliver car to nearest car test center

                        Car tested and photos taken

                        Car listed on Nettbil

                        Dealers bid on the car, seller can follow

                        Seller gets final offer and accepts offer

                        Buying dealer picks up car at the car test center

28   * Acquired 67% ownership in December 2019, remaining share owned by founders
2
Qasa – fully digital real estate
rental platform

        Building trust between tenant and landlord
        - Payment guarantee
        - Collaboration with legal professionals
        - Home insurance

            Finding suitable tenants
            - Matching algorithm
            - Tenants provide: National ID, references, etc.
            - Landlord is matched with tenants based on fit

        Facilitating process
        - Contract generation tool
        - Sign contracts with BankID

29
2
Transactional models provide significant opportunity for
ARPU expansion

 Real estate rental in Sweden          Car transactions in Norway
 ARPU potential (SEK)                  ARPU potential (NOK)

       “Traditional”                     “Traditional”
     Blocket model                        Finn model
                                ~25x                     ~1.5x
     Transactional                      Transactional
           model                              model
                                                                    ~10x
                                       "Nettbil" model

30
3
Investing to ensure both short- and long-term growth

                                                        •   Real estate new constructions
                                                  New   •   Education vertical
                                                        •   Salon booking marketplace
                                             Adjacent

                                                                   •   Real estate rentals
                                                                   •   Car transaction journey

                                                                        •   New self-served business
                                                                            center for professional
                                                 Core                       customers
                                                                        •   “Blink”

Size of colored areas indicating resource allocation
31
News Media

32
Strong growth in digital subscription revenues, outweighed
by a challenging advertising market
News Media                                                                                                                          Reaching 720k digital subscribers
Revenues (NOKm), EBITDA margin (%)                                                                                                  Digital subscription revenues** (NOKm)

                                       -6%*                                                                                                   +21%
      2,010                2,045                                                                             Digital subscription                    228
                                                  1,944                                                          revenues**
                                                                                                                                                     31     Aftonbladet
                                                                                                                  +21%                  188
                                                                                                                                        29           51     VG

                                                                                                                                        45
       9%                   10%                    10%                                                               Digital
                                                                                                                  advertising                        146    Subscription Newspapers
                                                                                                                   revenues             114
                                                  (7%)
                                                                                                                  -11%
     Q4 2017             Q4 2018               Q4 2019                                                                                Q4 2018     Q4 2019

        Online revenues                    EBITDA margin
        Offline revenues                   (EBITDA margin ex IFRS 16)

33    * Foreign exchange neutral basis; ** Excluding combined (paper edition with digital access) subscriptions
      IFRS 16 effect Q4 2019: NOK 47m
Market leading digital media houses in Norway and
Sweden
                                                      Revenues Q4 2019 (NOKm) EBITDA                   Digital       Market position
                                                        (Online revenue share) margin               subscriptions*
     Single copy papers

                            VG                                       477 (61%)                17%       211k         Largest online newspaper in Norway
                                                                                                                     Leading single copy sold print newspaper

                            Aftonbladet                             383 (55%)                 6%        219k         Largest online newspaper in Sweden
                                                                                                                     Leading single copy sold print newspaper
Subscription

                            Subscription                                                                             Largest national newspaper in Norway,
  papers

                            Newspapers                               913 (31%)                8%        292k         leading newspapers in 3 regions
                            Norway and
                            Sweden                                                                                   Second largest national broad
                                                                                                                     sheet newspaper in Sweden

34                   * Excluding combined (paper edition with digital access) subscriptions
Five focus areas to drive further ARPU and subscription
revenue growth [1/2]
1                                   2                                    3
      Developing verticals and
                                          Optimize pricing, i.e. price       Repacking of existing product
     upsell products (i.e. within
                                        increases where possible and         offerings (i.e. basis, premium,
        sports, business &
                                                 appropriate                 family) to maximize potential
             economics)

                                                                                New packaging of Aftenposten and
                                                                             Stavanger Aftenblad will be launched this
                                                                                             spring

35
Five focus areas to drive further ARPU and subscription
revenue growth [2/2]
4                                                     5
     Link or combine relevant subscription products
                                                            Increase the value of our paid products with
     across Schibsted and offer combinations to our
                                                          exclusive content and improved user experience
                       customers

                                                                                         Ex of exclusive content:
                                                                                                Live rights

                                                          Focusing on increasing the
                                                          user experience for our paid                          Ex of exclusive
                                                                   products                                    content: Podcasts

36
Next
Financial Services &
Growth

37
Strong growth in Sweden, stable development
quarter-over-quarter in Norway
Lendo Group
Revenues (NOKm), EBITDA margin (%)                      Highlights Q4 2019

                                                        • Continued double-digit growth in Sweden
                                         +4%*           • Stable development on a quarter by quarter
                                                218       basis in Norway, but still down year-on-year
                            207
       191                                              • Geographical expansion affected EBITDA
      45%
                                                          negatively with NOK 19m in Q4
                                                        • Also negative EBITDA contribution from
                            28%                           Finland; launching new platform to improve
                                                (24%)
                                                          conversion in a highly competitive market
                                                        • Reorganization to provide a more efficient
                                                14%       structure and enhance ability to expand
                                                          continues according to plan
     Q4 2017            Q4 2018             Q4 2019

        Revenues
        EBITDA margin
        (EBITDA margin ex expansion)

38    * Foreign exchange neutral basis
Lendo’s business model empowers users to find and
sign the best loan, 80% of revenue fully automated
                                       Credit       Proposals –
                                      scoring
                 Application                         inbox with                               Partner
                                                                                                        Lendo receives a
                    sent                               offers                                 process   commission of all
                                                                                                         loans paid out to
                                                                                                        consumers by the
                                                                                                        lender at the time
                                                                                                        of the transaction

                     2               Partners
                                                         4                                      6

     1                                 3                                   5                                   7
 User interest                       Info /                             Choice –                          Delivery
                                   Requests                           accept offer

                           On average 6 offers with 10% spread between worst and best offer

39
Continued strong growth in Denmark, soft launch in
Spain planned for 2020
Lendo Denmark                                      Lendo expansion
Indexed number of applications*                    Highlights

                                                   • Continued strong growth in Denmark with
1,100
1,000
                                                     solid traction on all key KPIs during the year
  900                                              • Continuing international expansion and plan
  800                                                for soft launch in Spain during 2020
  700
                                                   • Compared to Denmark, slower development
  600
  500
                                                     in the more immature markets Austria and
  400                                                Poland
  300                                              • Cost for geographical expansion affected
  200                                                EBITDA with NOK -19m in Q4, leading to full-
  100                                                year EBITDA effect of around NOK -100m in
    0                                                line with guidance
           Jan 2019                     Dec 2019
                                                   • 2020 total EBITDA investment level expected
                                                     to be in line with 2019

40   * Indexed 10 week moving average
Proven business model with international scalability
potential
                     Roll-out Norway in 2012

        2 years              NOK 47m
     Time to breakeven      Revenues year 2

                     Roll-out Denmark in 2018

      3-4 years             DKK ~50m
     Time to breakeven      Revenues year 2

                    Internationalization of Lendo is an important component of Schibsted’s growth story

41   Company data
Accelerated revenue development and margin expansion in
Schibsted Growth
Schibsted Growth                                   Revenue growth across all areas
Revenues (NOKm), EBITDA margin (%)                 Revenue growth Q4 2019 vs. last year (%)

                                    +16%*
                                                                      New business: 116%
                                            635     Distribution
       509
                            542                                       Legacy business: 13%

                                            10%
                                                    Prisjakt            3%*
       5%                   6%
                                            (9%)

     Q4 2017            Q4 2018          Q4 2019    Other
                                                                        9%*
        Revenues
                                                    Growth
        EBITDA margin
        (EBITDA margin ex IFRS 16)

42    * Foreign exchange neutral basis
      IFRS 16 effect Q4 2019: NOK 8m
Strong growth in innovative distribution operations
leveraging the already existing newspaper distribution
New businesses within Distribution
 • Leveraging the traditional newspaper
   distribution network – reaching 90% of
   Norwegian households every morning*
 • Continued strong growth for new
   distribution solutions fueled by e-commerce
   expansion
 • Distribution’s “new business” with revenues
   of approx. NOK 250 million in 2019,
   growing triple digit YoY
 • New subscription-based concept “Svosj”
   launched in September 2019

                                                    E-commerce   Fresh breakfast   Send parcels   Nordics’ first
                                                      B2C and    delivered home      home to        delivery
                                                       return      before 7 am        home        subscription
43   * Through Schibsted and partner’s operations
Home delivery subscription app “Svosj”
launched in Norway
Leveraging our existing last mile home distribution network*
 • Revenue model based on both shipping fees paid by online
   shop partners and monthly subscription fee from
   consumers, advertising revenue as possible third revenue
   stream
 • Unlimited free delivery for consumers via subscription
 • Partners gets access to attractive audience which is “sticky”
 • To your doorstep before breakfast – even in the weekends
 • Platform to build additional subscription models
 • Scalable model with intrinsic high margins – dilutive to
   Distribution EBITDA margin first 2-3 years

44   * Through Schibsted and partner’s operations
Expanding the customer buying process will increase
user engagement and revenue potential for Prisjakt
Customer buying process                     Examples of new services
                                            • Prisjakt is currently only serving users in the
             Reuse        Needs                “Alternative” and “Post Purchase” phases
                                            • Expanding the buying process with new
                                               services will grow user engagement and
                                               revenue potential
                                            • Examples:
      Post                                    • Content to guide online shoppers to select
                                   Infor-
      pur-                         mation        the right product, not only the right price
     chase
                                              • Improving filtering options to cater user
                                                 needs in more categories
                                              • Give online shops more insights, better
                                                 decision material and new innovative
              Pur-        Alter-
             chase        native                 services

45
Finance –
highlights

46
Schibsted excl.
                                                                                                                                                                                                        Adevinta

Segment summary

Nordic Marketplaces                                         News Media                                                    Financial Services                                    Schibsted Growth
(NOKm, %)                                                   (NOKm, %)                                                     (NOKm, %)                                             (NOKm, %)

                             +6%*                                                           -6%*
                                        758                                       2,045                                                                                                            +16%*
                      714                                       2,010
     665                                                                                            1,944
                                                                                                                                                                                                           635
                                                                                                                                                                                             542
                                                                                                                                                                                  509
     42%             41%               43%
                                                                                                                                                         +3%*                                           10%
                                      (41%)                                                                                                      249                 260
                                                                  9%               10%               10%                       235                                                           6%
                                                                                                                                                                                  5%                   (9%)
                                                                                                                               36%               25%
                                                                                                     (7%)                                                            (21%)
                                                                                                                                                                          13%
 Q4 2017 Q4 2018 Q4 2019                                     Q4 2017 Q4 2018 Q4 2019                                       Q4 2017 Q4 2018 Q4 2019                              Q4 2017 Q4 2018 Q4 2019

       Revenues                                                      Revenues                                                      Revenues                                         Revenues
       EBITDA margin                                                 EBITDA margin                                                 EBITDA margin                                    EBITDA margin
       (EBITDA margin ex IFRS 16)                                    (EBITDA margin ex IFRS 16)                                    (EBITDA margin ex                                (EBITDA margin ex IFRS 16)
                                                                                                                                   Lendo expansion)
47   * Foreign exchange neutral basis, Marketplaces Norway adjusted for termination of license revenue from Adevinta and "Mäklarprodukt” transferred to News Media
     Segment summary excluding Other/HQ segment
Consolidated
                                                                                                                                                              figures

Key financial figures Schibsted Group

 Earnings per share – adjusted                                                            Net cash flow from operating activities
 (NOK)                                                                                    (NOKm)

                                  1.76    1.74    1.84                                                                                    778             820
                                                                                                                                                                  759
     1.45                                                 1.42    1.40    1.43    1.36    604
                                                                                                                  550     566
                                                                                                                                                  486
              0.88
                          0.72                                                                    335     335                     330

 Q3 17       Q4 17      Q1 18     Q2 18   Q3 18   Q4 18   Q1 19   Q2 19   Q3 19   Q4 19   Q3 17   Q4 17   Q1 18   Q2 18   Q3 18   Q4 18   Q1 19   Q2 19   Q3 19   Q4 19

 Net interest-bearing debt                                                                Capex
 NIBD (NOKm), NIBD/EBITDA TTM* (%)                                                        Capex (NOKm), Capex/Revenues (%)

                                                                                                                                  266                             276
 5,047                                                                                            245                                             229
                                                                                          207                     200                     202             200
                                                                                                          172             179
                                                          3,191
             2,614       2,429    2,533           2,383                                            5.5                             5.6                             5.4
     2.1                                  2,239                                   1,951    5.0                                             4.4     4.8
                                                                                                           3.9     4.3     4.1                             4.3
               1.0        0.9      0.8     0.7     0.7     0.9    748     963
                                                                  0.2     0.2      0.5

 Q3 17       Q4 17      Q1 18     Q2 18   Q3 18   Q4 18   Q1 19   Q2 19   Q3 19   Q4 19   Q3 17   Q4 17   Q1 18   Q2 18   Q3 18   Q4 18   Q1 19   Q2 19   Q3 19   Q4 19

48     * Trailing twelve months
Basic share information
                                                                                                                A-share          B-share

     Ticker
                                                                                                                SCHA             SCHB
     Oslo Stock Exchange:
                                                                                                             SBSTA.OL         SBSTB.OL
     Reuters:
                                                                                                             SCHA:NO          SCHB:NO
     Bloomberg:

     Number of shares                                                                                      108,003,615       130,684,373
     Treasury shares (10 February 2019)                                                                       3,213,267        1,302,176
     Number of shares outstanding                                                                          104,790,348       129,382,197
     Free float*                                                                                                   71%               76%
     Share price (10 February 2020)                                                                        NOK 288.40        NOK 274.80
     Average daily trading volume (shares)**                                                                    274,000          179,000

     Total market cap (10 February 2019)                                                                NOK 65.8 billion (USD 7.1 billion)

49   * Total number of shares excluding treasury shares and shares owned by Blommenholm Industrier AS
     ** January-December 2019
Shareholder analysis

Rank       Name                                                                           A-shares           B-shares         Total       %          Shareholders       A-shares      B-shares
  1        Blommenholm Industrier AS                                                     28,541,262         30,621,205   59,162,467   25.3%   % of foreign shareholders       52.3%      56.3%
  2        Folketrygdfondet                                                               8,476,190         10,473,569   18,949,759    8.1%   Number of shareholders           3,801      4,199
  3        Baillie Gifford & Co.                                                          7,944,436          4,620,887   12,565,323    5.4%   Number of shares          108,003,615 130,684,373
  4        Fidelity Management & Research Company                                         8,202,299          4,062,242   12,264,541    5.2%   Shares owned by Schibsted    3,213,267  1,302,176
  5        Nya Wermlands Tidningen                                                        4,291,281          4,063,000    8,354,281    3.6%
  6        The Vanguard Group, Inc.                                                       3,229,541          2,811,894    6,041,435    2.6%
  7        JPMorgan Chase Bank GTS CL A/C Escrow Account                                  2,259,602          3,455,610    5,715,212    2.4%          Largest country of ownership A+B (VPS)
  8        Luxor Capital Group, L.P.                                                              0          5,621,805    5,621,805    2.4%   Norway                                       45.5%
  9        Alecta pensionsförsäkring, ömsesidigt                                                  0          5,193,000    5,193,000    2.2%   United States                                21.3%
 10        Adelphi Capital LLP                                                            2,205,460          2,809,202    5,014,662    2.1%   United Kingdom                               13.7%
 11        Goldman Sachs International                                                    2,740,347          2,125,372    4,865,719    2.1%   Luxembourg                                    4.6%
 12        Marathon Asset Management LLP                                                  1,874,724          1,492,033    3,366,757    1.4%   Ireland                                       3.5%
 13        KLP Forsikring                                                                   820,850          2,387,211    3,208,061    1.4%   Sweden                                        3.2%
 14        Storebrand Kapitalforvaltning AS                                               1,465,954          1,677,905    3,143,859    1.3%
 15        BlackRock Institutional Trust Company, N.A.                                       77,193          2,911,377    2,988,570    1.3%
 16        Fidelity Institutional Asset Management                                        2,207,396            713,926    2,921,322    1.2%
 17        DNB Asset Management AS                                                        1,218,065          1,662,315    2,880,380    1.2%
 18        Mitsubishi UFJ Trust and Banking Corporation                                   1,524,808          1,334,667    2,859,475    1.2%
 19        FMR Investment Management (U.K.) Limited                                       2,339,000            146,708    2,485,708    1.1%
 20        Pelham Capital Ltd                                                                     0          2,164,926    2,164,926    0.9%

The shareholder ID data are provided by Nasdaq OMX. The data are obtained through the analysis of beneficial
ownership and fund manager information provided in replies to disclosure of ownership notices issued to all
custodians on the Schibsted share register. Whilst every reasonable effort is made to verify all data, neither
Nasdaq OMX or Schibsted can guarantee the accuracy of the analysis.

50    Source: Nasdaq OMX, data as of 17 January 2020
Visit Schibsted’s web site
schibsted.com

Investor Relations contact:
Jann-Boje Meinecke
VP, Head of IR
ir@schibsted.com
+47 941 00 835

Schibsted ASA
Akersgata 55 / P.O. Box 490 Sentrum
NO-0105 Oslo
schibsted@schibsted.no
 +47 23 10 66 00
You can also read