Schaeffler AG 10th Annual Automotive Conference Goldman Sachs - November 30, 2018 - the Schaeffler Group
←
→
Page content transcription
If your browser does not render page correctly, please read the page content below
Schaeffler AG
10th Annual Automotive Conference
         Goldman Sachs

          November 30, 2018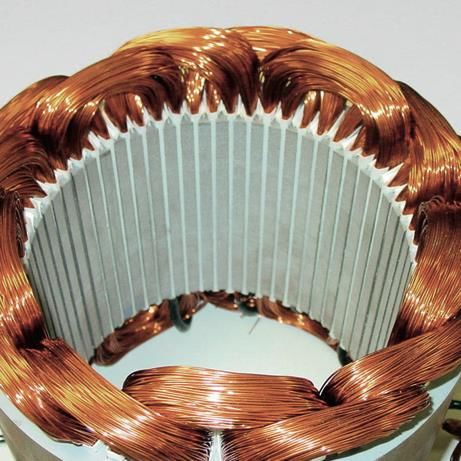
Disclaimer

    This presentation contains forward-looking statements. The words "anticipate", "assume", "believe", "estimate", "expect", "intend", "may", "plan",
    "project“, "should" and similar expressions are used to identify forward-looking statements. Forward-looking statements are statements that are not
    historical facts; they include statements about Schaeffler Group's beliefs and expectations and the assumptions underlying them. These statements are
    based on plans, estimates and projections as they are currently available to the management of Schaeffler AG. Forward-looking statements therefore speak
    only as of the date they are made, and Schaeffler Group undertakes no obligation to update any of them in light of new information or future events.
    By their very nature, forward-looking statements involve risks and uncertainties. These statements are based on Schaeffler AG management's current
    expectations and are subject to a number of factors and uncertainties that could cause actual results to differ materially from those described in the
    forward-looking statements. Actual results may differ from those set forth in the forward-looking statements as a result of various factors (including, but
    not limited to, future global economic conditions, changed market conditions affecting the automotive industry, intense competition in the markets in
    which we operate and costs of compliance with applicable laws, regulations and standards, diverse political, legal, economic and other conditions affecting
    our markets, and other factors beyond our control).
    This presentation is intended to provide a general overview of Schaeffler Group’s business and does not purport to deal with all aspects and details
    regarding Schaeffler Group. Accordingly, neither Schaeffler Group nor any of its directors, officers, employees or advisers nor any other person makes any
    representation or warranty, express or implied, as to, and accordingly no reliance should be placed on, the accuracy or completeness of the information
    contained in the presentation or of the views given or implied. Neither Schaeffler Group nor any of its directors, officers, employees or advisors nor any
    other person shall have any liability whatsoever for any errors or omissions or any loss howsoever arising, directly or indirectly, from any use of this
    information or its contents or otherwise arising in connection therewith.
    The material contained in this presentation reflects current legislation and the business and financial affairs of Schaeffler Group which are subject to
    change.

2          November 30, 2018                            Schaeffler AG – 10th Annual Goldman Sachs Automotive Conference
Agenda

1   Schaeffler at a Glance

2   “Mobility for Tomorrow” Strategy – Agenda 4 plus One Initiatives

3   Divisional Highlights

4   Long-term value creation

3     November 30, 2018             Schaeffler AG – 10th Annual Goldman Sachs Automotive Conference

1 Schaeffler at a Glance
Schaeffler at a Glance – A global automotive and industrial supplier
Global Automotive and Industrial
supplier of high-precision
components and mechatronic
72 plants systems
Quality, technology and innovation as
18 R&D centers key success factors
Well defined strategy 'Mobility for
Tomorrow'
Above average growth and
profitability with global sales of
12-13% EUR 14 bn in 2017
EBIT margin on
average over the Well balanced customer base
last 10 years
Global footprint with 72 plants and
18 R&D centers
4 November 30, 2018 Schaeffler AG – 10th Annual Goldman Sachs Automotive Conference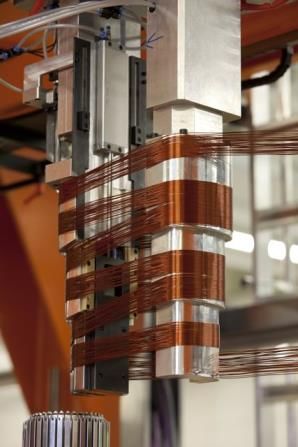
1 Schaeffler at a Glance
Schaeffler at a Glance – Diversified business portfolio with global footprint

    Sales by division FY 2017                                                                    Customer proximity – Global plants and R&D centers

    Industrial                               23%

                                 13%
    Automotive
    Aftermarket
                                                                        Automotive OEM
                                                    64%

    Sales by region FY 2017

                                                                              Asia/Pacific
                                                   10%
    Greater China                      18%

                                 21%
                                                                                                     Regions 1)                       Europe              Americas         Greater China   Asia/Pacific
                                                         51%                                         R&D centers                          10                     5                     1              2
                                                                                                     Plants                               45                    14                     8              5
    Americas                                                                       Europe
                                                                                                   1) The   regions represent the regional structure of the Schaeffler Group.

5            November 30, 2018                                 Schaeffler AG – 10th Annual Goldman Sachs Automotive Conference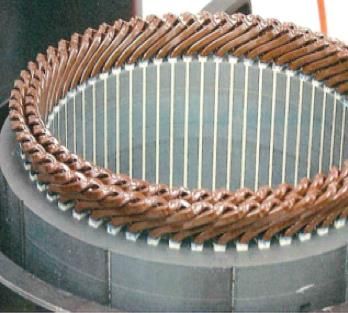
1 Schaeffler at a Glance
10-year look-back – Sales and EBIT

    Development of Sales                                                                                                         Development of EBIT2)
    2007 - 20171)                                                                                                                2007 - 20171)
    in EUR mn                                                                                                                    in EUR mn
                                                              CAGR
                                                            2007-2017
                                                              +5%
                                                                                                               14,021
                                                                                                      13,338                                                            1,736                                    1,700
                                                                                             13,179                                                                                                      1,676
                                                                                   12,124                                                                                                        1,561                   1,584
                                                                                                                                                                1,509           1,469
                                                              11,125 11,205                                                                                                             1,436
                                                   10,694

    9,013                               9,495                                                                                        1,139
                8,905
                                                                                                                                                1,040
                            7,336
                                                                                                                                                                                                                                 13%

                                                                                                                                                                                                                                 12%

                                                                                                                                                          446

    2007        2008        2009        2010        2011        2012       2013    2014       2015    2016     2017                  2007       2008     2009    2010   2011     2012    2013    2014    2015    2016    2017

    Sales growth (y-o-y)                                                                                                            Adjusted EBIT margin
     8.4%     -1.2%      -17.6%         29.4%       12.6%       4.0%        0.7%    8.2%      9.1%     3.4%    5.9%                12.6%       11.7%     6.1%   15.9%   16.2%   13.2%   12.8%    12.9%   12.7%   12.7%   11.3%

                                                                                                                                                                                 EBIT margin2)
1) 2007-2010 relates to financials of a different entity (Schaeffler VZ GmbH)                                                  2) Before special items

6               November 30, 2018                                                           Schaeffler AG – 10th Annual Goldman Sachs Automotive Conference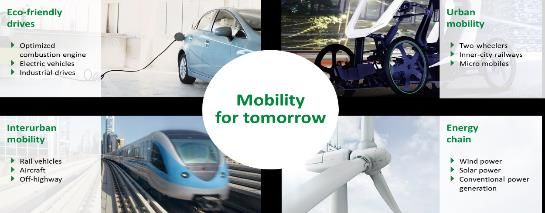
1 Schaeffler at a Glance
The Schaeffler Executive Team

    Executive Team
                                                                                               Klaus Rosenfeld (52)
                                                                                               Chief Executive Officer

                                                                                               Joined Schaeffler in 2009
                                                                                   CEO Functions

                                           Prof. Dr. Peter Pleus (64) /                         Michael Söding (56)                                 Dr. Stefan Spindler (57)
                                           Matthias Zink (49)                                   CEO Automotive Aftermarket                          CEO Industrial
                                           CEO’s Automotive OEM
                                           Joined Schaeffler in 2001/1994                       Joined Schaeffler in 2002                           Joined Schaeffler in 2015

                          Automotive OEM                                            Automotive Aftermarket                               Industrial

                 Dietmar Heinrich (55)                              Andreas Schick (48)                                     Prof. Dr.-Ing. Peter Gutzmer (65)                   Corinna Schittenhelm (51)
                 Chief Financial Officer                            Chief Operating Officer                                 Chief Technology Officer /                          Chief Human Resources Officer
                                                                                                                            Deputy CEO
                 Joined Schaeffler in 1995                          Joined Schaeffler in 1994                               Joined Schaeffler in 2001                           Joined Schaeffler in 2016
    Finance                                              Operations                                            Technology                                        Human Resources

                                                                                                 + 4 Regional CEOs

7             November 30, 2018                                             Schaeffler AG – 10th Annual Goldman Sachs Automotive Conference
Agenda

1   Schaeffler at a Glance

2   “Mobility for Tomorrow” Strategy – Agenda 4 plus One Initiatives

3   Divisional Highlights

4   Long-term value creation

8     November 30, 2018             Schaeffler AG – 10th Annual Goldman Sachs Automotive Conference
2 “Mobility for Tomorrow” Strategy – Agenda 4 plus One Initiatives
Schaeffler Roadmap 2016-2020 – Navigating through a complex environment
Roadmap Schaeffler Group Key aspects
Today Strategy „Mobility for tomorrow“ to
position Schaeffler for key future
trends
Excellence program "Agenda 4 plus
One" to make Schaeffler a better
Sustainable profitable growth company
3 divisions to enhance transparency
and accountability
Mobility for tomorrow
Rigorous execution of efficiency
initiatives to achieve financial
„Agenda 4 plus One“ ambitions
„One Schaeffler“
2016-2020
BCT dissolution
Vision
IPO Mission
Values Navigating through a
complex environment
2012 – 2016 2016 – 2020 2021 and beyond
1) Bearing & Components Technologies
9 November 30, 2018 Schaeffler AG – 10th Annual Goldman Sachs Automotive Conference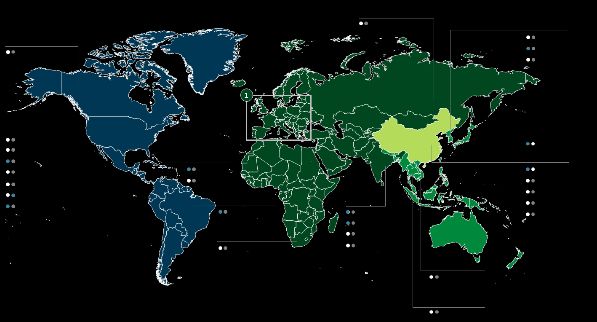
2 “Mobility for Tomorrow” Strategy – Agenda 4 plus One Initiatives
Strategy "Mobility for tomorrow" – Preferred technology partner for our customers

     Vision / Mission                                                                              4 Focus areas

     8 Strategic pillars

10         November 30, 2018                                   Schaeffler AG – 10th Annual Goldman Sachs Automotive Conference
2 “Mobility for Tomorrow” Strategy – Agenda 4 plus One Initiatives
Strategy "Mobility for tomorrow" – 8 strategic pillars
1 Preferred
technology partner 2 Automotive and
Industrial supplier 3 Components and
systems 4 Global player with
local presence
One Schaeffler
Approach
5 E-Mobility,
Industry 4.0, and
digitalization
6 Quality, efficiency
and delivery
performance
7 Attractive employer
8 Global family
business
11 November 30, 2018 Schaeffler AG – 10th Annual Goldman Sachs Automotive Conference2 “Mobility for Tomorrow” Strategy – Agenda 4 plus One Initiatives
Automotive and Industrial Supplier – Balanced business portfolio
Pro Forma –
Sales 9M 2018 EBIT1) 9M 2018 SVA2) LTM Sept 2018 For illustration purposes
EBIT Margin
~15%
24% 11.8% 26%
63% ~45%
52%
13%
22% ~40%
EBIT Margin EBIT Margin
Engine 20% 18.3% 8.8%
Automotive
Transmissions 29% OEM
E-Mobility 3% Automotive
EUR 10,714 mn EUR 1,150 mn EUR 721 mn Aftermarket
Chassis 11%
Industrial
Automotive OEM accounts for 63% of Industrial and Automotive Aftermarket Schaeffler manages its business primarily by
Group sales contribute nearly 50% of Group EBIT1) Schaeffler Value Added (SVA)3)
Powertrain business (52%) includes growing Resilient high margin Aftermarket business Automotive Aftermarket contributes
E-Mobility business; Chassis business and improving profitability in Industrial around 40% of Group SVA3) reflecting its
division (11%) agnotistic to evolving significance
powertrain mix
2) Defined as LTM EBIT before special items minus Cost of Capital (10% * Ø Capital
1) Before special items Employed); Goodwill allocated to Automotive OEM (Indicative calculation)
12 November 30, 2018 Schaeffler AG – 10th Annual Goldman Sachs Automotive Conference2 “Mobility for Tomorrow” Strategy – Agenda 4 plus One Initiatives
Components and Systems – Enriching our core competencies
Key aspects
System Understanding /
Industry 4.0 Long-standing experience in development and
manufacturing of best-in-class mechanical components
Proven system-level understanding enabling integration of
Mechatronic
Systems components into powerful mechatronic systems
Ability to combine systems know-how across all three
divisions into new innovative product and service offerings
Mechanical
Systems
Components
Systems understanding as a
Automotive OEM Industrial key success driver
Automotive Aftermarket
13 November 30, 2018 Schaeffler AG – 10th Annual Goldman Sachs Automotive Conference2 “Mobility for Tomorrow” Strategy – Agenda 4 plus One Initiatives
Excellence program "Agenda 4 Plus One" – Completion ratio increased to 50%2)
Agenda 4 plus One 20 strategic initiatives
Customer Focus Operational Excellence
1 Customer Excellence
4 Quality for Tomorrow
5 Global Footprint
2 E-Mobility
6 Factory for Tomorrow
3 Industry 4.0
2) 7 Shared Services
17 Global Supply Chain
8 Process Excellence
Leadership and Talent 18 Aftermarket Kitting Operation
Management (AKO)
10 Leadership & Corporate Values
Financial Flexibility
11 Qualification for Tomorrow
9 Working Capital
12 New Work
19 Global Reporting
Comprehensive program increased to 20 initiatives
Long-term Competitiveness and Value Creation
EUR 300 mn profitability improvement potential until 20221) and over 14 IT 2020
EUR 1 bn of additional investment 13 Program CORE
16 Global Branding
15 Digital Agenda
Each initiative driven by Board sponsor and supported by a business case 20 Focus
3)
1) Compared to FY 2017 2) For all 20 initiatives, as of Sep 30, 2018 3) Real Estate optimization
14 November 30, 2018 Schaeffler AG – 10th Annual Goldman Sachs Automotive Conference2 “Mobility for Tomorrow” Strategy – Agenda 4 plus One Initiatives
Rigorous execution of efficiency initiatives – Continuously improving our performance
Overview initiatives
Start Date Cost Efficiency HCO1) Reduction Restructuring Full Financial Focus Completion
Target Target Cost Impact Ratio
1 EUR 36 mn
CORE I 10/2015 ~ EUR 40 mn -500 12/2018 Industrial 100%
booked in 2015
EUR 45 mn
2 CORE II 10/2016 ~ EUR 80 mn -400 12/2019 Industrial >50%
booked in 2016
EUR 39 mn
3 Shared Services 10/2017 ~ EUR 25 mn -100 12/2022 Group 35%
booked in 2017
Auto OEM/
4 BCT2) 5/2018 ~ EUR 60 mn -1,000 EUR [50] mn3) 12/2021 5%
Industrial
+ FCF Improvement
Target
5 Working Capital4) 4/2016 ~ EUR 350 mn - - 12/2020 Group 75%
New
6 Supply Chain5) 8/2018 to come - - 12/2021 Group 0%
1) HCO = Headcount 3) Best estimate for 2018
2) On-top initiatives outside of Agenda 4 plus One 4) Focused on Trade Payables and Receivables 5) Focused on delivery performance and inventories
15 November 30, 2018 Schaeffler AG – 10th Annual Goldman Sachs Automotive ConferenceAgenda 1 Schaeffler at a Glance 2 “Mobility for Tomorrow” Strategy – Agenda 4 plus One Initiatives 3 Divisional Highlights 4 Long-term value creation 16 November 30, 2018 Schaeffler AG – 10th Annual Goldman Sachs Automotive Conference
3 Divisional Highlights
Schaeffler Group – Diversified business portfolio with three divisions

     Automotive OEM                                                                     Automotive Aftermarket                                            Industrial

                                                                     64%3)                                                                  13%3)                                                                 23%3)
                 Sales1)                          8,991 mn                                           Sales1)                  1,880 mn                                 Sales1)                  3,150 mn

           EBIT margin2)                               10.8%                                     EBIT margin2)                  19.0%                              EBIT margin2)                    8.0%

     Chassis                      18%                                 E-Mobility                                                       OES business                                              Wind
                                                 5%                                                                    18%                                            10% 7%
     Systems                                                                                                                                                                      8%             Raw Materials
                                                                                        Solutions business
                                                                                                                                                                                                 Aerospace
                                                                                                                                                                      11%           5%
                                                                                                                                                                                                 Rail
                                                                                                                                                             32%                                 Offroad
                       31%                                                                                             82%                                                             9%
                                                      47%                                                                                                                                        Two-Wheelers
     Engine                                                      Transmission                                                                                                          5%        Power Transmission
                                                                                                                                        Components                               11%             Industrial Automation
     Systems                                                          Systems                                                                                         13%
                                                                                                                                           business                                              Industrial Distribution

                                                      Based on 2017 Sales                                                       Based on 2017 Sales                                         Based on 2017 Sales

 1) FX adjusted Sales FY 2017                             3) in % of Group Sales 2017
 2) Based on EBIT Before special items FY 2017

17             November 30, 2018                                                        Schaeffler AG – 10th Annual Goldman Sachs Automotive Conference
3 Divisional Highlights
1 Automotive OEM – At a Glance
Sales and EBIT margin3) Sales by business division3)
in EUR mn
18% 5% E-Mobility
Chassis
Systems
31%
Engine 47% Transmission
8,991 Systems Systems
64%4)
8,525 Sales FY2017: EUR 8,991 mn
Sales split by customer mix
2016 2017 2018e
2018
Guidance 40%
Growth rate1) +4.8% +6.5% +3.5-4.5%
EBIT margin2) 12.8% 10.8% 8-8.5% 60%
1) FX-adjusted
2) Before special items
3 FY 2017 Top 10 automotive customers
4) In % of Group Sales 2017 Other customers
18 November 30, 2018 Schaeffler AG – 10th Annual Goldman Sachs Automotive Conference3 Divisional Highlights
Powertrain evolution – Our E-Mobility Strategy
More than 30
customer projects and
ICE HEV BEV 8 series contracts
Vision Powertrain E-Mobility Production Roadmap
Global vehicle production [in mn units]
117
110 70%
102
12%
90 30%
4% 11%
33%
40%
95% 86%
2017 2018 2019 2020 2021 2022
55%
Hybrid Module Gen.2 and 2-speed E-Axle Transmissions for HEV
30% applications in Series production
Coaxial and parallel design 1-speed E-Axle Transmission for BEV
application Europe SOP in process
2017 2020 e 2025 e 2030 e Hybrid Module Gen.3 with integrated Torque Converter to follow
Source: IHS and Schaeffler Assumptions / Values based on Light Vehicles < 6 tons only, ICE = Internal Combustion Engine; HEV = Hybrid Electric Vehicles 12/2018
ranging from 48V Mild Hybrid to PHEV, BEV = Battery Electric Vehicles (incl. Fuel Cell Electric Vehicles)
19 November 30, 2018 Schaeffler AG – 10th Annual Goldman Sachs Automotive Conference3 Divisional Highlights
E-Mobility – Content per vehicle
excl. Aftermarket, Heavy
Duty & Motorcycles
Content per Vehicle 1)
in EUR 1 ICE 2 HEV 3 BEV
x 2.5
x 1.5 ~150 x 4.0
~125
~100
~90
~60
~25
2016 2025 2016 2025 2016 2025
90 mn 56 mn 3 mn 39 mn 0.5 mn 16 mn
Average Content per Vehicle 2025
~EUR 130 2)
~6% CAGR 3) - mn No. of light vehicles2)
1) Average Schaeffler Content per light Vehicles produced world wide (excluding Aftermarket, Heavy Duty & Motorcycles content) 2) according to Schaeffler Accelerated Scenario 3) Market Growth 2016-2025: 1.8% (Source: IHS; July 2017) + Content per Vehicle growth ~4%
20 November 30, 2018 Schaeffler AG – 10th Annual Goldman Sachs Automotive Conference3 Divisional Highlights
2 Automotive Aftermarket – At a Glance
Sales and EBIT margin3) Sales by region3)
in EUR mn
Americas
Europe 21%
3% China
2%
Asia/Pacific
1,880
13%4) 73%
1,813 Sales FY2017: EUR 1,880 mn
Sales split by channel
OES business
2016 2017 2018e
2018 18%
Guidance Solutions business
Growth rate1) +10.6% +3.2% +1.5-2.5%
EBIT margin2) 21.3% 19.0% 17-17.5%
82%
Components
1) FX-adjusted business
2) Before special items
3) FY 2017
4) In % of Group Sales 2017
21 November 30, 2018 Schaeffler AG – 10th Annual Goldman Sachs Automotive Conference3 Divisional Highlights
Growth drivers in the Independent Aftermarket – Components and Solutions
Components Solutions Outlook
Traditional business with Complete sets and kits for Trends in OEM business fuel future
replacements parts plug n' play repair solutions Aftermarket potential
Growing with global vehicle fleet Increasing vehicle complexity leads Repair solutions will remain core
Growing with average vehicle age to increasing need for information growth driver going forward
on workshop level Additional aftermarket potential
Total repair costs are dominated from intelligent repair solutions
by labour costs, driving more and for E-axles and hybrid modules
more comprehensive, all-in-one
quality repairs
22 November 30, 2018 Schaeffler AG – 10th Annual Goldman Sachs Automotive Conference3 Divisional Highlights
Dedicated pull strategy for whole value chain – Workshop satisfaction key for success
The 7 levels of our market Top 7 player
NPS* 71
Pull Strategy along all distribution levels 55
53
50,000+ workshops trained p.a.
Plants SAAM Distributors Workshop Consumers 5,000 distributors globally 2016
Supplier of the Year
Market leader in Europe and Americas
Garage or Workshop
Independent
distributor
distributor
distributor
IAM
* Our Net Promoter Score - Workshop Level
Regional
National
IAM
Local
Producer of repair solutions:
Value proposition – 7 elements Excellent satisfaction
Producer of parts
on workshop level
OE & Non-OE
Know-how
Motorist
and Tools 87 Product
Franchise Dealer Pricing Availability 87 Program/Systems
Supra-National
88 Availability
Distribution
Distribution
National
Product
Distribution
OES
OES
76 Know-how and tools
OES
OES
Service
Local
CRM Customer 86 Customer service
Program/ 85 CRM
Systems
Source: 2016 customer satisfaction survey 0 … 100 score
23 November 30, 2018 Schaeffler AG – 10th Annual Goldman Sachs Automotive Conference3 Divisional Highlights
3 Industrial – At a Glance
Sales and EBIT margin3) Sales by region3)
in EUR mn
15% 9% Asia/Pacific
Greater China
18%
3,150 Americas Europe
23%4) 57%
3,000 Sales FY2017: EUR 3,150 mn
Industrial sales by sector cluster
2016 2017 2018e Wind
2018 10% 7%
8% Raw Materials
Guidance
Aerospace
Growth rate1) -4.8% +5.7% +8-9% 11% 5%
Rail
EBIT margin2) 7.3% 8.0% 10.5-11% 32% Offroad
9%
Two-Wheelers
5% Power Transmission
1) FX-adjusted 11% Industrial Automation
2) Before special items 13%
Industrial Distribution
3) FY 2017
4) In % of Group Sales 2017
24 November 30, 2018 Schaeffler AG – 10th Annual Goldman Sachs Automotive Conference3 Divisional Highlights
Broad range of standard and customized products
Portfolio Region Sector split Channel
Industry 4.0 services
Wind
Industry 4.0
Mechatronics Raw
Materials
Europe
Aerospace
OEM & MRO
Railway
Mechanical Systems
Offroad
Two
Wheelers
Americas
Power
Components Transmission
Greater
Distribution
China
Industrial
Automation
Asia Pacific
Rotative Services Linear
Technology Technology
25 November 30, 2018 Schaeffler AG – 10th Annual Goldman Sachs Automotive Conference3 Divisional Highlights
Mechatronics & Industry 4.0 Services – Hanover Fair 2018
Showcase SPIT – E-Motors Showcase PERLENBACH – Pumps
Handling of SmartCheck + Plain text messages SmartQB +
easy access to the Schaeffler autonomous relubrication +
Services Cloud & digital services openness Smart Ecosystem: Entry level
Presentation customer reference + Presentation customer reference +
value proposition value proposition
Product- & service- portfolio Product- & service- portfolio
Showcase ZF – Showcase SSI
Transmission SCHÄFER – Logistics
Cloud-to-Cloud communication + Condition Monitoring-solution
Schaeffler Domain-Knowhow + and automated relubrication
openness of the Smart for logistics
Ecosystems: Digital service Presentation customer
without mechatronics reference + value proposition
Presentation customer reference + Product- & service- portfolio
value proposition
Product- & service- portfolio
26 November 30, 2018 Schaeffler AG – 10th Annual Goldman Sachs Automotive ConferenceAgenda 1 Schaeffler at a Glance 2 “Mobility for Tomorrow” Strategy – Agenda 4 plus One Initiatives 3 Divisional Highlights 4 Long-term value creation 27 November 30, 2018 Schaeffler AG – 10th Annual Goldman Sachs Automotive Conference
4 Long-term value creation
Sustainable value creation – Four main building blocks
Building blocks Key aspects
Growth
Outperformance 3 divisions with different business
1 in Automotive Consistent growth above markets characteristics and value drivers
OEM
Resilient Aftermarket business
compensates for Automotive OEM and
Value
High margin in Industrial business
2 Automotive Resilient high margin business growing with market Strong Free Cash Flow generation as a
Aftermarket Profitablefocus
key management growth
and sustainable
Margin value creation
Margin upside
3 Continuously improving margin to 11-13%
in Industrial
Cash Profitable growth
flow
Strong Free and sustainable
4 Cash flow Strong operating Cash flow generation value creation
generation
28 November 30, 2018 Schaeffler AG – 10th Annual Goldman Sachs Automotive Conference4 Long-term value creation
Use of cash – Focus on future growth and attractive dividend
Our Cash Flow formula Key aspects
+ Operating Cash Flow1) Strong cash flow generation from operating business and 3
main uses of cash:
Cash
Δ Working Capital
generation +/- 1 Dividend
- Capex (Internal Growth)
Use
= Free Cash Flow of
Δ Cash
2 External Growth Cash 3 Deleveraging
1
- Regular Dividend
2
Above average annual dividend pay-out (30-40% of net
Cash income3))
usage
- M&A2) (External Growth)
+ Financing Proceeds Internal growth financed from operating cash-flow,
3
external growth primarily by debt
- Deleveraging
Sound balance sheet, sufficient financing headroom to
target external growth
1) Before Δ Working Capital
2) Includingone-off long-term investment projects (i.e. Real estate)
3) Adjusted for one-offs
29 November 30, 2018 Schaeffler AG – 10th Annual Goldman Sachs Automotive Conference4 Long-term value creation
Free Cash Flow details YTD 2018 – Capex Ratio Q3 at 7.4%
Free Cash Flow FY 2017 Target: Key aspects
in EUR mn FCF ~ EUR
500mn1)
FCF before M&A at EUR 201 mn in Q3’18 (PY: EUR 333 mn), FCF
-119 mn
vs 9M 2017
conversion ratio 17%
333 Lower EBIT and higher inventory level as main drivers for lower FCF
244 before M&A
202
Capex to sales ratio reduced to 7.4% in Q3’18 (Q3'17: 8.1%), showing
more disciplined Capex spending
41
-5
-71 FCF Details Q3 Q3 ∆ Q3 9M 9M ∆ 9M
-130 in EUR mn 2017 2018 17/18 2017 2018 17/18
FCF as
Q1 17 Q2 17 Q3 17 Q4 17 Q1 18 Q2 18 Q3 18 333 202 (131) 244 126 (118)
reported
FCF Non recurring
before M&A -111 25 333 268 -69 -5 201 10 9 (1) 103 85 (18)
items1)
FCF AKO / EDC/
conversion
30% 18% 21% 22% 24% 22% 17% 26 7 (19) 66 33 (33)
Focus2)
ratio4)
8.4% 8.5% 8.1% 11.3% 8.6% 7.9% 7.4% M&A3) 0 (1) (1) 3 1 (2)
Capex ratio5)
Receivable
1) Including payments for legal cases and restructuring measures (54) (47) 7 (54) (47) 7
2) Capex in major logistic projects Aftermarket Kitting Operation (AKO), European Distribution Center (EDC) and initiative Focus
Sale Program
3) Cash in- and outflows for M&A activities
4) LTM FCF before M&A divided by LTM EBITDA before special items 315 170 (145) 362 198 (164)
5) Capex in % of sales
30 November 30, 2018 Schaeffler AG – 10th Annual Goldman Sachs Automotive Conference4 Long-term value creation
M&A strategy – Focus on technology and execution
7 Search fields Key aspects
(Power)
E-Motor Electronics
Clearly defined M&A strategy based on 7 search fields with
Manufacturing Industry 4.0 /
Mechatronics focus on technology, innovation and smaller add-on
Competence
acquisitions
Systems Expertise on
Chassis
Sector Levels
Target transaction sizes to vary between EUR 100 – EUR 500
mn, strategic/cultural fit and value contribution as most
2 important acquisition criteria
Automotive
1 4
Aftermarket 3 Industrial 4 acquisitions made so far, growing M&A pipeline, disciplined
Automation
execution is key to success
Automotive Industrial
M&A transactions announced until November 30:
Focus on technology
1 2 3 4 and execution
12/2016 10/2017 8/2018 11/2018
31 November 30, 2018 Schaeffler AG – 10th Annual Goldman Sachs Automotive Conference4 Long-term value creation
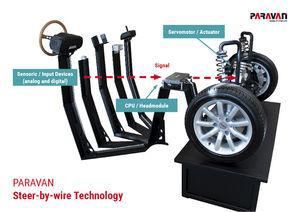
“Steer by wire" Acquisition – Positioning Chassis business for autonomous driving growth potential
“Steer by wire” – Key aspects Selected components of the "Steer by wire"-technology
▪ Steer by wire is a key-enabling technology for the fast-growing market
segment autonomous driving
▪ Paravan’s unique SPACE DRIVE technology is the only Steer-By-Wire
System in the market which:
▪ is road approved (> 500 Mio. Kilometers)
▪ meets latest safety regulation standards
▪ can operate also braking and secondary vehicle functions
▪ can be scaled in to mass production
Steer-By-Wire Systems 9bn Acquisition – Key aspects
Market Development in EUR CAGR 2025-2035
~ 25%
▪ Schaeffler acquires "Drive by wire"-technology from Paravan and its
founder Roland Arnold
5.7bn
▪ Schaeffler establishes Joint Venture with Paravan founder (90%/ 10%)
to develop and further industrialize the technology
▪ Acquired technology allows Schaeffler to enter the very attractive and
fast-growing "Drive by wire"-market in an accelerated manner4 Long-term value creation
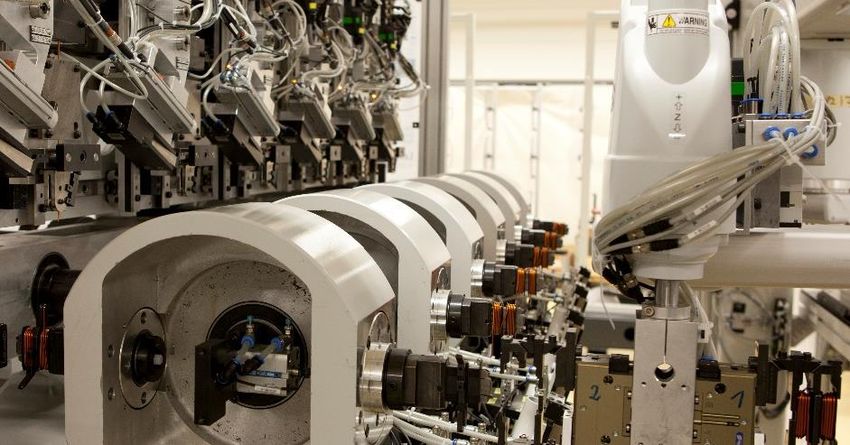
Elmotec Statomat Acquisition – Another key step to implement our E-Mobility strategy
Elmotec Statomat – Key aspects Innovative technology & production processes
▪ Elmotec is a pioneer in the production of stator manufacturing
machines and one of the leading suppliers of machines for the
production of stators for electric motors, alternators and generators
▪ The headquarter of Elmotec Statomat GmbH is located in Karben near
Frankfurt am Main (Germany). Elmotec has around 200 employees
▪ Elmotec has been focusing on the round wire, flatwire and continuous-
hairpin process technologies, and holds over 50 patents for innovative
winding technology (e.g. wave-winding)
Expertise in winding-technology for E-Mobility Acquisition – Key aspects
▪ Schaeffler acquires 100% of Elmotec Statomat GmbH from its two
founders who remain in charge operationally
▪ Elmotec Statomat will be integrated within the E-Mobility business
division
▪ The acquisition complements Schaeffler’s E-Motor mass production
and industrialization capabilities
▪ Closing expected in Q1 2019
Round wire winding Flat wire wave-winding Continuous Hairpin
33 November 30, 2018 Schaeffler AG – 10th Annual Goldman Sachs Automotive ConferenceIR Contact
Investor Relations
Phone: + 49 9132 82 4440
Email: ir@schaeffler.com
Web: www.schaeffler.com/ir
34 November 30, 2018 Schaeffler AG – 10th Annual Goldman Sachs Automotive ConferenceBackup - Financial Highlights Q3 2018
1 Sales growth Q3'18 +3.7%1) – Region Americas and Greater China with highest growth rates
Sales Key aspects Q3'18
in EUR mn
+5.1%1)
Group sales up by +3.7%1) (Q3'17: +7.4%1)), all regions
vs 9M 2017
contributed
3,574 3,472 3,434 3,541 3,551
Sales growth mainly driven by Americas (+7.6%) and Greater
3,642 3,521
China (+6.6%, thereof: AOEM +2.5%; AAM +37.3%; Industrial
+17.6%)
10,480 10,714
Sales by region Q3 2018
Q1 Q2 Q3 Q4 Q1 Q2 Q3 y-o-y growth w/o FX effects
Asia/Pacific
+2.5%
2017 2018
Greater China 11%
Reported growth +6.9% +3.1% +5.2% +5.4% -0.6% +4.9% +2.5%
+6.6%
Sales growth1)
18%
+5.4% +2.2% +7.4% +8.5% +3.9% +7.9% +3.7%
50%
21%
Americas Europe
1) FX-adjusted
+7.6% +1.5%
35 November 30, 2018 Schaeffler AG – 10th Annual Goldman Sachs Automotive ConferenceBackup - Financial Highlights Q3 2018
2 EBIT Margin Q3’18 10.1% – 2.0%-pts. below prior year quarter
EBIT1) Key aspects Q3'18
in EUR mn
Gross profit margin decreased from 28.1% to 26.5% mainly
-46 mn driven by ramp up costs, project delays in China and higher
vs 9M 2017
production costs (including higher raw material prices)
435
416
388 391 4043)
Increase in administration expenses driven by Agenda 4 plus
3452) 3554)
One initiatives
Reported EBIT includes EUR 21 mn positive special item
1,196 1,150
Q1 Q2 Q3 Q4 Q1 Q2 Q3
EBIT margin1)
2017 2018 Q1‘17 Q2'17 Q3'17 Q4'17 Q1'18 Q2'18 Q3'18
EBIT margin1) 12.2% 9.9% 12.1% 11.0% 11.0% 11.1% 10.1% Automotive
11.9% 9.4% 10.7% 11.2% 9.5% 9.0% 7.9%
OEM
Automotive
19.2% 15.3% 23.1% 17.9% 17.9% 20.0% 16.8%
Aftermarket
Industrial 8.6% 8.5% 8.9% 6.1% 11.4% 11.8% 12.1%
1) Before special items
2) Reported EBIT of EUR 358m including EUR 13m positive special item
3) Reported EBIT of EUR 382m including EUR 22m restructuring expenses related to the dissolution of the internal supplier BCT Total 12.2% 9.9% 12.1% 11.0% 11.0% 11.1% 10.1%
4) Reported EBIT of EUR 358m including EUR 21m positive special item
36 November 30, 2018 Schaeffler AG – 10th Annual Goldman Sachs Automotive ConferenceBackup - Financial Highlights Q3 2018
A Automotive OEM – 5.2%-pts. outperformance versus market in Q3'18
Automotive OEM sales and market development Q3 Sales by business division
in EUR mn
Europe Americas Greater China Asia/Pacific
Q3 2017 Q3 2018 1)
+9.9%
Engine Systems 669 691 +4.1%
+1.6% +2.2% +2.5%
Transmission Systems 992 996 +1.2%
-0.7%
-3.3% -3.3% -2.4%
E-Mobility 103 128 +25.3%
World production: -2.0%
Schaeffler Automotive OEM: +3.2%1) Chassis Systems 374 376 +1.3%
Production of light vehicles Q3 2018 vs Q3 2017 (IHS) Total 2,138 2,191 +3.2%
Sales growth1) Schaeffler Automotive Q3 2018 vs Q3 2017
Outperformance by quarter 8.1%
Key aspects Q3'18
5.0% 5.2% Outperformance Q3'18 of 5.2%-pts. versus global
3.6% 3.5%
production growth
1.9%
0.6% All Regions outperforming despite weak market
environment
Q1 17 Q2 17 Q3 17 Q4 17 Q1 18 Q2 18 Q3 18 FY 18e Business division E-Mobility with over 25% growth in Q3
Growth rate
6.4% 3.5% 7.4% 8.7% 3.2% 6.5% 3.2% 3.5-4.5%
Automotive OEM1)
LVP growth2) 5.8% 0.1% 2.4% 0.6% -0.3% 4.6% -2.0% 0.7% 1) FX-adjusted 2) Source: HIS Markit, as of October 2018
37 November 30, 2018 Schaeffler AG – 10th Annual Goldman Sachs Automotive ConferenceBackup - Financial Highlights Q3 2018
A Automotive OEM – Q3 EBIT margin2) of 7.9% (Q3'17: 10.7%)
EBIT1) Q3 2017 vs. Q3 2018 Key aspects
in EUR mn
Gross margin declined from 25.6% to
23.1% mainly driven by ramp up
costs, project delays in China and
229
higher production costs (including
+1 higher raw material prices)
172
-412) -5 Increase in administration expenses
-12
driven by Agenda 4 plus One
initiatives
EBIT margin 7.9% in Q3'18 after
10.7% in Q3'17
EBIT Gross R&D Selling Administrative Others EBIT
Q3 2017 Profit expenses expenses expenses Q3 2018
EBIT margin
development1) 10.7% -2.5%-pts +0.3%-pts -0.2%-pts -0.5%-pts +0.1%-pts 7.9%
1) Before special items 2) Includes postive FX effects of EUR 4 mn
38 November 30, 2018 Schaeffler AG – 10th Annual Goldman Sachs Automotive ConferenceBackup - Financial Highlights Q3 2018
A Automotive OEM – Schaeffler e-Axle transmission is driving the brand new Audi eTron Quattro
E-Axle subsystems 2018 Schaeffler‘s new Lightweight E-Axle Transmissions for the Audi eTron Quattro
SOP Q3/2018 Schaeffler supplies both E-Axle
Power Electronics Transmissions for the new Audi eTron
Quattro
Both E-Axles are based on Schaeffler‘s
E-Machines patented Lightweight Differential
technology
The rear axle is build in coaxial design and
Rear: sets a new benchmark in power density
E-Axle Transmission Coaxial design (230 Nm/kg).
1-speed E-Axle
Transmission The front axle is build in parallel design
and includes a parking lock with electro-
Front: mechanical actuator
Actuators
Parallel design 1-
speed E-Axle
Best-in class
Transmission with
power density for
integrated electr.
Software E-Axle transmissions:
mech. parking lock
230 Nm/kg
39 November 30, 2018 Schaeffler AG – 10th Annual Goldman Sachs Automotive ConferenceBackup - Financial Highlights Q3 2018
B Automotive Aftermarket – High comps in Region Americas and temporary lower sales in Europe
Automotive Aftermarket sales by quarter Sales by region
in EUR mn y-o-y growth Q3 2017 Q3 2018 1)
+1.3%1)
vs 9M 2017
Europe 375 355 -4.3%
484 506 446 479 476
444 446
Americas 106 89 -6.3%
1,434 1,401 Greater China 14 19 +37.3%
Q1 Q2 Q3 Q4 Q1 Q2 Q3 Asia/Pacific 11 13 +16.3%
2017 2018 Total 506 476 -3.0%
Sales growth1) +9.7% -7.3% +4.7% +6.3% -4.4% +12.3% -3.0%
Automotive Aftermarket sales growth by channel Q3 20181) Key aspects
Negative sales growth1) of -3.0% in Q3’18
IAM2)
Q3 2017
Lower sales driven by lower demand from European key
OES3)
Q3 2018 customers and high comps of OES business in Americas
Total Unexpected weakness in Q3’18 cannot be compensated in
-15% -10% -5% 0% 5% 10% 15% 20%
Q4’18; FY sales growth1) guidance adjusted to 1.5-2.5%
1) FX-adjusted 2) Independent Aftermarket 3) Original Equipment Service
(previously: 3-4%)
40 November 30, 2018 Schaeffler AG – 10th Annual Goldman Sachs Automotive ConferenceBackup - Financial Highlights Q3 2018
B Automotive Aftermarket – Q3 EBIT margin2) of 16.8% (Q3'17: 23.1%)
EBIT1) Q3 2017 vs. Q3 2018 Key aspects
in EUR mn
Gross margin decreased from 38.1% to
34.7% of sales, mainly driven by higher
production costs and price pressure in
117
some markets
Selling expenses higher mainly driven
80
-282) 0 -7 0
by increased spending for logistics and
-2
temporary higher marketing activities
EBIT margin 16.8% in Q3'18 after
23.1% in Q3’17
EBIT Gross R&D Selling Administrative Others EBIT
Q3 2017 Profit expenses expenses expenses Q3 2018
EBIT margin
development1) 23.1% -3.4%-pts -0.1%-pts -2.1%-pts -0.6%-pts -0.1%-pts 16.8%
1) Before special items 2) Includes negative FX effects of EUR -5 mn
41 November 30, 2018 Schaeffler AG – 10th Annual Goldman Sachs Automotive ConferenceBackup - Financial Highlights Q3 2018
C Industrial Division – All sectors and regions growing in Q3
Industrial sales by quarter Sales by region
in EUR mn
+9.8%1) y-o-y growth Q3 2017 Q3 2018 1)
vs 9M 2017
826 855 854 Europe 446 469 +6.3%
782 808 790 770
Americas 139 150 +10.1%
2,380 2,535
Greater China 130 151 +17.6%
Q1 Q2 Q3 Q4 Q1 Q2 Q3
Asia/Pacific 75 84 +12.4%
2017 2018
Total 790 854 +9.4%
Sales growth1) +0.2% +4.5% +9.2% +9.0% +10.8% +9.3% +9.4%
Industrial sales by sector cluster Q3 20181) Key aspects
Raw Materials
Railway Sales growth1) of 9.4% in Q3'18
Power Transmission
Two-Wheelers Very strong growth driven by all sectors as well as Industrial
Wind
Distribution
Industrial Automation
Aerospace
Sector Wind back on growth path on behalf of stronger
Offroad
Industrial Distribution demand in China
0% +10% +20% +30%
1) FX-adjusted
42 November 30, 2018 Schaeffler AG – 10th Annual Goldman Sachs Automotive ConferenceBackup - Financial Highlights Q3 2018
C Industrial Division – Q3 EBIT margin2) of 12.1% (Q3'17: 8.9%)
EBIT1) Q3 2017 vs. Q3 2018 Key aspects
in EUR mn
Gross margin increased to 30.8%
(Q3'17: 28.4%) driven by positive
volume effects and favourable pricing
+392)
103 Successful execution on CORE3) –
-1 CORE I program completed, CORE II
-3 -1 -1
70 program well on track (Completion ratio
of 40%)
EBIT margin 12.1% in Q3’18 vs. 8.9% in
Q3'17
EBIT Gross R&D Selling Administrative Others EBIT
Q3 2017 Profit expenses expenses expenses Q3 2018
EBIT margin
development1) 8.9% +2.4%-pts +0.2%-pts +0.6%-pts +0.2%-pts -0.2%-pts 12.1%
1) Before special items 2) Includes negative FX effects of EUR -4 mn 3) Cost efficiency initiative
43 November 30, 2018 Schaeffler AG – 10th Annual Goldman Sachs Automotive ConferenceBackup - Financial Highlights Q3 2018
Guidance FY 20185) – Adjustment triggered by Automotive OEM business in China
Group Guidance Divisional Guidance
Old4) New5) Automotive OEM Automotive AM Industrial
Sales growth1) +3.5-4.5% +1.5-2.5%
+5-6% +4-5% (before 4.5-5.5%)
+8-9%
(in %) (before 3-4%)
EBIT margin2) 8-8.5% 17-17.5% 10.5-11.0%
10.5-11.5% 9.5-10.5% (before 8.5-9.5%) (before 10-11%)
(in %) (before 16.5-17.5%)
Free Cash Flow3) EUR ~450 mn EUR ~300 mn
(in EUR mn)
Market assumptions5)
Automotive: Global Light Vehicle production growth revised down from around
2% to around 0.5%
Automotive Aftermarket: Stable growth in the global vehicle population and a
nearly unchanged average vehicle age
Industrial: Similar growth rate of industrial production in 2018 compared to 2017 1) FX adjusted
2) Before special items
4) As of September 19, 2018
5) As of October 30, 2018
3) Before cash in- and outflows for M&A activities
44 November 30, 2018 Schaeffler AG – 10th Annual Goldman Sachs Automotive ConferenceBackup - Financial Highlights Q3 2018
Guidance FY 2018 – Adapting execution to a more complex market environment
Sharp expected market decline of China Light Vehicle Production/Sales is the key catalyst
1 for reducing FY 2018 Group and Automotive OEM Guidance for sales and EBIT margin
Softness in Automotive Aftermarket Q3 sales due to lower demand from European
2 customers cannot be compensated in Q4, FY 2018 margin guidance at 17-17.5%
Industrial Division on track, favorable development of Industrial sales continues,
Adapting execution
3
FY 2018 margin guidance at 10.5-11%
to a more complex
market environment
4 Further short-term cost discipline measures initiated, while preserving our flexibility
Increased focus on cash generation (stronger inventory reduction, stricter capex
5 allocation), dividend policy unchanged (30-40% payout ratio)
45 November 30, 2018 Schaeffler AG – 10th Annual Goldman Sachs Automotive ConferenceBackup
Key figures1) by Group and division – new structure
Group Automotive Aftermarket
in EUR mn in EUR mn
Q1 '17 Q2 '17 Q3 '17 Q4 '17 Q1 '18 Q2 '18 Q3 '18 Q1 '17 Q2 '17 Q3 '17 Q4 '17 Q1 '18 Q2 '18 Q3 '18
Sales 3,574 3,472 3,434 3,541 3,551 3,642 3,521 Sales 484 444 506 446 446 479 476
Sales Growth2) +5.4% +2.2% +7.4% +8.5% +3.9% +7.9% +3.7% Sales Growth2) +9.7% -7.3% +4.7% +6.3% -4.4% +12.3% -3.0%
EBIT 435 358 416 319 391 382 376 EBIT 93 68 117 55 80 96 83
EBIT Adjusted3) 435 345 416 388 391 404 355 EBIT Adjusted3) 93 68 117 80 80 96 80
EBIT Margin3) 12.2% 9.9% 12.1% 11.0% 11.0% 11.1% 10.1% EBIT Margin3) 19.2% 15.3% 23.1% 17.9% 17.9% 20.0% 16.8%
More than 30 customer projects and 8 series contracts
Automotive OEM Industrial
in EUR mn in EUR mn
Q1 '17 Q2 '17 Q3 '17 Q4 '17 Q1 '18 Q2 '18 Q3 '18 Q1 '17 Q2 '17 Q3 '17 Q4 '17 Q1 '18 Q2 '18 Q3 '18
Sales 2,308 2,220 2,138 2,325 2,279 2,308 2,191 Sales 782 808 790 770 826 855 854
Sales Growth2) +6.4% +3.5% +7.4% +8.7% +3.2% +6.5% +3.2% Sales Growth2) +0.2% +4.5% +9.2% +9.0% +10.8% +9.3% +9.4%
EBIT 275 221 229 226 217 197 185 EBIT 67 69 70 38 94 89 108
EBIT Adjusted3) 275 208 229 261 217 207 172 EBIT Adjusted3) 67 69 70 47 94 101 103
EBIT Margin3) 11.9% 9.4% 10.7% 11.2% 9.5% 9.0% 7.9% EBIT Margin3) 8.6% 8.5% 8.9% 6.1% 11.4% 11.8% 12.1%
1) Proforma figures 3) EBIT before special items
2) FX-adjusted
46 November 30, 2018 Schaeffler AG – 10th Annual Goldman Sachs Automotive ConferenceYou can also read