MAY 2018 - Independent We Stand
←
→
Page content transcription
If your browser does not render page correctly, please read the page content below
M AY 201 8

HOME SWEET HOME: LOCALS VS. AMAZON | 2018
INTRODUCTION
Civic Economics is pleased to present Independent We Stand (IWS), the North American Retail
Hardware Association (NRHA), and the Paint and Decorating Retailers Association (PDRA) with
this, the third in a series of analyses of the economic impact of supporting independent hardware,
building supply, power equipment, and paint dealers.
In 2015, our organizations collaborated on the groundbreaking Home Sweet Home, which
quantified the enhanced impacts associated with a homeowner using independent, locally-owned
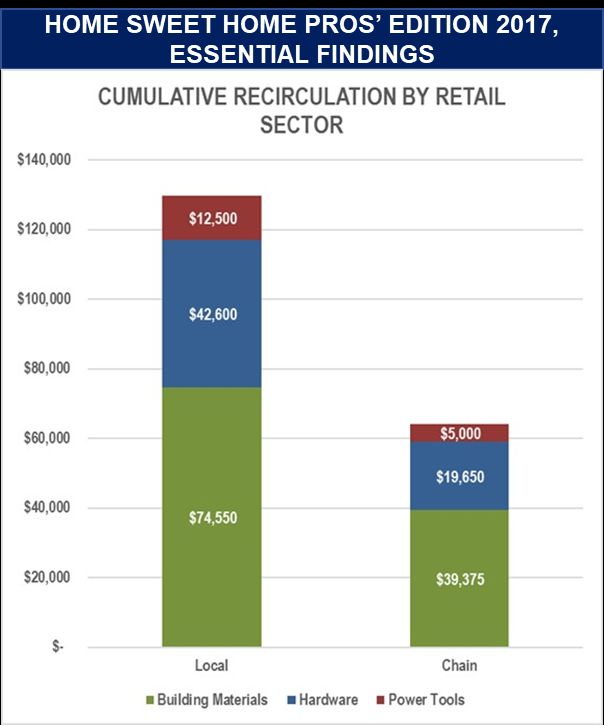
suppliers to complete a modest home improvement project. The 2017 follow up, dubbed the Pros’
Edition, expanded that analysis to the scale of a custom home constructed by a professional
building contractor.
This report builds on Civic Economics’ extensive analyses comparing the local economic impact
of conducting business through locally-owned independent businesses versus a major national
chain, expanding now to include e-commerce sales through Amazon. (Visit
CivicEconomnics.com/retail to learn about past efforts). While our previous studies have looked
at various lines of goods and services in several American and Canadian communities, the
essential findings are broadly consistent:
Independent businesses provide their communities with substantial, quantifiable
economic benefits relative to their chain competitors, and modest changes in purchasing
habits can produce meaningful impacts. The benefits are even more substantial
compared to online competitors such as Amazon.
Prior Home Sweet Home Studies
In 2015, Civic Economics partnered with the IWS and NRHA to produce Home Sweet Home,
applying this analytical approach to the hardware and building materials sector. In that case, we
found that purchases of tangible goods from independents produced roughly double the local
economic impact compared to national chains.
Civic Economics 1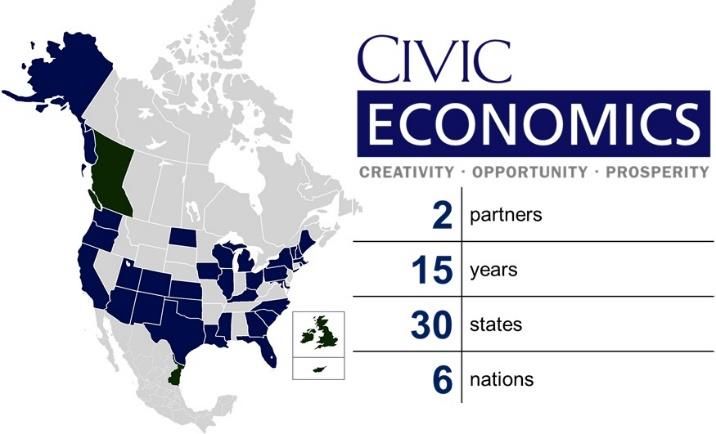
HOME SWEET HOME: LOCALS VS. AMAZON | 2018

A follow-up project, in 2017, expanded the
approach of Home Sweet Home to consider the
purchasing choices facing professional
contractors engaged in bigger projects. Using
a hypothetical approach to a home building
project that included purchasing materials from
a standard hardware store, lumberyard, and
power tool dealer we again showed the returns
to the community would be more than double
by purchasing from locally-owned hardware
stores compared to national chains.
These studies are consistent with the findings
of many studies Civic Economics has
conducted over the years.         Independent,
locally-owned businesses in all sectors provide
sizeable and measurable benefits to their local
economies in comparison with national chains.
For 2018, Home Sweet Home: Locals vs.
Amazon builds upon the previous studies while
addressing a growing concern for all retail
sectors: online retailers such as Amazon. While the home improvement industry is widely believed
to be less vulnerable to online competition than other retail sectors, it nonetheless presents a
challenge that independents must address.

Civic Economics                                                                               2
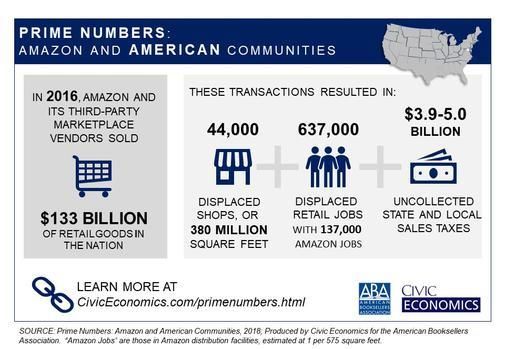
HOME SWEET HOME: LOCALS VS. AMAZON | 2018

Amazon Analysis
In April 2018, Civic Economics and the American Booksellers Association released Prime
Numbers: Amazon and American Communities, which quantifies the impact of Amazon online
retail nationally and at the state level. That study capitalized on a recent revelation from Amazon
that allows a reasonable estimate of the company’s real sales total, including sales from third-
party merchants in Marketplace.

Data from that report, including a detailed estimate of employment and payroll associated with
Amazon distribution facilities in each state, has been incorporated into this study.
An additional finding of relevance to this analysis is that, while Amazon has begun remitting sales
taxes on sales of its own inventory in all states with a sales tax, it does not generally do so for
sales by third-party sellers. Thus, any shift in hardware sales from bricks and mortar retailers to
Amazon will also bring a reduction in sales tax collections.
For more information about that Prime Numbers, please visit
www.civiceconomics.com/primenumbers.html.

Civic Economics                                                                                  3
HOME SWEET HOME: LOCALS VS. AMAZON | 2018

HOME IMPROVEMENT SALES, IN-STORE AND ONLINE

As a share of sales, the broad home improvement sector, including hardware, paint, and power
equipment, has experienced significantly lower online sales than others, prompting some analysts
to refer to Home Depot and Lowe’s as “Amazon proof.” While that may be both an overstatement
and premature, the data support the broad assertion that home improvement and building
materials customers continue to buck the trends.
Two factors are likely to be the main drivers of this reality: First, customers want to inspect many
of the items typically sold at hardware and paint stores before committing. Second, the big box
home center chains have developed sophisticated tools to facilitate hybrid online sales for store
pickup.
At present, the first of these factors should provide comfort to independent hardware and paint
dealers. Many of their customers think of them first when they need a tool, a can of paint, or a
storage shelf. When a need arises, they visit a trusted retailer likely to have needed items and
the expertise to advise them on the purchase. Independents clearly excel in that regard.
The second factor, though, should concern those independents with limited or disjointed e-
commerce capabilities. Though the big home center chains report low total online sales as a
share of revenue, the share of those sales that are picked up in store highlights the value of an
accessible, real-time inventory tool. Moreover, reported online sales likely represent a fraction of
total sales facilitated by online tools that can assure the customer that needed items are in stock
at a particular store and pinpoint their location within the store.
Even a cursory review of the online options provided by various independent hardware and paint
retailers indicates that some are struggling to match the convenience features of the big boxes.
The shift impacting the big boxes will increasingly impact independents; customers may prefer to
visit the store and inspect the products, but they would like to know what they’ll find when they
get there.
E-Commerce Trends
Online retail overall is in a period of rapid, sustained growth. Amazon, eBay and other online-
only merchants dominate the headlines, but traditional merchants are also harnessing online
opportunities. According to the US Census Bureau, total e-commerce sales reached $453.5
billion in 2017, an increase of 16% over 2016. Total e-commerce sales accounted for 8.9% of all
retail sales, up from 8.0% in 2016.
Looking specifically at the hardware and paint sector, the share of e-commerce sales as
percentage of overall sales is significantly lower. Home Depot, the industry leader in online sales
made approximately 5.9% of sales through e-commerce in 2016 while Lowe’s did approximately
3.5% of its sales online. At both major chains, those numbers understate the impact of online
tools. Home Depot and Lowe’s report that “buy online, pick up in store” sales account for 45%
and 60% of those online sales respectively, reflecting the shopping habits described above.
Unaccounted for but likely substantially greater is the proportion of sales that are in some way
facilitated by online tools, particularly mobile, that quantify and pinpoint inventory for shoppers.

Civic Economics                                                                                   4

HOME SWEET HOME: LOCALS VS. AMAZON | 2018

                         ONLINE SALES AT MAJOR CHAINS, 2014-16

                                         HOME DEPOT
                                                                                      2 Year
                                           2014             2015         2016        Change
           Net Sales ($ billions)          74.7             80.5         86.6           16%
        Online Sales ($ billions)           3.4              4.3          5.1           52%
                Online Sales %             4.5%             5.3%         5.9%

                                            LOWE'S
                                                                                      2 Year
                                           2014             2015         2016        Change
           Net Sales ($ billions)          56.2             59.1         65.0           16%
        Online Sales ($ billions)           1.4              1.8          2.3           62%
                Online Sales %             2.5%             3.0%         3.5%

    Source: 2016 Annual Reports for Home Depot and Lowe's

For independents, the best estimate of online sales comes from the Census Bureau, which
estimates online sales for home improvement retailers (NAICS 444), excluding the major chains
and Amazon, at less than 1% of sales as of 2015, the last year for which data is available. Survey
data available from NRHA demonstrates that independents largely understand the benefits of
online tools and are working to develop them.
Combining this estimate of online sales at independent retail home improvement dealers and at
the major chains produces an estimate of just 2.3% of all sales occurring online in 2015, roughly
a quarter of the broader retail rate.

Civic Economics                                                                                 5
HOME SWEET HOME: LOCALS VS. AMAZON | 2018

MERCHANT TYPES

For this study, we analyzed three types of home improvement retailers to quantify the share of
revenue recirculated in the local economy of the purchaser.
Independent Hardware and Paint Stores
The first sector is independent hardware and paint stores. For this study we limited the definition
of hardware store to what the NRHA defines as “stores (that) carry core lines of home repair,
renovation and maintenance products, including fasteners, tools, plumbing and electrical
supplies. They carry little or no lumber and building materials.” For paint stores, we used PDRA's
definition of independently owned stores as businesses that operate at least one storefront selling
paint, sundries and/or wallcoverings.

Independent retailers operating hardware and paint stores may operate branded stores without
being franchised. Within the hardware category, for example, there are competing merchant
cooperatives that provide members with purchasing power as well as branding and advertising
services. True cooperatives provide a periodic rebate to member stores rather than retaining
profits. There are also independently owned paint stores that operate under affiliations with
manufacturers such as Benjamin Moore, that also qualify as true independents.

How does the customer identify independents? Many independent stores do not carry a national
brand. Do It Best, Ace, and (for now) True Value hardware stores operate on the cooperative
model described above. Additionally, any outdoor power equipment dealer carrying Stihl products
is a true independent, as are the majority of paint stores branded along with names like Benjamin
Moore or PPG.

Online sales still make a small fraction of all sales through independent retailers, according to
data provided by the U.S. Census Bureau. According to a 2017 survey conducted by NRHA,
55% of 245 respondents indicated that they offered an e-commerce option to their consumers.
Lack of manpower and time were listed as the primary obstacles to setting up an e-commerce
system. Seventy percent of those with e-commerce capabilities responded that their e-commerce
investment had been justified by the sales it generated, with lawn and garden, housewares, and
hardware being the top lines of goods sold online.

As in past studies, we find here that independent hardware and paint stores recirculate a larger
portion of their sales than national chains; this is especially true when compared to online retailers
as the next section will demonstrate.

Brick and Mortar National Chains
For our purposes, this analysis includes only Home Depot and Lowe’s, though other regional
chains are similarly situated. Both chains have seen an increasing share of sales move online in
recent years, with their combined e-commerce sales increasing from $4.8 billion in 2014 to $7.4
billion in 2016, a 55% increase in only two years. Although this figure represents just less than
5% of total sales the growth suggests that these national chains are investing more in e-commerce
and more gains are on the horizon. Over those same years, online sales growth substantially
outpaced overall growth at both chains.

Civic Economics                                                                                     6

HOME SWEET HOME: LOCALS VS. AMAZON | 2018

Interestingly, both Home Depot and Lowe’s rely on store traffic even for a sizeable share of what
they report as online sales, with in-store pickup accounting for half or more of those sales.
The local impact of such pickup sales is comparable to that of a traditional in-store purchase.
Where a consumer orders from the chains for delivery, however, the impact is more like that of
Amazon, as the opportunities for local employment are limited to the distribution network.
Non-Store Retailers: Amazon
For this study we have added another national competitor to the mix, the online retailer Amazon.
The National Retail Federation lists Amazon as the 7th largest retailer in the United States. But
according to Civic Economics calculations in Prime Numbers, which include third-party sellers
that use Amazon Marketplace, it is likely the 2nd largest retailer trailing only Wal-Mart.

Despite their size and dominance in many activities, hardware may be the major retail sector least
impacted by Amazon to date. According to the NRHA, Amazon is not in the top five of online
sellers of home improvement products and all five top sellers all are primarily storefront retailers.

Amazon has a limited number of brick and mortar stores, consisting currently of 14 book stores
as well as the recent acquisition of the Whole Foods grocery chain. Nonetheless, the
overwhelming share of Amazon sales is still for home delivery. In the coming years, as the
company develops a larger “pick up in store” offering and incorporates Whole Foods more
thoroughly, we will revisit the impact local storefronts may have. For this study, we will focus on
the returns to a community when an online purchase is made for delivery. Whether Amazon sales
produce any real local impact is dependent on the location of distribution centers that service
those sales. Our recent analysis of Amazon allows us to estimate employment and payroll by
state.

Methodology

For this third Home Sweet Home analysis, Civic Economics applied the same methodology as in
the previous iterations. In addition, we were able to incorporate Amazon-specific data developed
for our recent study Prime Numbers: Amazon and American Communities. That data was
essential to estimating the impact of Amazon online purchases at the state level.
The effort to quantify Local Advantage begins with examining the same four major activities in
which firms create impact by recirculating revenues in the local economy: labor, profit,
procurement, and charity.

Civic Economics                                                                                    7

HOME SWEET HOME: LOCALS VS. AMAZON | 2018

Spending on local labor generally comprises a larger share of operating costs for a locally-owned
establishment than for an outlet of a national chain; online retailers may have little or no local
labor force. While chains consolidate administrative functions such as bookkeeping and
marketing at national headquarters, independents often carry out those functions in-house,
resulting in a larger share of sales paid to local residents as wages and benefits. The difference
is clear on the sales floor, too. Upon entering an independent store, particularly in hardware and
paint, a sales associate will often walk with you to the department and help you pick out the correct
product and discuss alternatives and applications. At the home improvement chains, any
assistance beyond directions to a row number may be hard to come by. Amazon bypasses the
storefront completely having all operations take place in the headquarters, sporadically placed
distribution centers and data centers that do not require large numbers of employees to operate.
Secondly, profits earned by local resident ownership of independent retailers will remain in the
local economy. These profits may be reinvested locally, whether through further investment in
the independent business or in the community at large. Purchases at chain and online outlets
generate profits for the corporation, which then either reinvests in global operations or distributes
a portion of profits to shareholders. In either case, chain stores profits returning to the local
economy are nominal at best.
Third, locally-owned businesses procure goods and services locally that national chains arrange
with national distributors. An independent business may hire local accountants, lawyers, and
information technology firms among others. At the chains, these services are provided at a
corporate facility or outsourced to other firms that may be located anywhere in the world. Local
businesses also more often procure a variety of goods from other local businesses, whether for
resale or for in-house use.
A smaller yet significant share of the local advantage is charitable giving. Local resident owners
are more likely to contribute to local causes of interest to their families and employees. We have
found many small businesses fail to even account for charitable giving in full, so ingrained is it in
the culture of the firm. National chains, by contrast, more often support non-local causes. And
when they do support local organizations, the cost of the marketing campaign around the donation
may even exceed the value of any gift.

Civic Economics                                                                                    8

HOME SWEET HOME: LOCALS VS. AMAZON | 2018

For independent businesses, Civic Economics typically surveys or interviews owners to quantify
accurate numbers for the proportion of revenue that goes to each. In this study, prior interviews
with business owners in the Chicago, Tulsa, and Austin areas is supplemented by two invaluable
sources. The North American Retail Hardware Association provided us with their 2017 Cost of
Doing Business Study, which broke out costs and revenues in the home improvement sector. To
protect the company’s proprietary information, we have here aggregated these numbers in the
final report.
For chains, we analyzed Annual Reports, in this case for fiscal year 2016, for both Home Depot
and Lowe’s. This information was compared to data provided in the 2012 Economic Census,
which is the most current iteration of this data. The Economic Census provided sales,
employment, and wage data for all retail sectors in the United States that are further broken out
by total sales of the firms. By using the largest firm size as determined by total sales (over $250
million) we were able to estimate retail employee wages as a percentage of sales revenue.
The following chart shows how the percentage of sales dedicated to wages declines as retailers
grow in size, providing an increase in comparative local economic impact at smaller stores.

Civic Economics                                                                                  9
HOME SWEET HOME: LOCALS VS. AMAZON | 2018

QUANTIFYING LOCAL ADVANTAGES

Using the methodology described above, Civic Economics calculated the percentage of revenue
that recirculates in the local economy for all three retail segments: independent retailers, national
chain retailers, and Amazon (standing in for all online retailers). The national averages are
summarized in the graph below.

The 2017 NRHA Cost of Doing Business Study conducted by the NRHA surveyed nearly 1,000
merchants representing 1,235 independent storefronts. The typical small-format stores in that
survey averaged $1.9 million in store sales and returned 30.4% of revenue to the local community
through labor, profit, procurement, and charity. This rate of return is 130% higher than competing
national chains and 676% greater than the returns, on average, for Amazon.
The impact differential between independents and chains, both brick and mortar and internet
based, in the home improvement category is striking, with more than double the local recirculation
of dollars when compared to Home Depot and Lowe’s and more than seven times that Amazon.
Civic Economics calls that differential the Local Advantage, which provides a clean factor for
estimating the change in local economic activity associated with any shift in sales venue, from
indies to chains, from indies to the internet, or even from chains to the internet.
These striking numbers highlight what many Americans already know: their helpful local hardware
and paint stores are an important part of the local economy.

Civic Economics                                                                                   10
HOME SWEET HOME: LOCALS VS. AMAZON | 2018

State by State Advantages

The impact of Amazon varies from state to state based on the locations of its fulfillment facilities
around the nation. Nationally, the share of Amazon retail sales revenue that we attribute to this
retail-driven employment is just 3.9%, but it is effectively zero in many states where Amazon
maintains no distribution infrastructure (20 plus the District of Columbia in 2016).
Building on the tireless tracking work of MWPVL International in tracking the opening and closing
of Amazon distribution facilities, we are able to estimate Amazon employment and wages by state,
and thus the proportion of revenue earned in any given state that is captured within the state.
The following chart breaks down the results for each state:

Civic Economics                                                                                  11
HOME SWEET HOME: LOCALS VS. AMAZON | 2018

CONCLUSION

Civic Economics is grateful to the North American Retail Hardware Association, the Paint and
Decorating Retailers Association, and Independent We Stand for driving and funding this series
of studies on the local economic impact of independent hardware, paint, power tool, lawn and
garden, and building materials dealers. We believe that clear, data-driven information can be of
real value in educating consumers and policymakers about the importance of independent,
locally-owned businesses, and these organizations are at the forefront of doing so.
Civic Economics has a long history of studying the comparative economic impact advantages
provided by independent, locally-owned merchants. Through fifteen years of studies and
countless media appearances, we believe our work has made a tangible difference in the health
of small business in those communities where “local first” has become part of the ethos.
In our first study for IWS and the NRHA, Home Sweet Home (2015), for example, we documented
that even modest home improvement projects provide strong local impacts when goods and
services are purchased from locally-owned, independent businesses. With every dollar spent on
such a project, a homeowner can produce twice the local economic impact by supporting
independents.
In the second, Home Sweet Home: Pros’ Edition (2017), we found similar impact boosts when a
builder procures necessary inputs from independent local suppliers. The contractor for our one
hypothetical home, with $550,000 in goods purchased, recirculates an additional $65,000 in the
local economy just by directing business to other local business owners.
This third study, Home Sweet Home: Locals vs. Amazon, carries those findings forward and
incorporates Amazon into the mix, demonstrating that sales through local hardware and paint
dealers have a local impact nearly seven times greater than sales through Amazon, even when
including all of Amazon’s distribution employment as if it were unique. Amazon employment
varies between states, of course, so we have provided state level detail. Indeed, in many states,
Amazon has no distribution employment, rendering the local impact at effectively zero.
Our local advantage studies typically conclude with a look at the impact of a 10% shift in sales
from chains to independents, but at this point that appears to overshoot home improvement sales
at Amazon. So, we considered the reverse: What would be lost in American communities if
Amazon captured 10% of sales from independents? Well, in 2016, the American home
improvement market (NAICS Code 444, including hardware and paint), totaled roughly $350
billion.
If Amazon were to capture just 10% more of the home improvement market from
independents, American communities would see a loss of $9.3 billion in local economic
activity. In addition, because roughly half of Amazon sales comes from third-party sellers who
collect sales tax on a very limited basis, states and communities would see a substantial loss of
revenue. This study provides the data necessary to make similar calculations on a statewide
basis, as well.
Where local business thrives, the community benefits. Owners and employees invest in local
homes in a way that chain store workers can rarely do; their profits feed little leagues and
collection plates all over town; and the enhanced tax revenue they drive ensures that the
community can provide the services those businesses and their customers require.

Civic Economics                                                                               12
HOME SWEET HOME: LOCALS VS. AMAZON | 2018

ABOUT CIVIC ECONOMICS

                                                   Civic Economics is an economic analysis and
                                                   strategic planning consultancy with offices in
                                                   Austin and Chicago. Since its founding in
                                                   2002, the work of Civic Economics has been
                                                   nothing if not diverse, in both subject matter
                                                   and geography. One area to which we
                                                   frequently return, however, is the economics of
                                                   regional retail and service provision - what
                                                   we've taken to calling the Civic Economics of
                                                   Retail.
Retail development and redevelopment bring significant impacts to any community. Civic
Economics provides communities with the tools to manage those impacts, magnifying the benefits
and mitigating the challenges.
 Civic Economics is the acclaimed leader in understanding the economics of regional retail and
service activities. From its founding, the firm has focused on the critical and often misunderstood
role of retail in economic development and urban planning policy.
Civic Economics analyzes the economics of retail and service provision using time-tested,
industry standard approaches tailored to the needs and circumstances of each community. These
include trade area analysis, demographic analysis, consumer and business surveys, retail
prospect identification, retail gap
analysis, adaptive reuse of
mature retail centers, and
economic and fiscal impact
analysis.
More importantly, the partners of
Civic Economics monitor the
ever-evolving retail industry. We
know where market forces are
heading and what retailers are
doing in response. We know, too,
what other communities are
doing, providing us with an
unmatched knowledge of best
and worst practices. In contrast
to our larger, convention-bound
peers        and        academic
researchers, Civic Economics has developed innovative methodologies for analyzing this unique
industry sector.
Learn more at: CivicEconomics.com

Civic Economics                                                                                 13
HOME SWEET HOME: LOCALS VS. AMAZON | 2018 CONTACTS To learn more about this study and the organizations behind it, contact the individuals below. INDEPENDENT WE STAND Bill Brunelle 888-787-8497 bill@independentwestand.org IndependentWeStand.org THE NORTH AMERICAN RETAIL HARDWARE ASSOCIATION Dan Tratensek 317- 275-9407 DanT@nrha.org NRHA.org THE PAINT AND DECORATING RETAILERS ASSOCIATION LeAnn Day, CEO 636-680-2737 PDRA.org CIVIC ECONOMICS Matt Cunningham 773-251-5926 mattc@civiceconomics.com CivicEconomics.com Our thanks to the home improvement retailers who have provided valuable assistance in understanding this dynamic and evolving retail sector over the years. Civic Economics 14
You can also read