STATE OF LOCAL GOVERNMENT FINANCE SURVEY 2018 - PUBLISHED 8TH FEBRUARY 2018 - LGIU
←
→
Page content transcription
If your browser does not render page correctly, please read the page content below
State of Local
Government
Finance Survey 2018
Published 8th February 2018

                              1
About the State of Local Government Finance Survey
LGiU and The MJ have run the State of Local Government Finance Survey
every January since 2012 to coincide with councils setting their annual
budgets. The results give a snapshot of the key pressures facing councils and
their ideas for the future.

The survey was sent to senior decision-makers at each of England’s 353
councils (Council Leaders, Chief Executives, Cabinet Members for
Finance/Resources and Directors of Finance/Resources) between 10th and 31st
January 2018.

This year we received 132 responses from 113 individual councils, meaning
that a third of English councils are represented in the results. We received
responses from a broad cross-section of councils, encompassing county,
district and unitary authorities, a mixture of political control, and all regions.

The survey questions covered topics including income sources, confidence,
service level spending, funding system design and thoughts on future policy.

                                          2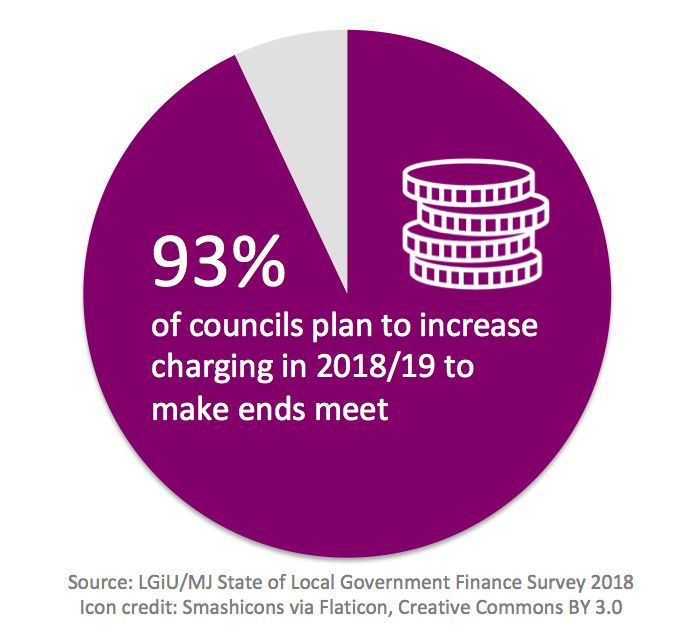
Executive Summary
 • Nearly all councils in England plan to raise council tax (95%) and
   increase charging (93%) to make ends meet this year; and two thirds
   of councils will be forced to dip into their reserves

 • 80% of councils fear for their financial sustainability amid growing
   concern that Northamptonshire CC is the tip of the iceberg for local
   government

 • Councils face continued uncertainty about the source and level of
   funding post-2020 as political turmoil in Westminster has delayed
   crucial decisions on business rate retention, the new funding formula
   and devolution

 • Despite three quarters of councils managing to sustain the quality of
   the frontline services over the past year, evidence suggests that their
   2018/19 budgets will see activity further reduced in several key
   community services including parks and leisure (53% of councils), adult
   social care (40%) and youth centres (34%)

 • Children’s Services is now the top immediate pressure for councils,
   above Adult Social Care for the first time in at least three years,
   suggesting that councils are no longer able to shield these services
   from the worst of the ongoing budget cuts

 • Adult Social Care remains the top longterm pressure for councils,
   followed by Housing and Homelessness

 • Local government is united in agreement about how to resolve this
   crisis, with over two thirds calling for a commitment to maintain 2017
   levels of funding for 3 years in order to aid medium term financial
   planning

 • Councils are also calling for assurances that government will cover
   costs associated with changes to centrally-set business rate policy

 • Though long-awaited, the government’s Fair Funding Review will not
   address the fundamental issues facing the funding system and risks
   irrelevance in the face of mounting structural pressures: councils are
   calling for a formal consultation on how local government financing
   will work going forward

                                     3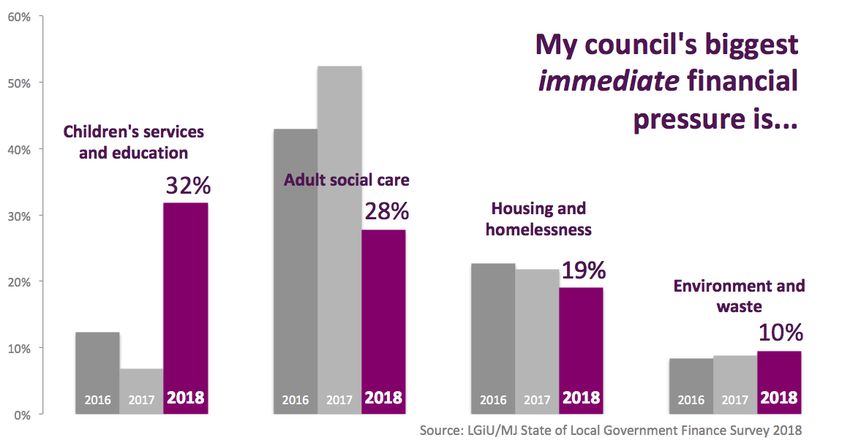
Forewords

Jonathan Carr-West, Chief Executive of LGiU
Over the last 7 years, the State of Local Government
Finance Survey has become an essential bellwether for
issues affecting local communities and an invaluable
opportunity for councils to share their experiences. This
year is no exception.

Results from the 2018 survey show that councils are on the edge. They are for
the most part holding services together (though a significant minority are
not). But they can only do this this by raising council tax, increasing charging
and draining their reserves.

The system is unsustainable and needs far more fundamental reform than is
presently on offer. It’s simply not acceptable that we don’t know how local
government will work post 2020.

Councils are calling for assurances around funding for the next three years and
for a fundamental redesign of the finance system. At present government is
offering neither. That has to change.

Heather Jameson, Editor of The MJ
Austerity has pushed council budgets to breaking point and
they just can’t take any more. They have faced reduced
budgets and increased demand for services – the sums just
don’t add up.

Last week saw the first local authority issue a freeze on its
spending due to its cash crisis and it is not likely to be the
last. The rising cost of adult social care and its impact on the NHS is well
documented, but now children’s services are at risk.

The Government needs to rapidly rethink its funding of local authorities
before services – including those for the elderly and vulnerable children –
start to crumble completely.

                                         4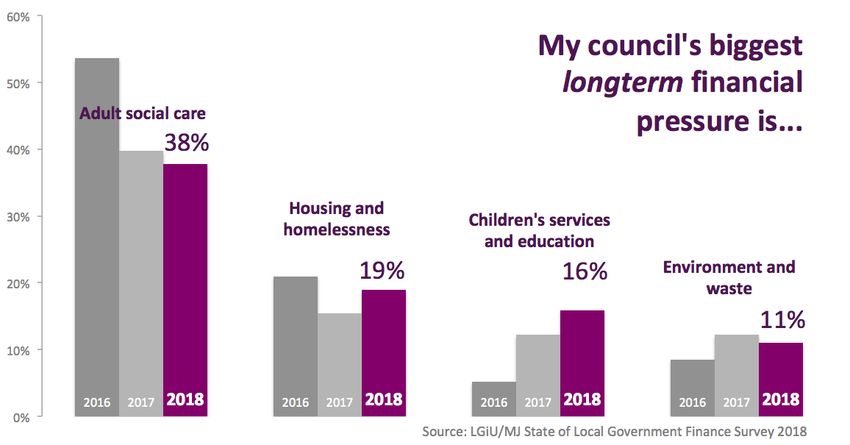
Introduction
The annual State of Local Government Finance Survey gives a snapshot of the
pressures facing councils. We ask the most senior figures in each council to
tell us their plans for the coming year in the run-up to setting their annual
budget. This year 132 council leaders, chief executives, cabinet members for
finance and finance directors took part, representing a third of all English
councils.

The results help us to assess the impact of policies and highlight areas that are
of current or future concern. As an independent, cross-party membership
body we hope to bring together the voice of the sector and contribute to
strength of our local democracy.

What’s happening in local government?
Local government is responsible for a dizzying array of essential community
services, visible and invisible, universal and targeted – from care homes to
business support, potholes to social services, education to leisure centres. But
if you ask the average person on the street what their council does, they’ll
likely reply, ‘Collecting my bin.’

If you were feeling particularly cruel, you could ask the poor soul how their
council is funded, to which they would probably hesitantly reply, ‘Council tax?’
And who could blame them for this assumption? Most of those working in the
sector struggle to wrap their own heads around the complexities and vagaries
of the various grants, tariffs, top-ups, funding formulas and local business rate
shares.

But this (somewhat glib) example strikes right to the core of the challenge
that councils face in articulating their current financial situation with the
urgency it requires.

When people see their council tax go up and the quality of their services
deteriorate, they rightly ask questions. But in reality council tax only accounts
for 15% of local authority income: over half comes in the form of grants from
central government*.

However, local authority grant income has plummeted by £16bn since 2011*,
first because of wider public sector budget cuts after the financial crisis, and
then as part of government’s plan for councils to transition from grant funding

                                                    5
*Based on the latest available figures from DCLG, 2015-16
https://www.gov.uk/government/uploads/system/uploads/attachment_data/file/627895/LGFS27_Web_version.pdf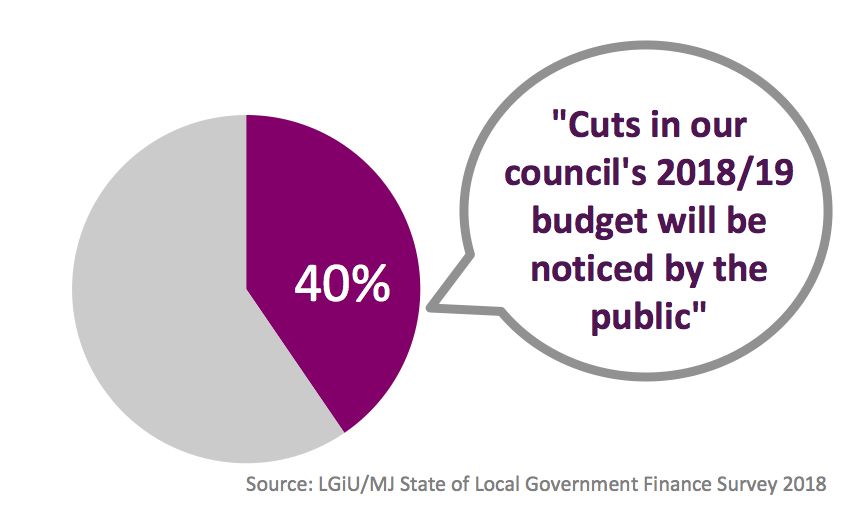
to relying on local business rate income by 2020 – the implementation of
which has been severely delayed.

As it stands, councils are facing the 2020 cliff-edge without a clear idea of how
they will be funded afterwards or how much money they will have.

Why this work matters
The real world impact of delaying these seemingly technical decisions is that,
across the country, libraries and parks are closing down, the elderly and
disabled can’t access basic care, vulnerable children aren’t be supported and
the streets are dirtier and more dangerous.

With limited borrowing powers and restrictions on types of investment,
council tax and charging are two of the only mechanisms left over which
councils have some control, which is why we are seeing over 90% of councils
increase both this year. This is not a sustainable solution.

Each council has approached these challenges in different ways according to
the needs and wishes of their residents, so it can be difficult to see the overall
impact of central cuts to council income. This survey helps us to shine a light
on the cross-sectoral challenges in order to move the conversation back to the
national scale.

It would be easy for this to remain a technocratic debate among those in the
sector, but the consequences of slow or ineffective decisions is potentially
disastrous and deserves greater urgency and a wider audience.

 This survey is the first output from LGiU’s Local Finance Taskforce
 2018, a local authority-led project to raise the profile of council
 funding issues and to move the agenda forward. For more information
 visit: lgiu.org.uk/policy-theme/local-finance-taskforce

                                          6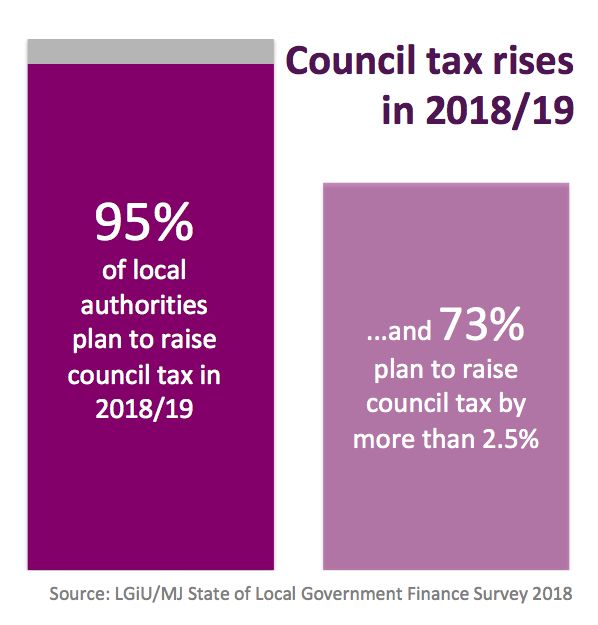
Current situation

Confidence
Confidence in the sustainability
of the local government finance
system is still very low – as in
2017, 80% say they are not
confident. This opinion is held
across the sector, spanning
political boundaries, council type
and region.

                                         Council tax
                                         95% of respondents said
                                         they would be raising
                                         council tax in their area this
                                         year, the highest proportion
                                         since the survey began in
                                         2012. Three quarters said
                                         they would be raising
                                         council tax by more than
                                         2.5%. Only one respondent
                                         said their council would be
                                         reducing council tax.

                                     7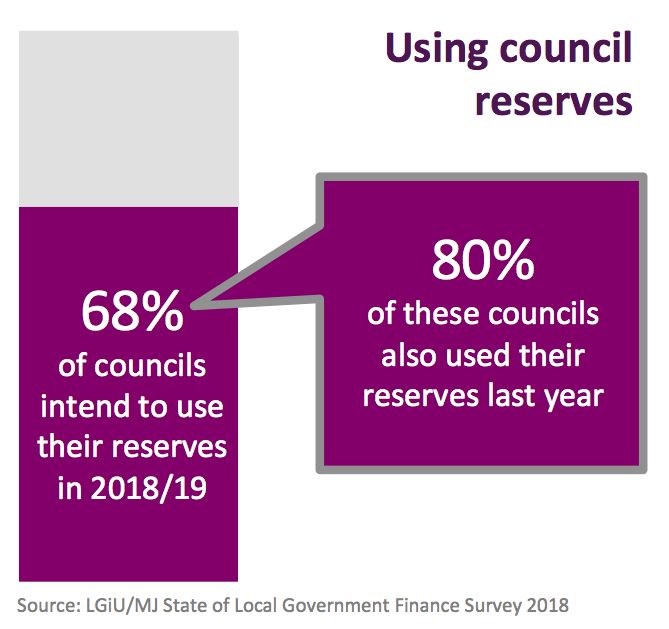
Reserves
Almost     three     quarters     of
respondents (68%) intend to use
their reserves this year; of these,
80% used their reserves last year as
well.

                                            Fees and charges
                                            93% of respondents plan to
                                            increase fees and charges this
                                            year to balance their budget.
                                            Areas that will see new/increased
                                            charging include: waste, planning,
                                            parking, social care and home
                                            care,                bereavement,
                                            burial/cremation, and meals on
                                            wheels.

Other sources of income
9 in 10 councils (89%) now consider exploring other sources of income a high
priority or essential. Sources that councils are considering include:
    • Commercialising council services (76% of respondents)
    • Local commercial property developments (76%)
    • Local housing developments (76%)
    • Purchasing investment properties (66%)

In order to finance these projects, over 90% intend to borrow from the Public
Works Loans Board. Other finance sources include capital markets (13%),
other local authorities (18%), private investment (20%) and crowdfunding
(7%).

                                        8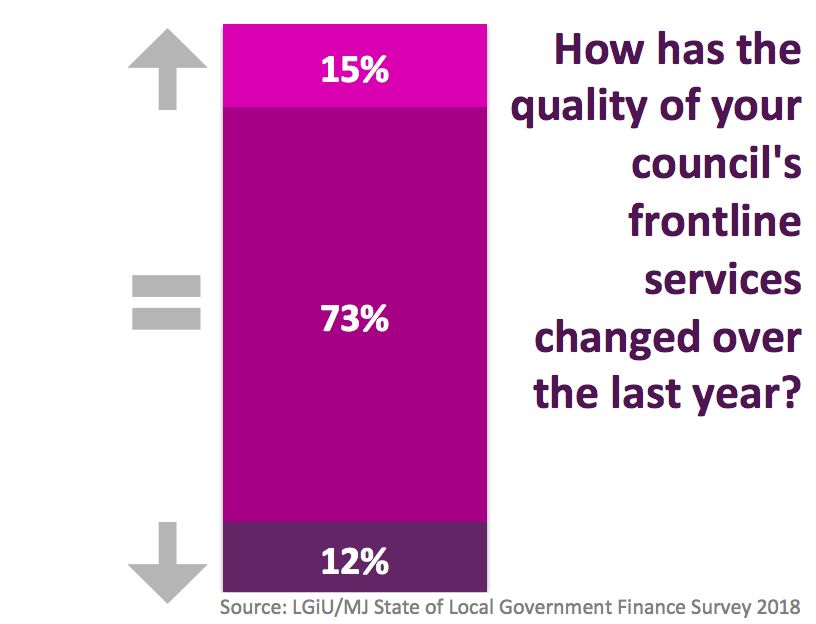
Pressure on local services

Quality of frontline
services
Three quarters of councils
(73%) tell us they have
managed to sustain the
quality     of    frontline
services over the past
year, despite the financial
challenges they face.

However, 40% of respondents believe the cuts to frontline services this year
will be noticed by the public. Councils will be forced to reduce activity in a
broad range of service areas in order to make ends meet:

   • Parks and Leisure facilities and Business Support services topped the list,
     with half of respondents saying they would be reducing activity.
   • Over a third of respondents say they will also have to reduce activity in
     these service areas: Arts and Culture, Adult Social Care, Children’s
     Services, Youth Centres, Libraries and Highways/Transport.

                                         9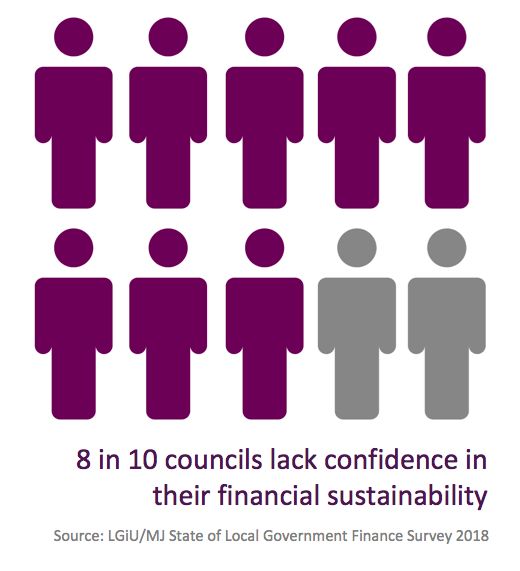
Children’s Services and Education
Children’s Services is now the most immediate pressure for councils, ahead of
Adult Social Care for the first time in at least 3 years (since our records began).

This is likely a result of a combination of factors. After 8 years of diminishing
local authority budgets, councils are no longer able to shield Children’s
Services from the worst of the cuts. At the same time, demand is increasing
due to rising numbers of child protection enquiries, cuts in the Early
Intervention Grant, Universal Credit among other things. It could also indicate
that the extra £2bn social care funding announced in March could be
temporarily easing pressure in this area such that councils can focus on
Children’s Services.

Over a third of respondents indicated that their council would be reducing
activity in Children’s Services and in their Youth Centres because of financial
constraints.

                                           10
Adult Social Care
Adult Social Care remains the greatest longterm pressure for councils, with
38% of respondents putting it top of their list. When looking only at those
councils with direct responsibility for social care, this rises to two thirds.
Moreover, 40% of respondents expect to see a reduction in their adult social
care activity this year due to financial constraints.
Although the announcement of the £150m Adult Social Care Grant for
2018/19 was welcomed by the sector, the fundamental resourcing issues
remain. We asked councils what they would like to see to help fix the system:
over half would like to see a concerted effort to integrate health and social
care across the country and a quarter support the idea of a ringfenced central
grant for social care.
11Housing and Homelessness
Housing and Homelessness is the second most common longterm pressure
after Adult Social Care, with 19% placing it top of their list. Among lower tier
authorities (which do not have direct responsibility for adult or children’s
social services) it is the number one immediate and longterm pressure. One in
ten councils expect to reduce homelessness support activities this year as a
result of budgetary constraints.
In order to ease the pressure on housing, councils are calling for extra powers
and flexibility. We asked councils what changes were needed to support this
goal and these ideas had the support of over three quarters of respondents:
• Allow councils to charge council tax on undeveloped land with planning
permission (90%)
• Introduce “use it or lose it” powers to revoke planning permission for
stalled developments (82%)
• Raise (80%) or remove (63%) the Housing Revenue Account cap
• Additional funding for the accompanying infrastructure like roads and
schools (79%)
• Ensure councils can keep 100% of right-to-buy sale proceeds (77%)
Community services
As a result of financial difficulties, councils are planning to make cuts to many
of their core community services.
Half say they will be reducing Parks/Leisure and Arts/Culture activities this
year. A third intend to make cuts to their library service and a quarter will be
reducing spending on local Citizen’s Advice Bureaus.
This signals that councils are having to prioritise acute and statutory services
in order to balance their budget, meaning that these types of “non-essential”
or preventative community resources will be adversely affected.
12Economy and business
We asked councils what they see as the main barrier to economic growth in
their region: poor transport infrastructure was by far the biggest barrier, cited
by 32% of respondents from across the country. Others cited a lack of inward
investment (15%), a lack of commercial space (14%), a lack of needed skills
(13%), a lack of suitable jobs (10%) and a lack of suitable housing (10%) as
their main barriers to growth.
However, due to budgetary constraints, half of respondents said their council
would be reducing their Business Support activity, a third would be reducing
Highways and Transport work and a fifth said Regeneration projects would be
scaled back.
A lack of clarity about the how much of the proceeds of local growth councils
can expect post-2020 (due to delayed decisions on business rate retention)
means that councils are prioritising immediate need over investing in future
local economic growth because they can’t guarantee they will see the returns
from their investments.
13The way forward
The uncertainty facing councils in terms of future funding is damaging their
ability to forward plan. There is an urgent need for action to remedy this
situation.
The survey shows that local government is united in agreement about how to
resolve this crisis, with over two thirds calling for a commitment to maintain
2017 levels of funding for 3 years in order to aid medium term financial
planning. They are also calling for assurances that government will cover
costs associated with changes to centrally-set business rate policy.
With the impending roll-out of 75% Business Rate Retention (as well as the
100% Business Rate Retention pilots), there are still many unanswered
questions about how the new system will work.
We asked councils to rank their concerns about how it will impact their
authority. ‘Volatility of business rates as a source of income’ was most
common concern, with half of respondents placing this first or second. ‘Lack
of clarity about the future shape of the policy (reset periods, redistribution,
etc)’ and ‘Pressure on demand-led services like social care’ were also
common concerns, with just under half of respondents placing them either
first or second.
Local government’s asks for 2018
1. A commitment to maintain at least the 2017 level of funding for at
least 3 years, in any form (71%)
2. Assurances that government will cover the costs to councils
associated with changes to centrally-set business rate policy (68%)
3. Remove requirement to hold a referendum on council tax rises above
a certain threshold (62%)
4. Full roll out of 75% business rate retention, not just in pilot areas
(57%)
5. A formal consultation on the options for the future funding system
(52%)
6. An indication of the intended direction of adult social care policy, in
order to unlock public and private investment in a creaking care
market (52%)
7. Clarity about next steps for devolution and business rate retention so
that they can plan post-2020 (51%)
14Looking further ahead
The steps outlined in the previous section would go a long way towards
getting councils on a steady financial footing in the short term, but there
remain several fundamental systemic issues that need addressing to secure
their future.
We asked councils to prioritise these challenges. These were their top choices:
1. Redesigning business rate system to make it fairer (65%)
It is widely accepted, by the public and private sector alike, that the
business rate system is flawed and unfair in several respects. If local
authorities are to become reliant on this form of taxation for a significant
portion of their income, this must be fixed or we risk creating skewed
incentives and stunting economic growth.
2. Health and social care integration (52%)
This policy was supposed to be pursued as part of the devolution agenda
but as the devolution deal negotiations have stalled, health and social
care integration has been sidelined in most parts of the country.
However, the survey shows there is still strong support for this to go
ahead.
3. Revaluing council tax bands (49%)
The current council tax banding system is based on property values from
1991. Under this system, the ratio between the bottom and top rates of
bands remains about 1 to 3, far lower than the current spread of house
prices. This means that many people are under or over-paying their
council tax, and research from the IFS suggests this disproportionately
affects low income households. Successive governments have shied
away from the task of revaluation, but under the current system council
tax intake is bound more to chance than an accurate assessment of their
residents’ means.
15About LGiU
The Local Government Information Unit (LGiU) is a think tank and
membership body with over 200 councils and other organisations subscribing
to our networks. We work to strengthen local democracy and put citizens in
control of their own lives, communities and local services. For more
information, visit www.lgiu.org.uk
About The MJ
The Municipal Journal (MJ) is the UK’s leading weekly magazine for council
chief executives and senior managers in local authorities and allied sectors. It
offers an insiders’ view of what’s going on and what people are thinking in
today’s ever changing and challenging world of local politics – the latest news,
incisive comment, in-depth features and interviews, business analysis and the
top recruitment vacancies. Visit www.themj.co.uk
th
Published 8 February 2018
Copyright LGiU 2018
16APPENDIX
Survey respondents
RESPONSES BY REGION
East Midlands 13
Eastern 12
London 9
North East 6
North West 14
South East 37
South West 13
West Midlands 18
Yorkshire and Humber 10
RESPONSES BY COUNCIL TYPE
Upper tier
County 16
Unitary 24
London Borough 9
Metropolitan 18
Total 67
Lower tier
Non-Metropolitan District 65
RESPONSES BY POLITICAL
CONTROL OF COUNCIL
Conservative Council 79
Labour Council 39
Liberal Democrat Council 4
No Overall Control Council 9
UKIP 1
RESPONSES BY ROLE
Cabinet Member
(Finances/Resources) 12
Chief Executive 42
Director of Finance/Resources 30
Leader 47
Elected mayor 1
Data tables
Expected council tax change 2018/19
17Reduce 0.76%
Freeze 3.82%
Increase - up to 0.5% 0.00%
Increase - 0.5% to 1% 3.05%
Increase - 1% to 1.5% 0.00%
Increase - 1.5% to 2% 16.79%
Increase - 2% to 2.5% 2.29%
Increase - 2.5% to 3% 53.44%
Increase - more than 3% 19.85%
Is there a danger that financial constraints will put your authority in a position where you no
longer have enough funding to fulfil your statutory duties in 2018/19?
Yes 9.92%
No 90.08%
Greatest immediate pressures 2016-18 2018 2017 2016
Children’s services and education 31.8% 6.8% 12.3%
Adult social care 27.8% 52.4% 42.9%
Housing and homelessness 19.1% 21.8% 22.7%
Environment and waste 9.5% 8.8% 8.4%
Greatest long term pressures 2016-18 2018 2017 2016
Adult social care 37.8% 39.8% 53.6%
Housing and homelessness 18.9% 15.4% 20.9%
Children's services and education 15.8% 12.2% 5.2%
Environment and waste 11.0% 12.2% 8.5%
In which of these areas will activity be reduced in 2018/19 due to budgetary constraints? Tick
all that apply
Parks and leisure facilities 53.19%
Business support 50.00%
Arts and culture 45.74%
Adult Social Care 40.43%
Children’s Services 36.17%
Youth centres 34.04%
Libraries 32.98%
Highways and transport 32.98%
Citizens Advice Bureaus 24.47%
Regeneration projects 20.21%
Planning 13.83%
Homelessness support 11.70%
Further education 2.13%
18How, if at all, has the quality of your frontline services changed over the last year?
Improved 14.62%
Sustained 73.08%
Deteriorated 12.31%
Will your 2018/19 budget lead to cuts in frontline services which will be
evident to the public?
Yes 40.46%
No 59.54%
Did your authority use, increase or not touch your reserves last year?And do you intend to use,
increase or not touch your reserves this year?
Use reserves Not touch reserves Increase reserves
2017/18 66.15% 21.54% 12.31%
2018/19 67.97% 21.88% 10.16%
How much of a priority is it for you to actively explore other sources of income?
Not a priority Low priority Medium priority High priority Essential
0.00% 0.87% 10.43% 37.39% 51.30%
Which sources of income are you considering? Tick all that apply
Fees and charges, eg. Garden waste, Planning fees 88.98%
Commercialising council services 76.38%
Commercial developments (locally) 76.38%
Housing developments (locally) 75.59%
Purchasing investment properties 66.14%
Asset sales 59.06%
Advertising space 39.37%
Energy projects 39.37%
Sponsorship 28.35%
Commercial developments (further afield) 18.90%
Other (please specify) 8.66%
Housing developments (further afield) 7.09%
Congestion charge 1.57%
If you are planning to seek external funding for any of the above projects, where from? Tick all
that apply
Public Works Loans Board 93.86%
Grant funding 34.21%
Private investment 20.18%
Other local authorities 18.42%
Capital markets 13.16%
19Municipal Bonds Agency 12.28%
Bank loan 8.77%
Crowdfunding 7.02%
Other (please specify) 4.39%
How much of your 2018/19 budget will be funded from increased charging?
None 7.50%
0% to 5% 77.50%
5% to 10% 6.67%
10% to 15% 5.00%
15% to 20% 1.67%
Above 20% 1.67%
How confident do you feel about the sustainability of local government finance?
Not at all confident Not very confident Quite confident Very confident
21.67% 58.33% 19.17% 0.83%
What do you think should happen in the next year to alleviate financial pressures and help
councils plan ahead? Tick all statements that you agree with
Commitment to maintain at least 2017 level of funding for at least 3 years 71.31%
(in any form)
Assurances that government will cover the costs associated with changes to 68.03%
centrally-set business rate policy
Remove council tax rise referendum requirement 62.30%
Full roll out of 75% business rate retention, not just in pilot areas 57.38%
Formal consultation on local funding system options 51.64%
Indication of social care policy direction to enable public and private 51.64%
investment
Indication of devolution and business rate retention policy direction 50.82%
Raise HRA borrowing cap for ALL councils 45.90%
More control over council tax exemptions/discounts 45.08%
Indication of how local government structures and roles may evolve 38.52%
Other (please specify) 23.77%
Revert to Revenue Support Grant for the time being 21.31%
In an ideal world, which of these would you like the government to consider, if any? Tick all
that apply
Redesigning business rate system to make it fairer 65.29%
Health and social care integration 52.07%
Revaluing council tax bands 48.76%
Rebanding properties 32.23%
Remove the ringfencing on Health/Education grants 29.75%
Hotel/tourism tax 28.10%
Place-based budgets 28.10%
Ringfenced grant for social care 25.62%
20Implement a land value tax 24.79%
Local income tax 19.83%
Local VAT/sales tax 18.18%
Other (please specify) 11.57%
What are your top concerns about how 100% Business Rate Retention might impact your
authority? Rank in order of priority by dragging boxes (1=highest)
RANK 1 2 3 4 5
Costs and risk associated with 13.91% 23.48% 22.61% 25.22% 14.78%
business rates appeals
Not being reimbursed for 11.82% 20.91% 29.09% 20.91% 17.27%
national changes to business
rate policy
Lack of clarity about the future 25.00% 18.10% 25.00% 20.69% 11.21%
shape of the policy –
redistribution, reset period, etc.
Pressure on demand-led services 29.63% 13.89% 7.41% 12.04% 37.04%
like social care
Volatility of business rates as a 25.42% 25.42% 17.80% 16.95% 14.41%
funding source
Do you want the Housing Revenue Account cap to be raised in your area?
Yes 80.00%
No 20.00%
What, in your opinion, should be done to ease the pressure on housing? Tick all that apply
Allow councils to charge council tax on undeveloped land with planning 89.57%
permission
Introduce “use it or lose it” powers to revoke planning permission for stalled 81.74%
developments
Additional funding for the accompanying infrastructure (roads, schools, etc.) 79.13%
Ensure councils can keep 100% of right-to-buy sale proceeds 76.52%
Allow councils to set charges for stalled developments 73.91%
Remove the HRA borrowing cap 62.61%
Halt plans to roll out right-to-buy for housing associations 60.87%
Strengthen Compulsory Purchase Order powers to prevent land-banking 58.26%
End right-to-buy for council housing 57.39%
Better resourcing of Planning departments 33.04%
Other (please specify) 13.91%
What is the MAIN barrier to economic growth in your region?
Poor transport infrastructure 32.20%
Lack of inward investment 15.25%
Lack of commercial space 14.41%
Lack of needed skills 12.71%
21Lack of suitable jobs 10.17%
Lack of suitable housing 10.17%
Poor digital infrastructure 5.08%
Do you measure your council’s impact on local growth?
No 65.22%
Yes 34.78%
22You can also read