Results Q1 2018 investor and analyst presentation - 14 May 2018 - ABN Amro
←
→
Page content transcription
If your browser does not render page correctly, please read the page content below

Investor Relations

results Q1 2018

investor and analyst presentation
14 May 2018

Highlights of Q1, a solid quarter
Financial progress
Net profit at EUR 595m and ROE of 11.5%, reflecting a strong operating result offset by high impairments
NII remained strong, benefitting from loan growth, driven by corporate loans, including Dutch SMEs
Improved operating result led to a C/I ratio of 57.9%
Strong CET1 capital ratio of 17.5%
Strategic progress
Cost savings from transformation and business simplification coming through
Progress on IT transformation, digital and innovation
Private Banking transformation taking shape
Bringing more focus to CIB, update at Q2
A leading franchise in sustainability is developing
On track to achieve 2020 financial targets
2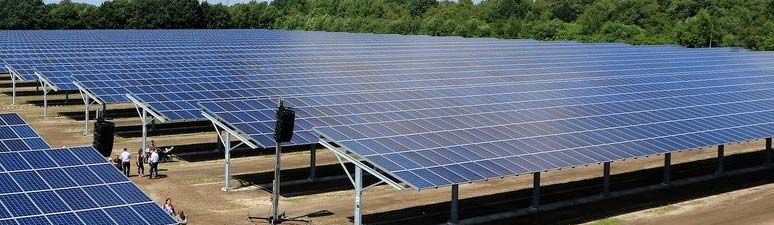
Cost savings from transformation and business simplification coming through
Costs development 2015-2017 Business simplification: lower headcount & branches
EUR m FTEs (in ‘000) down 10%2) Retail branches
-1% Internal External
26.5 26.0 260
405 24.0 23.7 221
-63 4.5 202
227 4.3 179
4.0 4.1
-467
250
5,228
5,175
5,582
22.0
21.7
20.0
19.6
Incidentals1)
YE15 YE16 YE17 1Q18 YE15 YE16 YE17 1Q18
Reported
Divested
Inflation &
Investments
Reported
Base 2017
Savings
activities
2015
2017
levies
Transformation progressing: cost savings enable investments in digital, innovation and growth initiatives
Digitalisation of processes and agile working methods lower headcount and size of retail branch network
Cost/income 57.9% in Q1 2018: on track to deliver EUR 0.9bn costs savings and 56-58% target by 2020 through further savings
Further cost savings come from existing programmes, mainly from further FTE reductions, IT run costs and extending agile way of
working
1) Sum of incidental costs (2017): personnel expenses EUR 177m (restructuring provisions EUR 156m, sale PB Asia EUR 21m), other expenses EUR 228m (SME Derivatives EUR 139m, goodwill
impairment EUR 36m, sale PB Asia 35m and some smaller items in total EUR 18m)
2) 9% excluding PB Asia divestment
3
Progress on IT transformation, digital and innovation
What is achieved Future focus
Efficiency & speed FTEs in operations in I&T
IT run cost reduced and back-office Cost discipline and next round of efficiency
1,512
efficiency increased levers (AI, automation)
947
869
Agile way of working implemented Further extend agile ways-of-working
IT infrastructure and system landscape YE2015 Q1 2018 YE2018
Target
IT transformation (start 2013) well on No new core systems, modernise system
track, milestones & savings secured landscape
Adoption of cloud Fully leverage flexibility and scalability of Applications migrated to cloud 1)
cloud
Digitalisation
462
730
13
Enhanced digital experience with award Enhance client experience in key client
winning apps: mobile, Tikkie, Grip journeys and establish ecosystems
YE2015 Q1 2018 YE2018
Retail client sales and services now Strengthen digital offering in Commercial and Target
59% online and increasing Private Banking, use ‘challenger’ lessons
Innovation & Partnering
Key building blocks in place: digital Intensify partnerships (big and small) and Retail client sales and services online
challenger concepts, API developer leverage our API platform
59%
65%
portal, Blockchain pilots Unlock potential of AI, open banking and
35%
Focussed investments by Digital Blockchain
Investment Fund YE2015 Q1 2018 YE2018
Target
1) Around 1,500 applications have been decommissioned from a YE2019 target of around 2,000 applications
4
Digital innovation enhancing customer experience, supporting future growth
Ready for open banking & PSD2 Tikkie App, Portal and API GRIP App
Open banking enables new solutions Developed ahead of PSD2 Offers a convenient breakdown of
and allows targeting of new clients c. 3m users, 80% of payment personal income and expenses
Capabilities in place to build and requests paid ≤24hours, NPS +74 Includes financial planning features
launch PSD2 propositions Recently launched in Germany to get a grip on spending
API Developer Portal launched in Well embraced by Dutch SMEs, c.450k users, NPS +16
2017 to accelerate innovation with corporates and charities
Co-developed with an experienced
(FinTech) partners
Tikkie API & Portal now adopted by FinTech aggregator of data
Building developer community to third parties
Provides valuable insights for
foster API opportunities & innovation
personalised client propositions,
subject to data privacy rules
5
Private Banking transformation taking shape
AUM managed though an open architecture model Private Banking FTE reduction
EUR bn FTEs
NL GE FR BE Other Divested
199 200
3,722
17
-17% vs.
YE2015
3,104
YE2015 2018 Q1 YE2015 Divestments Transformation 2018 Q1
Strong market positions Next steps & aspirations
One private bank leveraging scale across Europe Further invest in IT and digital banking to improve processes,
client convenience and client portals
Strong local brands with focus on NW-Europe
Improve C/I ratio and ROE in individual countries
Asia divested, Luxembourg sale announced
Leveraging on a modern open architecture
Operational simplification and digitalisation progressing:
harmonised client segments, service offering and platforms Increase sustainable client assets to EUR 16bn by 2020
across countries resulting in cost savings, delivering scale (>10bn Q1 2018)
and lower FTEs
Well positioned for organic NNA growth and bolt-on M&A
Basel IV impact on private banking is neutral
6Building a leading franchise in sustainability
Support corporates with sustainability expertise Commitment to building a circular economy
x
‘Circular Economy Investor’
Award
World Economic Forum
Davos, 2018
Solar parking lot at TT Assen, the Netherlands Circularity: continued use and re-use of resources for the longest possible time. Reduce waste, address the
problem of shrinking stocks of resources and reduce carbon emissions
First bank to issue a Dutch green bond in 2015 Become partner of choice to support clients making a step-
Track record as lead manager and structurer of green bonds change towards a circular business model
for international banks and other issuers 1) Finance EUR 1bn in circular corporate loans by 2020 and
Global coordinator in Alfen IPO, an energy solutions provider reduce CO2 emission
of sustainable and innovative electricity grids Examples of circular transactions recently financed
First Asian sustainability linked loan to a leading Asian agri- − Bajes Kwartier, redevelopment of a former prison
corporate − ‘Light as a service’ with smart LEDs
− Circular dismantling of airplanes
− Vibers, a new natural material to replace plastic
1) ABN AMRO was bookrunner in 11 green bond deals (o/w 8 from bank issuers) with a combined deal value of USD 1.6bn in 2017. ABN AMRO was structuring advisor and/or bookrunner on inaugural
issues from SEB, Swedbank, Barclays, Hypo Vorarlberg, Deutsche Hyp and LBBW, and had repeat mandates from Berlin Hyp and DKB
7Solid quarter
EUR m 2018 Q1 2017 Q1 Delta Key points 1)
IFRS9 IAS39
Net interest income 1,671 1,596 5% Net profit of EUR 595m, down 3%
Net fee and commission income 431 452 -5% Limited effect of incidentals
Other operating income 227 198 15%
Operating income up 4%, reflecting strong NII and good
Operating income 2,329 2,246 4%
Equity Participations results
o/w incidentals 25 31
Operating expenses flat, despite new collective labour
Operating expenses 1,348 1,353 0%
agreement
o/w incidentals 46 41
Operating result 981 893 10% Impairments up, reflecting challenges in specific sectors such
as Shipping and Offshore services (both oil & gas related) and
Impairment charges 208 63
Diamond & Jewellery
Income tax expenses 178 215 -17%
Profit 595 615 -3%
1) In this presentation all 2018 financials are presented in accordance with IFRS9, whereas historic financials are presented in accordance with IAS39
8Client lending picking up through corporate loans
Mortgage client lending Corporate client lending Consumer loans client lending
CAGR = 0% CAGR = 4% CB, 1% CIB (ex reclass) CAGR = 0%
EUR bn EUR bn EUR bn
CIB Commercial Banking
155 50 30
140 40 20
42.2 1)
40.8
39.6
39.1
125 30 10
150.7
150.6
150.7
12.4
12.3
12.3
40.1
38.9
110 20 0
Q1 Q2 Q3 Q4 Q1 Q1 Q2 Q3 Q4 Q1 Q1 Q2 Q3 Q4 Q1
2017 2018 2017 2018 2017 2018
Mortgage loans flat in Q1, despite strong competition in Dutch mortgage market and rising amortisation levels
Corporate loan growth, reflecting strong growth in Dutch SMEs (in CB) and Financial Institutions, Food & Retail and a
EUR 1.8bn reclass (in CIB) 1)
Stable volumes maintained for Consumer loans in Q1
1) Corporate loans CIB: increase of EUR 3.3bn vs. Q4 2017 (o/w EUR 1.8bn reclassification from professional lending), and includes effect of USD depreciation (EUR -0.7bn). Effect of USD depreciation vs.
Q1 2017 EUR -4.3bn
9Net interest income resilient despite low rate environment
Net Interest Income (NII) Net Interest Margin (NIM)
EUR m NIM bps
Incidental effect
Accounting effect mortgage penalties NIM NIM adjusted 2)2)
1,800 Net interest income 190 4Q rolling average
92 25
1,600 32 170
1,400 150
1,596
1,604
1,614
1,200 130
Q1 Q2 Q3 Q4 Q1 Q1 Q2 Q3 Q4 Q1
2017 2018 2017 2018
NII up 5% vs. Q1 2017, reflecting loan growth and an accounting effect of mortgage penalties 1)
NIM increased largely due to accounting effect of mortgage penalties and improved margins on corporate and consumer loans
Limited sensitivity to interest rate (as a result of hedging), pressure on future deposit margins remains (when rates stay low)
1) Q1 2018 includes: accounting policy change for mortgages interest rate renewals (‘interest rate averaging’) prior to the end of the interest period has led to a EUR 25m release in NII for faster
amortisation penalties; EUR 32m is the ‘recurring’ effect for faster amortisation of mortgage penalties. Q4 2017 included EUR 49m release of upfront penalties for mortgage interest rate renewals. Q4
2017 further included a release of unearned interest on defaulted loans (EUR 74m), T-LTRO benefit for 2017 (EUR 29m), partly offset by provisions for Euribor based mortgages
(EUR -52m) and the ICS compensation scheme (EUR -8m)
2) NIM adjusted for incidental items and accounting effect of mortgage penalties
10Non-interest income is slightly up
Net fee income Other operating income
EUR m EUR m
Gain PB Asia (Q2) / Visa (Q4)
Net fee income PB Asia (sold) Other income
525 600 Guidance
11
350 400
114
175 200
441
443
431
198
176
227
0 0
Q1 Q2 Q3 Q4 Q1 Q1 Q2 Q3 Q4 Q1
2017 2018 2017 2018
Fees slightly lower vs. Q1 2017 reflecting the sale of PB Asia and lower fee income in Retail and CIB
Higher other income for the quarter, reflecting good Equity Participation results (EUR 102m) in CIB and a
revaluation of the equensWordline stake (EUR 46m)
Lower accounting effects Q1 2018 (Q1 2017): hedge accounting EUR 24m (EUR 50m), CVA/DVA/FVA EUR -4m (EUR 23m)
11Operating expenses trending down
Operating expenses 1) Transition operating expenses 2)
EUR m EUR m
Personnel Other expenses Regulatory levies Incidentals
2,000
1,500
-28 19
1,000 44
698
594
589
-76
38
500
1,353
1,348
620
596
582
0
Q1 Q2 Q3 Q4 Q1 Q1 2017 Divested Savings Inflation Invest- Restruc- Q1 2018
activities & levies ments turing
2017 2018
Personnel expenses trending down, mainly reflecting lower FTE levels
Restructuring provision (EUR 31m) relates to reorganisation of control and support activities (in GF) and Markets (in CIB) 3)
Other expenses remained flat vs. Q1 2017, reflecting mainly I&T run cost savings offset by higher IT costs for innovation
1) Q1 2017 still includes costs for PB Asia activities, which were divested on 1 April 2017
2) Inflation & Levies up EUR 38m, o/w EUR 16m one-off CLA payment and EUR 4m regulatory levies, remainder being mainly wage inflation
3) Q1 2018 incidentals: restructuring provision EUR 31m (Q1 2017 EUR 12m), one-off CLA effect EUR 16m
12High impairments in specific industry sectors
Impairments by business segment Breakdown Q1 2018 impairments
EUR m
Industry sector Impairments Segment Comment
RB CB CIB PB & GF
Shipping - OSV 46m CIB Global Transportation & Logistics,
250 208 former ECT-Transportation
Dutch SMEs 44m CB Health care, manufacturing
125 63
152 Off-shore services 42m CIB Natural Resources, former ECT-
-96
5 -34 Energy
77 44 Diamond & Jewellery 41m CIB
0
Commodities 8m CIB Part of Trade & Commodity Finance, ,
former ECT-Commodities
-125 Other 27m All
Total 208m
-250 Q1 Q2 Q3 Q4 Q1
2017 2018
Higher impairments, largely recorded in stage 3 on defaulted loans and unrelated to IFRS9 implementation
Oil & gas related impairments particularly in Off-shore Support Vessels (Shipping) and Off-shore services 2)
Impairments on several CB clients, predominantly in healthcare
Diamond & Jewellery sector faces challenges causing impairments, portfolio declined in recent years
1) As of 2018 impairments are recognised under IFRS9 accounting rules, which replaced IAS39 accounting rules
2) ECT has been reorganised into new CIB industry lending sectors. Impairments in ‘former ECT’ were EUR 97m over Q1 2018 (FY2017 EUR 186m, FY2016 EUR 209m)
13Strong CET1 capital provides resilience against Basel IV impact
CET1 fully loaded capital Risk weighted assets Leverage ratio fully loaded
Fully loaded CET1% RWA bn
2.3 0.0%
0.3%
-0.5
-0.1% -0.3% -0.1%
4.1%
17.7%
4.0%
107.9
17.5%
106.2
2017 Q4
Capital
Exposure
2018 Q1
Ops. &
Credit
2017 Q4
Market
2018 Q1
IFRS9
Retained
RWA
2017 Q4
2018 Q1
earnings
Measure
(IAS39)
Group
risk
risk
T1
Strong CET1 ratio 17.5%, includes IFRS9 impact of -12bps
RWAs up, driven by credit risk reflecting loan growth to Dutch SMEs, CIB (mainly FIs, Food & Retail) as well as higher RWAs for
defaulted loans
Fully loaded group leverage ratio at 4.0%, excluding a change in Clearing exposure measure improving the ratio by 0.5-0.6% 1)
MREL of 27.8% of RWA, on track to meet our 29.3% ambition by YE2019 (see appendix)
1) Basel IV and draft CRR propose a change in calculation of derivative exposures and credit conversion factors for off-balance sheet items. The revised calculation results in a decreasing exposure
measure for clearing guarantees by approximately EUR 55-60bn
14Capital management developments
Capital management framework
Aim to meet fully loaded Basel IV CET1 requirements early in the phase-in period
Capital target range of 17.5-18.5% to be reviewed at YE2018, to reflect RWA developments under Basel III and Basel IV
Dividend pay-out of 50% of sustainable profit, from 2018
Additional distributions will be considered when capital is within or above the target range and depending on other circumstances,
including regulatory and commercial considerations. Combined distribution amounts to at least 50% of sustainable profit
Basel III Capital & RWA drivers Basel IV RWA drivers
Regulatory: AMA, TRIM, FRTB, add-ons, NPL guidance Framework published on 7 Dec 2017
Capital requirements, SREP & stress test Awaiting regulatory decisions to be made
Business developments − Quantitative Impact Study (QIS)
Credit quality migration/developments − EU implementation
Model reviews and updates − Future supervisory decisions
FX movements Assessing opportunities for remediation
Management actions Investigating opportunities for repricing and adapting business
mix and model
15Financial targets
2017 2018 Q1 Targets
Return on Equity 14.5% 1) 11.5% 10-13%
60.1% 1) 57.9% 56-58%
Cost/Income ratio (by 2020)
CET1 ratio (FL) 17.7% 17.5% 17.5-18.5% 2)
(2018)
50% of sustainable profit 3)
Dividend Additional distributions
- per share (EUR) 1.45 - will be considered 3)
- pay-out ratio 50% Combined at least 50%
1) Excluding the gain on PB Asia sale the ROE was 13.4% and C/I was 61.2%
2) Capital target range to be reviewed at YE2018
3) Sustainable profit excludes exceptional items that significantly distort profitability; examples from the past would have been the book gain on PB Asia sale (2017) and the provision for SME derivatives
(2016). Additional distributions will be considered when capital is within or above the target range, and are subject to other circumstances, including regulatory and commercial considerations
16Highlights of Q1, a solid quarter
Financial progress
Net profit at EUR 595m and ROE of 11.5%, reflecting a strong operating result offset by high impairments
NII remained strong, benefitting from loan growth, driven by corporate loans, including Dutch SMEs
Improved operating result led to a C/I ratio of 57.9%
Strong CET1 capital ratio of 17.5%
Strategic progress
Cost savings from transformation and business simplification coming through
Progress on IT transformation, digital and innovation
Private Banking transformation taking shape
Bringing more focus to CIB, update at Q2
A leading franchise in sustainability is developing
On track to achieve 2020 financial targets
17appendix
Capital ambitions on track
Leverage ratio around ambition MREL on track towards ambition
Leverage ratio (FL) based on Tier 1 (CET1 and AT1) capital Based on Own Funds (CET1, AT1, T2), subdebt and NPS 1)
Leverage ratio Ambition YE2018 Exposure Measure MREL (in RWAs) Ambition YE2019
Ambition
Ambition
28.8%
28.1%
27.8%
29.3%
3.7%
4.1%
4.0%
4.0%
Q1 Q2 Q3 Q4 Q1 YE Q1 Q2 Q3 Q4 Q1 YE
2017 2018 2018 2017 2018 2019
Fully loaded group leverage ratio at 4.0% MREL framework now based on RWAs
Negative impact EBA Q&A ruling on minority interest Steering through profit retention, sub debt, NPS, balance
of -0.2% sheet management and excludes use of senior unsecured
Basel IV/CRR2 are estimated to decrease the exposure Increase of c. EUR 1.6bn in CET1 or eligible instruments
measure resulting in c. 0.5-0.6% improvement of the required to meet 29.3% ambition of YE2019, assuming no
leverage ratio change in RWAs
Implementation NPS in Dutch law expected in H2 2018. NPS
issuance not before YE2018
1) ABN AMRO Bank appointed as resolution entity: therefore external MREL eligible instruments continue to be issued through ABN AMRO Bank
19Disclaimer
For the purposes of this disclaimer ABN AMRO The information in the Presentation is, unless uncertainties. Forward-looking statements are
Group N.V. and its consolidated subsidiaries are expressly stated otherwise, not intended for not historical facts and represent only ABN
referred to as "ABN AMRO“. This document (the residents of the United States or any "U.S. AMRO's current views and assumptions on
“Presentation”) has been prepared by ABN person" (as defined in Regulation S of the US future events, many of which, by their nature,
AMRO. For purposes of this notice, the Securities Act 1933). No reliance may be placed are inherently uncertain and beyond our control.
Presentation shall include any document that on the information contained in the Presentation. Factors that could cause actual results to differ
follows and relates to any oral briefings by ABN No representation or warranty, express or materially from those anticipated by forward-
AMRO and any question-and-answer session implied, is given by or on behalf of ABN AMRO, looking statements include, but are not limited
that follows such briefings. The Presentation is or any of its directors or employees as to the to, (macro)-economic, demographic and political
informative in nature and is solely intended to accuracy or completeness of the information conditions and risks, actions taken and policies
provide financial and general information about contained in the Presentation. ABN AMRO applied by governments and their agencies,
ABN AMRO following the publication of its most accepts no liability for any loss arising, directly financial regulators and private organisations
recent financial figures. This Presentation has or indirectly, from the use of such information. (including credit rating agencies), market
been prepared with care and must be read in Nothing contained herein shall form the basis of conditions and turbulence in financial and other
connection with the relevant Financial any commitment whatsoever. ABN AMRO has markets, and the success of ABN AMRO in
Documents (latest Quarterly Report and Annual included in this Presentation, and from time to managing the risks involved in the foregoing.
Financial Statements, "Financial Documents"). time may make certain statements in its public Any forward-looking statements made by ABN
In case of any difference between the Financial statements that may constitute “forward-looking AMRO are current views as at the date they are
Documents and this Presentation the Financial statements”. This includes, without limitation, made. Subject to statutory obligations, ABN
Documents are leading. The Presentation does such statements that include the words ‘expect’, AMRO does not intend to publicly update or
not constitute an offer of securities or a ‘estimate’, ‘project’, ‘anticipate’, ‘should’, ‘intend’, revise forward-looking statements to reflect
solicitation to make such an offer, and may not ‘plan’, ‘probability’, ‘risk’, ‘Value-at-Risk (“VaR”)’, events or circumstances after the date the
be used for such purposes, in any jurisdiction ‘target’, ‘goal’, ‘objective’, ‘will’, ‘endeavour’, statements were made, and ABN AMRO
(including the member states of the European ‘outlook’, 'optimistic', 'prospects' and similar assumes no obligation to do so.
Union and the United States) nor does it expressions or variations on such expressions.
constitute investment advice or an investment In particular, the Presentation may include
recommendation in respect of any financial forward-looking statements relating but not
instrument. Any securities referred to in the limited to ABN AMRO’s potential exposures to
Presentation have not been and will not be various types of operational, credit and market
registered under the US Securities Act of 1933. risk. Such statements are subject to
2020180514 Investor Relations - non-US Q1 2018 Address Gustav Mahlerlaan 10 1082 PP Amsterdam The Netherlands Website ABN AMRO Group www.abnamro.com/ir Questions investorrelations@nl.abnamro.com
You can also read