FY 2017 Results Klaus Schäfer - CEO Christopher Delbrück - CFO - 08 March 2018

Page created by April Walker
 
CONTINUE READING
FY 2017 Results Klaus Schäfer - CEO Christopher Delbrück - CFO - 08 March 2018
FY 2017 Results
Klaus Schäfer - CEO
Christopher Delbrück – CFO
08 March 2018
FY 2017 Results Klaus Schäfer - CEO Christopher Delbrück - CFO - 08 March 2018
Agenda – 2017 Full Year Results

1. Highlights 2017
  Klaus Schäfer, CEO

2. Financial Results 2017 and Outlook 2018
  Christopher Delbrück, CFO

  Appendix

                                             2
FY 2017 Results Klaus Schäfer - CEO Christopher Delbrück - CFO - 08 March 2018
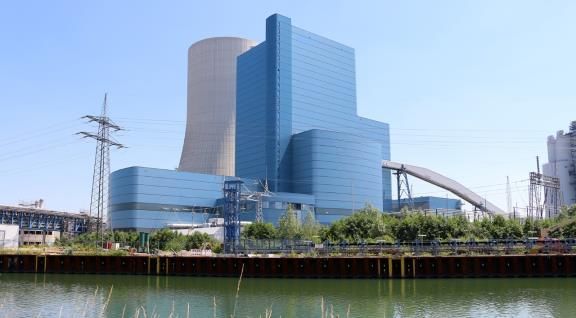
Highlights – Action Plan completed, sound
financials, setting sails with new strategy
                                       Cost cutting with delivery slightly ahead of plan
               Action Plan executed    Leverage target achieved
  FY2017                               Key rating KPIs achieved

 In delivery
                                       EBIT target achieved
    mode
                Dividend proposal
                                       Strongly rising free cash from operations
                 raised to €271m
                                       Dividend proposal for FY2017 raised to €271m (+35%)

               Reiterating earnings    Confirming 2018 EBIT outlook: €0.8bn - €1.1bn
               and dividend outlook    Confirming plan to raise FY2018 dividend to c.€310m
  FY2018

 Setting the
    sails         Implementing         Large legacy growth projects in progress
                 strategic growth
                     projects          Strategy implementation now started

                                                            Uniper SE, Presentation FY 2017, 08 Mar 2018   3
FY 2017 Results Klaus Schäfer - CEO Christopher Delbrück - CFO - 08 March 2018
Balance sheet in good shape – Rating upgrade
pending
Economic net debt to EBITDA multiple                                       Key highlights

                                                                           Deleveraging achieved
                                                                            Target level of Economic net debt to EBITDA
          2.7
                                                                             of considerably below 2.0x achieved
                                                                            No further disposals needed – only for cash
                                                                             accretive capital rotation
                      2.0                                                   Delivery of growth projects will drive
                                              1.8 - 2.0
                                                          1                  net debt to EBITDA development
                                                                            Target to stay below 2.0x, post adaptation of
                                    1.4
                                                                             IFRS 16

                                                                           S&P retains positive outlook
                                                                            Indicating a potential upgrade over the next
                                                                             12 months barring any negative impact on
                                                                             Uniper’s credit quality
                                                                            S&P requires improved visibility that there
                                                                             would be no change to Uniper's independence,
                 2
         2015A       2016A        2017A                         Way          strategy, or financial policy from new
                                                              forward
                                                                             shareholder structure

           1. Post IFRS 16 implementation
           2. Calculation based on pro-forma economic net debt of €4.7bn         Uniper SE, Presentation FY 2017, 08 Mar 2018   4
FY 2017 Results Klaus Schäfer - CEO Christopher Delbrück - CFO - 08 March 2018
Operational efficiency significantly improved

Cost reduction                                                                   Maintenance capex
                                                                                  €m
                                                                                          753

                                                   Achieved in 2016
                                                                                                          400             392
                 €0.4bn                            Achieved in 2017

                                                   To be achieved by
                                                   2018
                                                                                                1
                                                                                        2015A           2016A           2017A            2018E

Fully on track                                                                   Optimisation continues
 All major planned projects implemented                                          Clear ambition to stay below 400 million Euro mark
 Noticeable savings within IT infrastructure achieved                            New approach implemented successfully
 Reconciliation of interest with workers council finalized with                    Reduced maintenance capex achieved
  main effects incorporated for 2018                                                Safety first priority
 No further cost cutting program on the agenda, but focus to                     Further efficiency projects ongoing
  establish a constant performance culture

              1. 2015 figure includes major Swedish nuclear upgrade investment                      Uniper SE, Presentation FY 2017, 08 Mar 2018   5
FY 2017 Results Klaus Schäfer - CEO Christopher Delbrück - CFO - 08 March 2018
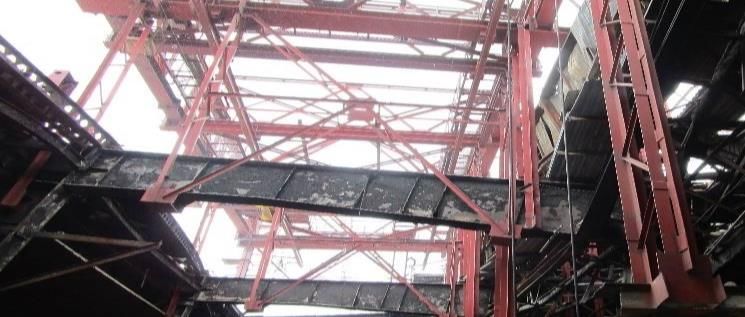
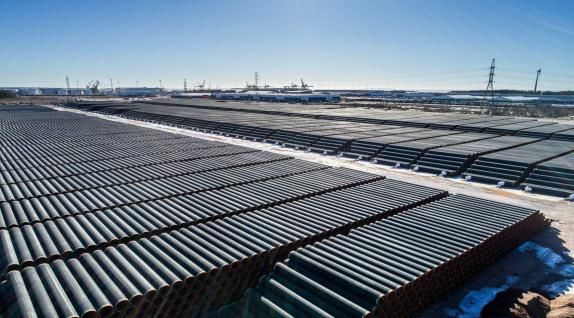
Large asset projects progressing

Berezovskaya III lignite plant                      Datteln IV coal plant                           Nord Stream II pipeline project

Repair measures on track                              Plant in ramp-up mode                           Project still on track
 Project progressing in line with time                Investments to finalize project widely         First national permits received,
  and budget                                            executed                                        but political headwinds continue
 Pre-assembling in advanced stage                     Steel related issues with boiler still         NS II has drawn mezzanine loans
 RUB~15bn capex spent so          far1                 under review                                    from European finance partners
 RUB~21bn capex to be spent1                          Final assessment of impact on                  Remaining expenditures to be
                                                        project timing expected soon                    largely covered by project financing
 COD expected in Q3 2019
                                                       COD not before Q4 2018                         We stay confident that the key
                                                       Expecting a first court decision on             project parameters will hold
                                                        validity of LTCs still in March

              1. As of YE 2017
              Source photos: Unipro, Uniper, Nord Stream 2 public photo stock                    Uniper SE, Presentation FY 2017, 08 Mar 2018   6
FY 2017 Results Klaus Schäfer - CEO Christopher Delbrück - CFO - 08 March 2018
Energy policy – EU ETS reform almost finalized,
our bullish view stays in tact
Europe-wide coal exit                  EU ETS reform on finishing                    Security of supply: capacity
discussion                             straight                                      market scheme UK
                                       €/ton                                          £/kW                                            GW
     Markets with                      10                                                        Price     Capacity Uniper (r.h.s.)
                                                                                       24.0                                           8.0
  coal exit deadlines
                                                                                       18.0                                           6.0
                                        8
                                                                                       12.0                                           4.0
                                        6
                                                                                        6.0                                           2.0

                                        4                                               0.0                                           0.0
                                        Jan-17   May-17     Sep-17     Jan-18                  17/18 18/19 19/20 20/21 21/22

European coal exit plans               European Emissions Trading                     European capacity market
becoming clearer                       System empowered                               schemes work
 France with ambitious exit target,    EU Parliament approved reform                 EU Commission just approved new
  scheduled for 2022                    Final step is formal adoption by the           market-wide capacity mechanisms
 Other governments target exit          Council in March or April                     UK capacity market auction as a
  between 2025 and 2030                 Strong price signals by significantly          strong competitive tool
 Germany on slow trajectory             tightening the market                         Disappointing T-4 auction (2021/22)
                                                                                        will require higher spreads

                                                                                 Uniper SE, Presentation FY 2017, 08 Mar 2018               7
Strategy implementation now on the agenda

Grow non-wholesale and benefit from                                                  Examples
merchant upside as key strategic angle                                               Modernization initiative in Russia – framework
(development of Group EBITDA mix over time)                                          conditions
                                                                                      Modernization of 4 GW p.a. with COD starting from 2022
                                                                                      Supply agreements for 15 years based on tenders
                                                                                      Prolongation of KOM horizon from 4 to 6 years
                                                                                      Expected next steps in 2018:
                                                                                        Q2: new regulation to be approved
                                                                                        Q3: KOM considering new regulation
     20161                     2020E                 2025E (indicative)
                                                                                        Q4: selection of modernization projects
                      Wholesale              Non-Wholesale
                                                                                     New global trading activities – expanding coal
                                                                                     marketing in the US
Investment to foster non-wholesale exposure                                           Uniper takes advantages from changes in the US coal
                                                                                       market where export and trading expertise becomes key
                                                                                       success factor as players are withdrawing from the market
      Benefit from merchant market upsides
                                                                                      Blackjewel joint venture gives constant export / trading flow
             Diversify risks in contract portfolios                                    and enables domestic versus export optimization
                                                                                      Optimization potential further enlarged through additional
      Develop and grow non-wholesale elements
                                                                                       offtake agreements with US coal producers
                                                                                      Additional arbitrage opportunities by exporting into Asian
                                                                                       market based on price levels and available logistic
                                                                                       capacities

               1. Adjusted for extraordinary effect due to settlement with Gazprom                    Uniper SE, Presentation FY 2017, 08 Mar 2018     8
Agenda – 2017 Full Year Results

1. Highlights 2017
  Klaus Schäfer, CEO

2. Financial Results 2017 and Outlook 2018
  Christopher Delbrück, CFO

  Appendix

                                             9
Key financials 2017

Adj. EBIT(DA)                         Operating cash flow, adj. FFO                Economic net debt
€bn                                   €bn                                           €bn         2.0x               1.4x
         2.1
                          1.7

                                            2.2                                                 4.2
         1.4                                       1.4                                                               2.4
                          1.1
                                                            0.5      0.8

       FY 2016          FY 2017             OCF    OCF    Adj. FFO Adj. FFO                  YE 2016              YE 2017
                                            2016   2017    2016     2017
               EBIT   EBITDA

Adj. EBIT(DA) down                     Normalization of operating                     Economic net debt
 Driven by absence of 2016 one-off    cash flow                                      significantly reduced
  effects in the gas business           Operating cash flow down based                Net financial debt position
  (LTC-settlement and strong gas         on omission of 2016 one-off                    significantly reduced vs. YE 2016
  optimization results) …                effects and normalization of                   due to sale of Yushno Russkoye
 … partly offset by strong Unipro       working capital effects                        gas field to OMV
  results                                                                              Furthermore supported by strong
                                       Adj. FFO significantly up
                                                                                        OCF and lower pension provisions
                                        Strong increase driven by lower
                                         provision utilization

                                                                              Uniper SE, Presentation FY 2017, 08 Mar 2018   10
Adjusted EBIT – 2017 earnings reduction driven
by normalization in gas business
Reconciliation Adj. EBIT 2016 to Adj. EBIT 2017
   €bn
               Adj. EBIT 2016                                    1.4

              Gas business                               - 0.9

              Berezovskaya - omission boiler write-off                  +0.2

              Berezovskaya - higher insurance payments                              +0.2

              Cost savings                                                                 +0.1

              Lower nuclear/hydro taxes and omission of high nuclear provisioning                 +0.1

              Reduced D&A                                                                                +0.1

              UK and FR capacity markets and Russia CSA uplift                                                  +0.1

              Decline in achieved outright prices                                              - 0.1

              Other                                                                    - 0.1

               Adj. EBIT 2017                                    1.1

                                                                                     Uniper SE, Presentation FY 2017, 08 Mar 2018   11
Adj. EBIT(DA) to OCF conversion back to more
normalized levels
Reconciliation Adj. EBIT 2017 to operating cash flow 2017
 €m
                                     447

                 627                                      508
                                                                     -16                      -1

                                                                                                           - 332
                                               - 962

                          1,741                                                1,718
                                                                                                                         1,385
   1,114

 Adj. EBIT    Depreci- Adj. EBITDA Non-cash Provision Changes in Payments     OCFbIT        Interest        Tax           OCF
 FY 2017      ation and   FY 2017  effective utilization working related to   FY 2017      payments       payments       FY 2017
             amortization          EBITDA                capital non-oper.
                                    items                        earnings,
                                                                   others

                                                                               Uniper SE, Presentation FY 2017, 08 Mar 2018        12
FFO to dividend conversion substantiates
dividend increase for fiscal 2017
Reconciliation funds from operations (FFO) to free cash from operations (FCfO)
 €m

                   -35
                                       -65
                                                           -100

      953
                                                                               753

                                                                                                     -392                                             75% of FCfO
                                                                                                                      361
                                                                                                                                                    to be distributed
                                                                                                                                                     to shareholder
                                                                                                                                         271
                                                                                                                                                  (+8% vs. guidance)

    FFO        Dividend to              Net              Pension             Adj. FFO          Maintenance           FCfO             Dividend
   FY 2017     minorities          contribution        service cost          FY 2017               and              FY 2017           proposal
                                                                    1
                                    to Swedish         contribution                            replacement                            FY 2017
                                   nuclear fund                                                investments

             1. Pension service costs now include pension obligations from the integration of EBS.          Uniper SE, Presentation FY 2017, 08 Mar 2018        13
Economic net debt significantly improved
thanks to Yuzhno disposal
Economic net debt
                                                                           > -40%
 €bn
            4.2

             1.0

             0.8
                                                                                                                        0.5              2.4

                              -1.8
                                                                  0.8                                                                     1.0

                                                                                    -0.1             0.2
             2.4                                                                                                                          0.7
                                               -1.4

                                                                                                                                          0.8

        Economic net Divestments               OCF              Capex            Pension        Dividend paid         Other        Economic net
        debt YE 2016                                                                                                               debt YE 2017

                                                           AROs 1         Pension          Net financial position 2

           1. Includes nuclear and other asset retirement obligations (AROs) as well as receivables from Swedish nuclear waste fund (KAF).
           2. Includes cash & cash equivalents, non-current securities, financial receivables from
              consolidated group companies and financial liabilities.                                     Uniper SE, Presentation FY 2017, 08 Mar 2018   14
2018 Outlook – Earnings like for like unchanged

Reconciliation from Adj. EBIT 2017 to Adj. EBIT 2018
  €bn
               Adj. EBIT 2017                              1.1

               Yuzhno-Russkoye disposal

               Berezovskaya - lapse of insurance payment

               Decline in achieved outright prices

               Taxes in Sweden

               UK capacity market

               Cost cutting

               Other

               Adj. EBIT 2018                                    0.8               1.1

                                                                       Range

                                                                       Uniper SE, Presentation FY 2017, 08 Mar 2018   15
2018 Outlook – Further dividend growth ahead

Adj. EBIT                         Dividend                  Key highlights                                      TBU
€bn                               €bn
                                                            European Generation
                      1.1                            0.31
                                        0.27                 Increasing contribution from UK and French
                  Range
                                                              capacity payments
                      0.8                                    Final reduction of Swedish nuclear capacity
      1.1
                                                              tax and further reduction of hydro property
                            0.9                               tax
                                                             Lower achieved outright prices

      2017A       2018E             FY2017A       FY2018E
                                                            Global Commodities
                                                             Improved earnings in power, coal and LNG
Adjusted EBIT contribution by segment                        Lapse of Yuzhno-Russkoye gas upstream
                                                              earnings
Segments                            EBIT 2018E vs 2017A      Cost savings

                                                            International Power
European Generation                 Noticeably above
                                                             Increased payments from capacity supply
                                                              agreements
Global Commodities                  Significantly above
                                                             Lapse of insurance payments for
                                                              Berezovskaya III power plant
International Power                 Significantly below

                                                                 Uniper SE, Presentation FY 2017, 08 Mar 2018         16
Focus on our shareholder from day one on

                Good financial performance 2017
                 giving upside for higher dividend
                 proposal
Getting the                                                             Proven commitment
 house in       Action Plan executed balancing
                                                                          to shareholders
  order          attractive cash returns and balance                       since spin off
                 sheet stability
                Strong share performance since
                 inception

                Earnings mix to improve significantly
                 towards 2020
                                                                     Attractive development
 Setting the
                Significant additional upside from                        potential for
    sails
                 outright positions in power and gas                      Uniper shares
                Strongly growing base dividend

                                                         Uniper SE, Presentation FY 2017, 08 Mar 2018   17
Agenda – 2017 Full Year Results

1. Highlights 2017
  Klaus Schäfer, CEO

2. Financial Results 2017 and Outlook 2018
  Christopher Delbrück, CFO

  Appendix

                                             18
Markets – Power prices and commodities

 Germany – Baseload power 2019                            Germany – CDS, CSS 2019                                Gas Europe – summer/winter spread
     €/MWh                                 $/ton                  €/MWh                                               €/MWh
38                                                  95    15                                                    2.0
                                                          10
33
                                                    75        5                                                 1.5
28                                                            0
                                                    55     -5                                                   1.0
23
                                                          -10

18                                                  35    -15                                                   0.5
 Jan-16   Jul-16     Jan-17     Jul-17    Jan-18            Jan-16     Jul-16   Jan-17    Jul-17   Jan-18         Jan-16     Jul-16    Jan-17     Jul-17     Jan-18
                                                                        CDS 2019          CSS 2019                           NCG summer/winter spread
          Baseload (l.h.s.)         Coal (API2)

 Nordpool – Baseload power 2019                           UK – CDS, CSS Winter 2018/19                           FX
     €/MWh                                                        £/MWh                                                Rebased to 100
30                                                       10                                                     130

                                                                                                                115
25                                                        5
                                                                                                                100
20                                                        0
                                                                                                                 85

15                                                       -5                                                      70
 Jan-16   Jul-16     Jan-17     Jul-17    Jan-18          Jan-16      Jul-16    Jan-17   Jul-17    Jan-18         Jan-16     Jul-16    Jan-17     Jul-17     Jan-18

                                                                     CSS 2018/19         CDS 2018/19                   RUB/EUR          SEK/EUR            GBP/EUR

                   Source: Uniper
                   Note: based on price quotes until 01 March 2018                                          Uniper SE, Presentation FY 2017, 08 Mar 2018              19
Outright power hedging in Germany and Nordic

Outright position – baseload power price

              >80%                      >80%            >75%                           >15%

     €/MWh           >90%                        >85%          >65%                              >35%

        35

        30

        25

        20

                                                                                               Status: December 2017
        15
                 2017                         2018         2019                             2020

                     Achieved price Germany                       Hedge ratio Germany

                     Achieved price Nordic                        Hedge ratio Nordic

                                                                     Uniper SE, Presentation FY 2017, 08 Mar 2018      20
Group EBIT(DA) in FY 2017 –
Robust performance
Adj. EBIT development by segment in FY 2017                                            Highlights
€m                                                                                     European Generation
                      211
                                                                                        (+) Reduced hydro property tax and
                                                510                                          nuclear capacity tax
                                                               17
                                                                                        (+) Lapse of restructuring one-off
      1,362                                                                             (+) Lower depreciation
                                                                           1,114
                                   -986                                                 (-) Lower outright prices and spreads

     FY 2016   European          Global    International   Admin./Cons.   FY 2017      Global Commodities
               Generation      Commodities    Power                                     (-) Lapse of Gazprom one-off effects
Adj. EBIT(DA) in FY 2017                                                                (-) Normalization of optimization
                                                                                             results
                                                       EBITDA                 EBIT
€m                                                                                     International Power
                                                       FY 2017             FY 2017
                                                                                        (+) Lapse of write-off on
European Generation                                         780                337
                                                                                             Berezovskaya III boiler
Global Commodities                                          420                341      (+) Final insurance payment received
International Power                                         714                616      (+) Improving underlying earnings due
Administration/Consolidation                                -173              -180
                                                                                             to increase of capacity payments

Total                                                      1,741             1,114

                                                                                     Uniper SE, Presentation FY 2017, 08 Mar 2018   21
European Generation in FY 2017 –
Solid performance across all activities
Adj. EBIT development by sub-segment in FY 2017                               Main effects
€m                                                                            Hydro
                                       61
                              38                                               (+) Lapse of 2016 restructuring one-off
                                                     -17                        (+) Reduced hydro property tax
                      130
                                                                                (+) positive volume effect in Sweden
                                                                337
                                                                              Nuclear
      126                                                                      (+) Ringhals 2 back in operation
                                                                               (+) Nuclear capacity tax reduced
     FY 2016     Hydro      Nuclear   Fossil     Admin/Cons.   FY 2017
                                                                               (-) Lower achieved prices
                                                                               (+) Lapse of one-off nuclear provision
Adj. EBIT(DA) in FY 2017
                                                                              Fossil
                                               EBITDA              EBIT
€m                                                                             (+) Lower depreciation
                                               FY 2017          FY 2017
                                                                               (+) Lapse of 2016 restructuring one-off
Hydro                                             381              323
                                                                               (+) Income from system operators
Nuclear                                            85                 22
                                                                               (-) Further pressure on spreads
Fossil                                            360                 40

Other/Consolidation                                -45                -48

Total                                             780              337

                                                                            Uniper SE, Presentation FY 2017, 08 Mar 2018   22
Global Commodities in FY 2017 – Normalization
in midstream gas business
Adj. EBIT development by sub-segment in FY 2017                    Main effects                                 TBU
€m                                                                 Gas
                                                                    (-) Lapse of 2016 one-offs
                                                                            Gazprom provision release
                                                                            Extraordinary optimization gains
       1,327                     20
                           57                                                not repeated
               - 914                        - 149    341           Yuzhno Russkoye (YR)
                                                                    (+) Higher volumes and prices
     FY 2016   Gas     YR       COFL       Power    FY 2017
                                                                         (2016 was a make-up year)

Adj. EBIT(DA) in FY 2017                                           COFL
                                                                    (+) Coal business supported by coal
                                       EBITDA          EBIT             price spike
 €m
                                       FY 2017      FY 2017
                                                                    (+) Improved LNG performance
 Gas                                      465           420

 YR                                       146           133
                                                                   Power
                                                                    (-) Lower power optimization and
 COFL                                       -6             -18
                                                                     trading result
 Power                                    -185          -195

 Total                                    420           341

                                                                 Uniper SE, Presentation FY 2017, 08 Mar 2018         23
International Power in FY 2017 – Significant
one-off effects and strong underlying earnings
Adj. EBIT development by sub-segment in FY 2017                    Main effects                                 TBU
€m                                                                 Russia
                                                                    (+) Significant one-off effects:
                                   4
                     505                                                    Lapse of 2016 write-off on
                                                                             Berezovskaya III boiler
                                                                             Insurance proceeds received
                                                  616
                                                                             and booked in Q2
          106                                                       (+) Improving underlying earnings due
                                                                         to increase of capacity payments
         FY 2016    Russia       Brazil          FY 2017
                                                                         and day-ahead market price
                                                                    (+) Positive FX effects
Adj. EBIT(DA) in FY 2017

                                       EBITDA          EBIT
€m
                                       FY 2017      FY 2017
Russia                                    719              621

Brazil                                      -6              -6

Total                                     714              616

                                                                 Uniper SE, Presentation FY 2017, 08 Mar 2018         24
Uniper Group –
Adjusted EBIT(DA) by segment
Adj. EBITDA

€m                             FY 2017                FY 2016                  %

European Generation                 780                     654               19

Global Commodities                  420                   1,456               -71

International Power                 714                     201               255

Admin / Consolidation              -173                    -189                -8

Total                             1,741                   2,122               -18

Adj. EBIT
€m                             FY 2017                FY 2016                  %

European Generation                 337                     126               168

Global Commodities                  341                   1,327               -74

International Power                 616                     106               480

Admin / Consolidation              -180                    -197                -9

Total                             1,114                   1,362               -18

                               Uniper SE, Presentation FY 2017, 08 Mar 2018    25
Uniper Group –
Adjusted EBIT(DA) by sub-segment
Adj. EBITDA and EBIT

                                                                               FY 2017                   FY 2016                  FY 2017                 FY 2016
€m
                                                                          Adj. EBITDA               Adj. EBITDA                  Adj. EBIT               Adj. EBIT

European Generation*                     Hydro                                        381                      255                     323                    193

                                         Nuclear                                       85                        42                     22                     -16

                                         Fossil                                       360                      385                      40                     -22

                                         Other/ Cons.                                 -45                       -28                    -48                     -30

                                         Subtotal                                     780                      654                     337                    126
Global Commodities                       Gas                                          465                    1,415                     420                  1,334
                                         YR                                           146                      114                     133                     77
                                         COFL                                           -6                      -34                    -18                     -38
                                         Power                                       -185                       -39                   -195                     -46
                                         Subtotal                                     420                    1,456                     341                  1,327
International Power                      Russia                                       719                      211                     621                    116
                                         Brazil                                         -6                      -10                      -6                    -10
                                         Subtotal                                     714                      201                     616                    106
Admin./ Consolidation                                                                -173                     -189                    -180                   -197

Total                                                                               1,741                    2,122                  1,114                   1,362

              * Pro-forma figures for European Generation 2016 based on adjustements for shift between Fossil and Other/ Cons.
                                                                                                          Uniper SE, Presentation FY 2017, 08 Mar 2018          26
1,362
Uniper Group net income distorted by
Yuzhno-Russkoye disposal
Reconciliation Adj. EBITDA 2017 to net income 2017
 €m

                - 627
      1,741                                                          88

                                                  - 360
                                 1,114
                                                                                   - 400              -9

                                                                                                                                                      -656

                                                                                                                      -890
                                                                                                                                     -199
   Adj.         D&A              Adj.         Economic           MTM               Net              Other             OCI 1        Taxes on            Net
  EBITDA                         EBIT          interest,       Derivatives     impairments 1                                         non-           Income 2
                                                taxes,                                                                             operating
                                              minorities                                                                           earnings,
                                                                                                                                   minorities
                              Underlying earnings                               Non-operating results

              1. Net impairments and other comprehensive net income are affected by the sale of our share in the
                 Yushno-Russkoye field to the Austrian oil and gas company OMV Exploration & Production.
              2. Net income attributable to Uniper shareholders.                                            Uniper SE, Presentation FY 2017, 08 Mar 2018       27
IFRS 16 leases – Higher debt but also higher
EBITDA; nothing new for rating agencies
Balance sheet impact: increased liabilities                                                             Main effects
                                Old Treatment                       New Treatment                       Additional liabilities on balance sheet
                          Finance           Operating                                                    In 2018, IFRS 16 adds operating lease on
                                                                        All Leases
                          Leases             Leases                                                       balance as liabilities
Assets                                           ---                         ---                         Operating leases are mostly concentrated on
Liabilities                                      ---                                                      large gas storage contracts
Off balance rights                                                                                      Slightly positive earnings impact
Off balance                   ---                                            ---
                                                                                                         Expenses for operating lease booked under
obligations
                                                                                                          EBITDA line
                                                                                       (illustrative)
                                                                                                         Profit before tax not affected
IFRS 16 raises Uniper’s debt factor
                                                                                                        Net debt factor
                                                                                                         With IFRS 16 leases, pro-forma debt factor
                                                                                                          as of end 2017 would be higher by ~0.2x1
                                                                                                         Rating Agencies already accounted for these
  Uniper Debt                                                                      New Uniper
                     ÷                                                 ÷                                  liabilities also before 2018
    Factor                                                                         Debt Factor
                                                                                                         No impact on rating expected
                                                                             ~0.2x         higher1
                                                                                                        Impact already incorporated in ‘Strategic
                                                                                    (illustrative)
                                                                                                        & Financial Update’ in December 2017

                           Uniper debt            Uniper debt
                             factor                 factor2
                 1. Pro-forma Net Debt / EBITDA effect if IFRS 16 operating leases were added
                    as of 31 Dec 2017.                                                                      Uniper SE, Presentation FY 2017, 08 Mar 2018   28
Uniper SE and subsidiaries –
Key P&L items at a glance
Key P&L items

€m                                                                        FY 2017                   FY 2016

Sales                                                                       72,238                   67,285
Adjusted EBITDA                                                              1,741                    2,122
Economic depreciation and amortization / reversals                            -627                     -760
Adjusted EBIT                                                                1,114                    1,362
Non-operating adjustments                                                   -1,226                   -5,325
EBIT                                                                          -112                   -3,963

Net interest income / expense                                                   -18                    -295
Income taxes                                                                  -408                    1,024
Net income / loss after income taxes                                          -538                   -3,234

Attributable to the shareholders of Uniper SE                                 -656                   -3,217
Attributable to non-controlling interests                                      118                      -17

                                                     Uniper SE, Presentation FY 2017, 08 Mar 2018        29
Uniper SE and subsidiaries –
Details on non-operating adjustments
Non-operating adjustments

€m                                                                               FY 2017                    FY 2016

Net book gains / losses                                                               -890                     522

Fair value measurement of derivative financial instruments                              88                   -1,636

Restructuring / cost management expenses                                               -18                     -344

Non-operating impairment charges / reversals                                          -400                   -2,921

Miscellaneous other non-operating earnings                                               -6                    -946

Non-operating adjustments                                                           -1,226                   -5,325

                                                             Uniper SE, Presentation FY 2017, 08 Mar 2018        30
Uniper SE and subsidiaries –
Consolidated balance sheet (1/2)
Balance sheet of the Uniper Group – assets
€m                                                                31 Dec 2017                31 Dec 2016
Goodwill                                                                  1,890                    2,701
Intangible assets                                                           819                    2,121
Property, plant and equipment                                            11,496                   11,700
Companies accounted for under the equity method                             448                      827
Other financial assets                                                      814                      728
      Equity investments                                                    710                      568
      Non-current securities                                                104                      160
Financial receivables and other financial assets                          3,308                    3,054
Operating receivables and other operating assets                          3,206                    3,857
Income tax assets                                                             6                        6
Deferred tax assets                                                         890                    2,205
Non-current assets                                                       22,877                   27,199

Inventories                                                               1,659                    1,746
Financial receivables and other financial assets                          1,195                    1,268
Trade receivables and other operating assets                             16,163                   18,250
Income tax assets                                                           170                       64
Liquid funds                                                              1,027                      341
Assets held for sale                                                         70                        3
Current assets                                                           20,284                   21,672

Total assets                                                             43,161                   48,871

                                                   Uniper SE, Presentation FY 2017, 08 Mar 2018       31
Uniper SE and subsidiaries –
Consolidated balance sheet (2/2)
Balance sheet of the Uniper Group – equity and liabilities
€m                                                                          31 Dec 2017                31 Dec 2016
Capital stock                                                                         622                      622
Additional paid-in capital                                                         10,825                   10,825
Retained earnings                                                                   3,399                    4,156
Accumulated other comprehensive income                                             -2,699                   -3,382
Equity attributable to the shareholders of Uniper SE                               12,147                   12,221
Attributable to non-controlling interest                                              642                      582
Equity (net assets)                                                                12,789                   12,803

Financial liabilities                                                                 961                    2,376
Operating liabilities                                                               3,618                    3,993
Provisions for pensions and similar obligations                                       676                      785
Miscellaneous provisions                                                            6,068                    6,517
Deferred tax liabilities                                                              390                    1,601
Non-current liabilities                                                            11,713                   15,272
Financial liabilities                                                                 962                      494
Trade payables and other operating liabilities                                     16,277                   18,348
Income taxes                                                                           55                      188
Miscellaneous provisions                                                            1,362                    1,766
Liabilities associated with assets held for sale                                        3                        –
Current liabilities                                                                18,659                   20,796

Total equity and liabilities                                                       43,161                   48,871

                                                             Uniper SE, Presentation FY 2017, 08 Mar 2018       32
Uniper SE and subsidiaries –
Net financial position
Net financial position of the Uniper Group
€m                                                                                                31 Dec 2017                31 Dec 2016

Liquid funds                                                                                               1,027                    341

Non-current securities                                                                                       104                    160

Financial liabilities                                                                                     -1,923                  -2,870

Net financial position                                                                                      -792                  -2,369

Provisions for pensions and similar obligations                                                             -676                    -785

Asset retirement obligations1                                                                               -977                  -1,013

Economic net debt                                                                                         -2,445                  -4,167

                  1. Reduced by receivables from the Swedish Nuclear Waste Fund.   Uniper SE, Presentation FY 2017, 08 Mar 2018       33
Uniper SE and subsidiaries –
Consolidated statement of cash flows
Statement of cash flows of the Uniper Group
€m                                                                                                          FY 2017                    FY 2016
Net income / loss                                                                                              -538                     -3,234
Depreciation, amortization and impairment of intangibles / property, plant, equipment                         1,198                      4,135
Changes in provisions                                                                                          -608                         11
Changes in deferred taxes                                                                                       309                     -1,184
Other non-cash income and expenses                                                                              -96                       -298
Gain / loss on disposals                                                                                        865                       -404
Changes in operating assets and liabilities and in income tax                                                   255                      3,158
Cash provided (used for) by operating activities                                                              1,385                      2,184
Proceeds from disposals                                                                                       1,796                      1,235
Payments for investments                                                                                       -843                       -781
Payments from disposals                                                                                         -66                          -
Proceeds from disposals of securities (>3M) and of financial receivables                                        951                        790
Purchases of securities (>3M) and of financial receivables                                                   -1,215                     -1,561
Changes in restricted cash and cash equivalents                                                                -106                        -11
Cash provided (used for) by investing activities                                                                517                       -328
Payments received / made from changes in capital                                                                 15                        127
Transactions with the E.ON Group                                                                                  -                     -2,738
Cash dividends paid to shareholders of Uniper SE                                                               -201                          -
Cash dividends paid to other shareholders                                                                       -35                        -44
Proceeds from financial liabilities                                                                              23                      1,662
Repayment of financial liabilities                                                                             -931                     -1,007
Cash provided (used for) by financing activities                                                             -1,129                     -2,000
Net increase / decrease in cash and cash equivalents                                                            773                       -144
Effect from foreign exchange rates on cash and cash equivalents                                                 -12                         14
Cash and cash equivalents at the beginning of the year                                                          169                        299
Cash and cash equivalents of deconsolidated companies                                                           -79                          -
Cash and cash equivalents at the end of the quarter                                                             851                        169

                                                                                        Uniper SE, Presentation FY 2017, 08 Mar 2018         34
Uniper – Contact your Investor Relations team

 Uniper SE                            Udo Giegerich                               Marc Koebernick
 Investor Relations                   Executive Vice President                    Head of Investor Relations (SVP)
 E.ON-Platz 1                         Group Finance & Investor Relations                            +49 211 4579 4489
 40479 Duesseldorf                          udo.giegerich@uniper.energy                  marc.koebernick@uniper.energy
 Germany

                 +49 211 4579 4400
                   ir@uniper.energy

 Carlo Beck                           Mikhail Prokhorov                           Peter Wirtz
 Manager Investor Relations           Manager Investor Relations                  Manager Investor Relations
                  +49 211 4579 4402                    +49 211 4579 4484                               +49 211 4579 4414
           carlo.beck@uniper.energy      mikhail.prokhorov@uniper.energy                        peter.wirtz@uniper.energy

                                                                           Uniper SE, Presentation FY 2017, 08 Mar 2018     35
Financial calendar & further information

Financial calendar
08 May 2018
Quarterly Statement January – March 2018

06 June 2018
AGM (Essen, Grugahalle)

07 August 2018
Interim Report January – June 2018

13 November 2018
Quarterly Statement January – September 2018

Further information
https://ir.uniper.energy

                                               36
Disclaimer

This document and the presentation to which it relates contains information relating to Uniper SE, ("Uniper" or the "Company") that must not be relied upon for any purpose and may not be redistributed,
reproduced, published, or passed on to any other person or used in whole or in part for any other purposes. By accessing this document you agree to abide by the limitations set out in this document.
This document is being presented solely for informational purposes and should not be treated as giving investment advice. It is not, and is not intended to be, a prospectus, is not, and should not be
construed as, an offer to sell or the solicitation of an offer to buy any securities, and should not be used as the sole basis of any analysis or other evaluation and investors should not subscribe for or
purchase any shares or other securities in the Company on the basis of or in reliance on the information in this document.
Certain information in this presentation is based on management estimates. Such estimates have been made in good faith and represent the current beliefs of applicable members of management of
Uniper. Those management members believe that such estimates are founded on reasonable grounds. However, by their nature, estimates may not be correct or complete. Accordingly, no
representation or warranty (express or implied) is given that such estimates are correct or complete.
We advise you that some of the information presented herein is based on statements by third parties, and that no representation or warranty, express or implied, is made as to, and no reliance should be
placed on, the fairness, accuracy, completeness or correctness of this information or any other information or opinions contained herein, for any purpose whatsoever. Certain statements contained herein
may be statements of future expectations and other forward-looking statements that are based on the Company’s current views and assumptions and involve known and unknown risks and uncertainties
that may cause actual results, performance or events to differ materially from those expressed or implied in such statements. No one undertakes to publicly update or revise any such forward-looking
statement. Neither Uniper nor any of their respective officers, employees or affiliates nor any other person shall assume or accept any responsibility, obligation or liability whatsoever (in negligence or
otherwise) for any loss howsoever arising from any use of this presentation or the statements contained herein as to unverified third person statements, any statements of future expectations and other
forward-looking statements, or the fairness, accuracy, completeness or correctness of statements contained herein.
In giving this presentation, neither Uniper nor its respective agents undertake any obligation to provide the recipient with access to any additional information or to update this presentation or any
information or to correct any inaccuracies in any such information.
This presentation contains certain financial measures (including forward-looking measures) that are not calculated in accordance with IFRS and are therefore considered as "Non-IFRS financial
measures". The management of Uniper believes that the Non-IFRS financial measures used by Uniper, when considered in conjunction with (but not in lieu of) other measures that are computed in
accordance with IFRS, enhance an understanding of Uniper's results of operations, financial position or cash flows. A number of these Non-IFRS financial measures are also commonly used by securities
analysts, credit rating agencies and investors to evaluate and compare the periodic and future operating performance and value of Uniper and other companies with which Uniper competes. These Non-
IFRS financial measures should not be considered in isolation as a measure of Uniper's profitability or liquidity, and should be considered in addition to, rather than as a substitute for, net income and the
other income or cash flow data prepared in accordance with IFRS. In particular, there are material limitations associated with our use of Non-IFRS financial measures, including the limitations inherent in
our determination of each of the relevant adjustments. The Non-IFRS financial measures used by Uniper may differ from, and not be comparable to, similarly-titled measures used by other companies.
Certain numerical data, financial information and market data (including percentages) in this presentation have been rounded according to established commercial standards. As a result, the aggregate
amounts (sum totals or interim totals or differences or if numbers are put in relation) in this presentation may not correspond in all cases to the amounts contained in the underlying (unrounded) figures
appearing in the consolidated financial statements. Furthermore, in tables and charts, these rounded figures may not add up exactly to the totals contained in the respective tables and charts.

                                                                                                                                                                                                                  37
You can also read