Q2 2021 Results Investor meeting - Marel

Page created by Andre Carr
 
CONTINUE READING
Q2 2021 Results Investor meeting - Marel
Q2 2021 Results
Investor meeting

22 July 2021
Q2 2021 Results Investor meeting - Marel
Q2 2021 Results
Investor meeting

               Arni Oddur Thordarson   Linda Jonsdottir
               CEO                     CFO

22 July 2021
Q2 2021 Results Investor meeting - Marel
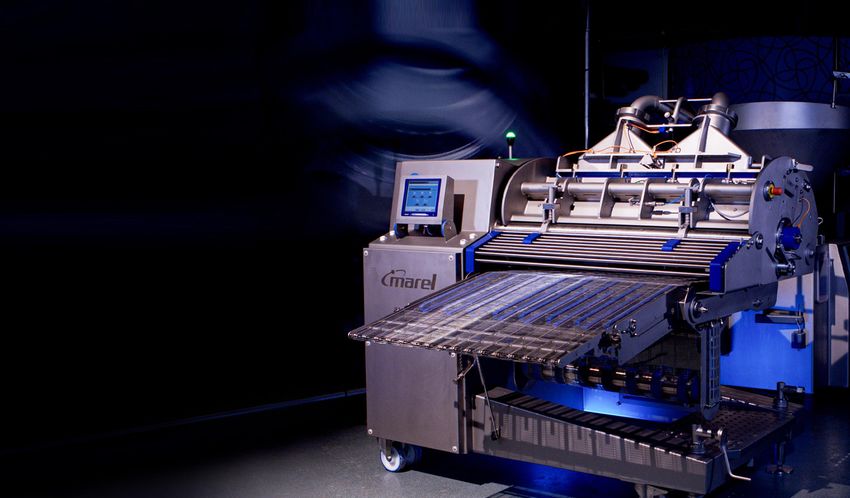
Q2 2021 FINANCIAL HIGHLIGHTS
Record orders received and cash flow, healthy order book, revenues and operational profit
stable between quarters

HIGHLIGHTS
• Record orders received of EUR             REVENUES                                                          ORDERS RECEIVED                                                    ORDER BOOK3
  371m in the quarter, and order            EUR m                                                             EUR m                                                              EUR m
  book at EUR 499m                                                 343      334       328                                                     369       371                                                               499
                                                306                                                                                  320                                             439      434                455
  (2Q20: EUR 439m)                                        287                                                                                                                                           416
                                                                                                                  280       283
• Orders for poultry were at a
  strong level, meat were in line
  with expectations and fish were
  at record levels
                                               2Q20 3Q20 4Q20 1Q21 2Q21                                          2Q20 3Q20 4Q20 1Q21 2Q21                                          2Q20 3Q20 4Q20 1Q21 2Q21
• Revenues totaled EUR 328m,
  with 40% in aftermarket
  revenues (2Q20: EUR 306m)
                                           EBIT1 MARGIN                                                      FREE CASH FLOW2                                                    LEVERAGE
• Gross profit at 36.2% in the             %                                                                 EUR m                                                              Net debt/EBITDA
  quarter (2Q20: 37.4%)                                                                                                                                54.6
                                                14.7 15.4 15.2                                                                                                                                         1.0x
                                                                                                                  47.6                        45.5
• EBIT1 margin of 11.8% in 2Q21                                             11.4 11.8                                                                                                                            0.8x     0.8x
                                                                                                                           36.6
  (2Q20: 14.7%)                                                                                                                                                                     0.6x
                                                                                                                                                                                              0.5x
• Robust cash flow generation to                                                                                                     17.7
  support continued investment
• Net result was EUR 23.3m                     2Q20 3Q20 4Q20 1Q21 2Q21                                          2Q20 3Q20 4Q20 1Q21 2Q21                                          2Q20 3Q20 4Q20 1Q21 2Q21
  (2Q20: EUR 30.7m)

                                    Note: 1 Operating income adjusted for PPA related costs, including depreciation and amortization, and beginning in Q4 2020 adjusted for acquisition related costs. 2 Free cash flow defined as   3
                                    cash generated from operating activities less taxes paid and net investments in PP&E and intangible assets. 3 Including acquired order book of Curio and PMJ of EUR 4.2m in 1Q21.
Q2 2021 Results Investor meeting - Marel
1H 2021 FINANCIAL HIGHLIGHTS
Record orders received in the first half of the year, profitability hampered by supply chain and logistics
costs, as well as step up in sales and service coverage ahead of the growth curve

HIGHLIGHTS
• Record orders received 1H21              REVENUES                                                          ORDERS RECEIVED                                                    ORDER BOOK
  at EUR 741m, compared to                 EUR m                                                             EUR m                                                              EUR m
  EUR 632 in 1H20                             1,198 1,284 1,238                                                 1,184 1,222 1,234                                                   476                               499
                                                                                                                                                                                             414        416    439
• Order book was EUR 499m, or
                                                                                                                                                       741
  38.6% of trailing twelve month                                           607       662                                                     632
  revenues and 1H21 book-to-bill
  of 1.12
• Revenues were EUR 662m in                   2018 2019 2020 1H20 1H21                                          2018 2019 2020 1H20 1H21                                           2018 2019 2020 1H20 1H21
  1H21 compared to EUR 607m
  in 1H20
• Aftermarket 40% of revenues             EBIT1 MARGIN                                                      FREE CASH FLOW2                                                    LEVERAGE
                                          %                                                                 EUR m                                                              Net debt/EBITDA
• Gross profit was 36.7% in
  1H21, compared to 36.5% in                   14.6                                                                                 141
                                                        13.5 13.5                                                                                                                  2.0x
                                                                                                                 121       115
  1H20                                                                     11.6 11.6
                                                                                                                                                       100
                                                                                                                                              86
• Strong cash flow and leverage                                                                                                                                                                         1.0x
                                                                                                                                                                                                                      0.8x
  at 0.8x net debt/EBITDA                                                                                                                                                                                      0.6x
                                                                                                                                                                                             0.4x
• Net result for 1H21 was EUR
  44.5m, compared to EUR                      2018 2019 2020 1H20 1H21                                          2018 2019 2020 1H20 1H21                                           2018 2019 2020 1H20 1H21
  44.1m in 1H20

                                   Note: 1 Operating income adjusted for PPA related costs, including depreciation and amortization, and beginning in Q4 2020 adjusted for acquisition related costs.                        4
                                   2 Free cash flow defined as cash generated from operating activities less taxes paid and net investments in PP&E and intangible assets.
Q2 2021 Results Investor meeting - Marel
RECORD ORDERS RECEIVED
As the only pure play operator of food processing solutions, software and services for the poultry,
meat and fish industries, Marel has secured record orders for two sequential quarters

• Record first half of the year with
  orders received of EUR 741m in
                                       REVENUES AND ORDER EVOLUTION
  1H21, whereby orders received
  in 2Q21 were EUR 371m                EUR m                                               Revenues        Orders received

• Pipeline is building up across all    400                                                                                                                     400
  industries and processing
  stages                                350                                                                                                                     350

• M&A fuels organic growth, and
  Marel secured orders in 2Q21          300                                                                                                                     300

  where a broader product
  portfolio following recent            250                                                                                                                     250

  acquisitions of TREIF (meat and
  other), Curio (fish) and PMJ          200                                                                                                                     200

  (poultry) was key
                                        150                                                                                                                     150
• Landmark orders in 2Q21
  include a highly innovative and       100                                                                                                                     100
  fully automated turkey
  processing plant for Prestage          50                                                                                                                     50
  Farms in the US, and the first
  full-line solution for tilapia          0                                                                                                                     0
  processing with C.Vale in Brazil,           Q1   Q2   Q3   Q4   Q1   Q2   Q3   Q4   Q1    Q2   Q3   Q4    Q1    Q2   Q3    Q4   Q1   Q2   Q3   Q4   Q1   Q2
  both focused on digitalization
                                                    2016                2017                  2018                  2019                2020           2021
  and sustainability to improve
  nutrition and product quality
                                                                                                                                                                      5
Q2 2021 Results Investor meeting - Marel
BALANCED REVENUE MIX
Global reach and focus on full-line offering across the poultry, meat and fish industries counterbalance
fluctuations in customer demand, complemented by growing aftermarket revenues

POULTRY                                                                                     MEAT                                                                          FISH

                              EUR 145m revenues 2Q21                                                                    EUR 135m revenues 2Q21                                                   EUR 38m revenues 2Q21
                              12.2% EBIT1 margin 2Q21                                                                   12.6% EBIT1 margin 2Q21                                                  6.3% EBIT1 margin 2Q21
                              14.3% EBIT1 margin 1H21                                                                   10.3% EBIT1 margin 1H21                                                  5.8% EBIT1 margin 1H21
    •   Strategic partnership between Marel and TOMRA,                                         •    Bolt-on acquisitions fueling organic growth through                    •   Agreement to acquire Valka signed as a
        combining their respective expertise in food                                                cross-and upselling, and accelerating the innovation                       subsequent event, pending anti-trust and other
        processing and cutting-edge vision technology to                                            roadmap by cascading technology across industries                          customary closing conditions. Curio acquisition
        launch a uniquely valuable solution in foreign                                                                                                                         consolidated as of 4 Jan 2021. Salmon primary
                                                                                               •    Orders received in 2Q21 for Marel Meat were good
        material detection that meets Marel’s customers                                             across all processing steps in line with continued
                                                                                                                                                                               processing offering solidified through the strategic
        challenges head on                                                                                                                                                     partnership with Stranda and 40% investment.
                                                                                                    focus on cross- and upselling a broader product
    •   Orders received for Marel Poultry in 2Q21 and                                               portfolio following recent acquisitions. Pipeline                      •   Innovation roadmap accelerated to close certain
        pipeline were strong across all processing steps,                                           remains strong                                                             application gaps to reach full-line offering
        supporting stronger volume and mix in coming                                           •    Improved profitability in the quarter due to better                    •   Orders received in 2Q21 were at a record level for
        quarters                                                                                    project execution and product mix driven by                                Marel Fish, pipeline for large projects is building up
    •   Landmark order for a fully automated turkey                                                 increased sales coverage, and solution replication in                      and conversion into orders is expected to pick up
        greenfield with Prestage Farms in the US,                                                   large orders
                                                                                                                                                                           •   Landmark order for first full-line tilapia processing
        including multiple lines and largest inline air                                        •    Management continues to target medium and long-                            plant with C.Vale in Brazil
        chilling tunnel                                                                             term EBIT1 margin expansion for Marel Meat, and
                                                                                                                                                                           •   Higher volume needed to deliver sufficient margin
    •   Lower profitability for Marel Poultry as a result of                                        management has accelerated market coverage and
                                                                                                                                                                               improvement
        soft orders for larger projects as stated in 1Q21                                           operational improvement initiatives
        and high logistics costs of projects to ensure                                                                                                                     •   Management continues to target medium and long-
        timely delivery to customers                                                                                                                                           term EBIT1 margin expansion for Marel Fish

   Full-line offering with one of the largest installed bases                                Full-line offering with focus on strong product development,                  Full-line offering to the wild whitefish industry since 2020.
   world-wide, focus on roll-out of innovative products and                                     increased standardization, modularization and market                       Strong line offering with opportunities to improve breadth
  market penetration through cross-selling of secondary and                                           penetration and further cross- and upselling                         through innovation and / or M&A to reach full line offering
                  further processing solutions                                                                                                                                              across whitefish and salmon
Note: All financial numbers relate to the Condensed Consolidated Interim Financial Statements Q2 2021. Other segment accounts for around 3% of the revenues in Q2 2021.
1 Operating income adjusted for PPA related costs, including depreciation and amortization, and beginning in Q4 2020 adjusted for acquisition related costs.
                                                                                                                                                                                                                                           6
Q2 2021 Results Investor meeting - Marel
Financial
performance
Linda Jonsdottir,
Chief Financial Officer

22 July 2021
Q2 2021 Results Investor meeting - Marel
GOOD QUALITY OF EARNINGS
Strong track record of a well diversified revenue structure across industries, geographies and
business mix

REVENUES BY INDUSTRY                                                                          REVENUES BY GEOGRAPHY                                                   REVENUES BY BUSINESS MIX
%                                                                                             %                                                                       %

                                                                                                                13%                                   15%
                                                                                                                                                                                           1/3
                                                           44%
                    53%
                                                                                                                                                                              62%                    60%

                                                                                                                54%                                   52%
                                                                                                                                                                                           1/3

                                                           41%
                    32%

                                                                                                                                                                              38%          1/3       40%
                                                                                                                33%                                   33%
                    13%                                    12%
                     2%                                     3%
                   2Q20                                   2Q21                                                 2Q20                                   2Q21                   2Q20                    2Q21

                               Poultry           Fish                                                                      Asia and Oceania                                           Equipment1
                               Meat              Other                                                                     Europe, Middle East and Africa                             Aftermarket2
                                                                                                                           Americas

Note: 1 Equipment revenues are comprised of revenues from greenfield and large projects, standard equipment and modernization equipment, and related installations.                                         8
2 Aftermarket revenues are comprised of revenues from maintenance, service, and spare parts.
Q2 2021 Results Investor meeting - Marel
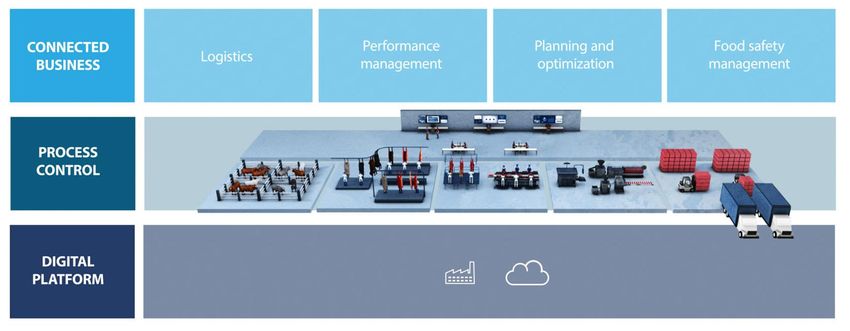
OPERATIONAL PERFORMANCE
Fluctuations in EBIT margins quarter on quarter can be expected, due to product mix and timing of large
projects, rising investment level going forward to support organic growth in line with growing pipeline

• Gross profit at 36.2% (2Q20:
  37.4%), below the mid-term                  ADJUSTED EBIT EVOLUTION1                                                            Adjusted EBIT                   % margin
  target of 40% by YE23                       EUR m
  - Higher costs in manufacturing,
    aftermarket and transportation             55                                                                                                                                                                                    24.0%
    due to logistics and delivery
                                               50
                                                                                                                                                                                                                                     21.0%
  - Margins impacted by increased
                                               45
    costs due to mobility and logistical
    challenges                                                                                                                                                                                                                       18.0%
                                               40
  - Total transformation of spare              35                                                                                                                                                                                    15.0%
    parts handling with focus on
    investments in fulfillment centers         30
    and digitizing and automating the                                                                                                                                                                                                12.0%
                                               25
    end-to-end parts handling
                                               20                                                                                                                                                                                    9.0%
• Operating costs
  - SG&A at 18.4% (2Q20: 16.8%),               15
                                                                                                                                                                                                                                     6.0%
    compared to mid-term YE23                  10
    target of 18.0%                                                                                                                                                                                                                  3.0%
                                                 5
  - R&D at 6.1% (2Q20: 5.8%),
    compared to mid-term YE23                    0                                                  2
                                                                                                                                                                                                                                     0.0%
    target of 6.0%                                    Q1 Q2 Q3 Q4 Q1 Q2 Q3 Q4 Q1 Q2 Q3 Q4 Q1 Q2 Q3 Q4 Q1 Q2 Q3 Q4 Q1 Q2 Q3 Q4 Q1 Q2 Q3 Q4 Q1 Q2

• Results not adjusted for non-                               2014                    2015                   2016                    2017                    2018                    2019                   2020              2021
  recurring costs, except for PPA
  and acquisition related costs
                                           Note: 1 Adjusted for PPA costs related to acquisitions from 2016 onwards and refocusing costs in 2014 and 2015 relating to “Simpler, Smarter, Faster” program. PPA refers to
                                           amortization of acquisition related (in)tangible assets. Beginning in Q4 2020 also adjusted for acquisition related costs. 2 Adjusted EBIT in Q4 2015 is not adjusted for EUR 3.3m cost           9
                                           related to the MPS acquisition, which was described in the Company‘s Q4 2015 report and recorded in general and administrative expenses.
Q2 2021 Results Investor meeting - Marel
ORDER BOOK AT HEALTHY LEVEL
A healthy order book of EUR 499 million, pipeline is strong across all industries
and processing stages

• At quarter-end, the order book         ORDER BOOK                                                       Order book1                    Orders received2                  Revenues
  was 39% of trailing 12-months          EUR m
  revenues
• Book-to-bill 1.13x in 2Q21,
  compared to an average of
  0.98x in the past four quarters                                                               1,222       1,284                   1,234       1,238
  (2Q20-1Q21)
• Order book consists of orders
  that have been signed and                                                                                                                                              369         334                     371         328
  financially secured
• Vast majority of the order book
                                                                                     476                                                                                                         455                                 499
  are greenfield projects while                                                                                          414                                 416
  spare parts and standard
  equipment run faster through                                                                                                                         4
                                                                                           3                                                                                                 5
  the system                                                                        2018                    2019                                2020                              Q1 2021                             Q2 2021

• Low customer concentration
                                    Order book % trailing 12
  with no customer accounting       month revenues
                                                                                    40%                     32%                                 34%                                 36%                                39%
  for >5% of the total revenues
  on an annual basis                Book-to-bill ratio                             0.99x                   0.95x                               1.00x                               1.11x                              1.13x

                                     Note: 1 The order book reflects Marel’s estimates, as of the relevant order book date, of potential future revenues to be derived from contracts for equipment, software, service and spare parts
                                     which have been financially secured through down payments and/or letters of credit in line with the relevant contract terms. These estimates reflect the estimated total nominal values of
                                     amounts due under the relevant contracts less any amounts recognized as revenues in Marel’s financial statements as of the relevant order book date.
                                     2 Orders received represents the total nominal amount, during the relevant period, of customer orders for equipment, software, service and spare parts registered by Marel. 3 Including acquired

                                     order book of MAJA of EUR 2m. 4 Including acquired order book of TREIF of EUR 5m in 4Q20. 5 Including acquired order book of Curio and PMJ of EUR 4.2m.                                               10
EARNINGS PER SHARE
Marel’s management targets Earnings per Share to grow faster than revenues

• Cash flow reinvested in          EARNINGS PER SHARE (EPS)
  innovation, infrastructure and   Trailing twelve months, euro cents
  global reach to sustain growth                                                                                                                                            +30%
  and value creation
• Basic earnings per share were                                                                                                                                               19.56 19.80
                                                                      2017-2026 growth
  EUR 3.14 cents (2Q20: 4.07                                                                                                                                         18.69
                                                                     strategy introduced                                                                     17.95
  cents) and earnings per share                                            at 2017 AGM                                                               17.17
  trailing twelve months was                                                                                                                 16.52                                                                         +19%
  EUR 13.75 cents in 2Q21                                                                                                           14.83
                                                                                                                                                                                              15.33
                                                                                                                                                                                                                                       14.70
  (2Q20: 11.57)                                                                                                             13.70                                                                                              13.62           13.75

                                                                                                                    12.05                                                                              12.32
                                                                                                   11.65                                                                                                       11.57
                                                                                                            11.18                                                                                                      11.08
                                                                                           10.59

                                                                           8.51 8.86
                                                           7.93 8.13
                                                   6.92
                                           6.19

                                   3.58

                                                                                                                                                                                     1
                                   1Q15 2Q15 3Q15 4Q15 1Q16 2Q16 3Q16 4Q16 1Q17 2Q17 3Q17 4Q17 1Q18 2Q18 3Q18 4Q18 1Q19 2Q19 3Q19 4Q19 1Q20 2Q20 3Q20 4Q20 1Q21 2Q21

                                    Note: 1 An offering of 100 million shares issued and sold in connection with the dual listing in 2Q19, increasing the total share capital to 771 million shares.                                            11
INCOME STATEMENT: Q2 2021
Revenues in Q2 2021 were EUR 328 million, gross profit was EUR 119 million or 36.2% of revenues,
and the adjusted EBIT was EUR 38.6 million or 11.8%

In EUR million                                                                                                               Q2 2021              Of revenues                           Q2 2020      Of revenues         Δ

Revenues                                                                                                                             327.5                                                  305.7                    +7.1%
Cost of sales                                                                                                                      (208.9)                                                 (191.5)                   +9.1%
Gross profit                                                                                                                          118.6                     36.2%                       114.2           37.4%    +3.9%

Selling and marketing expenses                                                                                                       (39.8)                     12.2%                       (32.8)          10.7%   +21.3%
General and administrative expenses                                                                                                  (20.2)                       6.2%                      (18.6)           6.1%    +8.6%
Research and development expenses                                                                                                    (20.0)                       6.1%                      (17.8)           5.8%   +12.4%
                                                       1
Adjusted result from operations                                                                                                        38.6                     11.8%                        45.0           14.7%    -14.2%
Non-IFRS adjustments                                                                                                                   (5.6)                                                 (2.6)                  +115.4%
Result from operations                                                                                                                 33.0                     10.1%                        42.4           13.9%    -22.2%

Net finance costs                                                                                                                      (1.9)                                                 (5.3)                   -64.2%
Share of result of associates                                                                                                          (0.4)                                                  0.1                   -500.0%

Result before income tax                                                                                                               30.7                                                  37.2                    -17.5%

Income tax                                                                                                                             (7.4)                                                 (6.5)                  +13.8%
Net result                                                                                                                             23.3                       7.1%                       30.7           10.0%    -24.1%
Note: The income statement as presented above provides an overview of the quarterly Adjusted result from operations, which management believes to be a relevant Non-IFRS measurement.
1 Operating income adjusted for PPA related costs, including depreciation and amortization, and beginning in Q4 2020 adjusted for acquisition related costs.

                                                                                                                                                                                                                        12
MID-TERM TARGETS
Marel is committed to the mid-term targets to achieve gross profit of 40%, SG&A of 18% and
maintain the innovation investment at the 6% strategic level by year-end 2023

In EUR million                                                                                                              Q2 2021              Of revenues                             Q1 2019                    Of revenues
                                                                                                                                                                                                                          Mid-term target   Change

Revenues                                                                                                                             327.5                                                       324.6                                       - 7.1%
Cost of sales                                                                                                                     (208.9)                                                   (199.2)                                          - 2.5%
Gross profit                                                                                                                         118.6                       36.2%                           Gross profit
                                                                                                                                                                                                 125.4                      38.6% ~40%      - 14.4%

Selling and marketing expenses                                                                                                      (39.8)                       12.2%                         (20.6)                        6.3%            -15.0%
                                                                                                                                                                                18.4%           SG&A                                ~18%
General and administrative expenses                                                                                                 (20.2)                         6.2%                        (37.3)                       11.5%            +8.6%
Research and development expenses                                                                                                   (20.0)                         6.1%                         R&D
                                                                                                                                                                                               (20.0)                        6.2%    ~6%    + 19.5%
                                                      1
Adjusted result from operations                                                                                                        38.6                      11.8%                                       47.5           14.6%           - 46.5%
Non-IFRS adjustments                                                                                                                  (5.6)                                                              (2.6)
                                                                                                                                                                                                                37.4     ~~
                                                                                                                                                                                                                          36.2      40.0
                                                                                                                                                                                                                                              0.0%

                                                                                                                                                                                           PROFIT %
                                                                                                                                                                                           GROSS
Result from operations                                                                                                                 33.0                      10.1%                                       44.9           13.8%           - 49.2%

Net finance costs                                                                                                                     (1.9)                                                              (3.8)16.8        18.4      18.0    + 31.6%

                                                                                                                                                                                               SG&A %
Share of result of associates                                                                                                         (0.4)                                                                     -                                 -

Result before income tax                                                                                                               30.7                                                                  41.1                           - 56.7%

                                                                                                                                                                                               ADJ. EBIT %
                                                                                                                                                                                                                14.7                16.0
                                                                                                                                                                                                                          11.8
Income tax                                                                                                                            (7.4)                                                              (8.9)                              - 50.6%
Net result                                                                                                                             23.3                        7.1%                                      32.2            9.9%           - 58.4%
 Note: The income statement as presented above provides an overview of the quarterly Adjusted result from operations, which management believes to be a relevant Non-IFRS measurement.                          2Q20      2Q21      2023
 1 Operating income adjusted for PPA related costs, including depreciation and amortization, and beginning in Q4 2020 adjusted for acquisition related costs.

                                                                                                                                                                                                                                                 13
BALANCE SHEET: ASSETS
Q2 2021 Condensed Consolidated Interim Financial Statements

• Since the beginning of the       ASSETS
  pandemic Marel has               In EUR million                      30/06 2021    31/12 2020       Δ
  systematically built up safety
  stock of spare and production    Property, plant and equipment             205.2        196.7    +4.3%
  parts to serve customer          Right of use assets                        46.8         42.7    +9.6%
  demand and ensure timely         Goodwill                                  683.1        678.8    +0.6%
  delivery                         Intangible assets                         342.5        331.0    +3.5%
• Ramping up inventories of        Investments in associates                  11.3         17.6   -35.8%
  EUR 19.2m in 2Q21                Other receivables                           1.0          2.1   -52.4%
                                   Deferred income tax assets                 13.8         13.3    +3.8%
• Strong cash conversion           Non-current assets                      1,303.7      1,282.2   + 1.7%
  supports continued
  investments in innovation,
  infrastructure and strategic     Inventories                               225.5        199.9   +12.8%
  inventory buildup                Contract assets                            41.5         46.1   -10.0%
                                   Trade receivables                         160.2        151.3    +5.9%
• Trade receivables portfolio      Assets held for sale                        0.8          1.8   -55.6%
  healthy, no change in payment
                                   Derivative financial instruments            3.3          1.9   +73.7%
  behavior from our customers
                                   Other receivables and prepayments          52.4         53.1    -1.3%
                                   Cash and cash equivalents                  85.6         78.6    +8.9%
                                   Current assets                            569.3        532.7    +6.9%

                                   TOTAL ASSETS                            1,873.0      1,814.9   +3.2%

                                                                                                           14
BALANCE SHEET: EQUITY AND LIABILITIES
Q2 2021 Condensed Consolidated Interim Financial Statements

• Favorable development in             EQUITY AND LIABILITIES
  working capital, reflecting the     In EUR million                     30/06 2021    31/12 2020          Δ
  strong orders received as
  down payments are received          Group Equity                             960.5        958.7       0.2%
  for new projects
                                      Borrowings                               220.3        240.2       -8.3%
• Marel has committed liquidity
                                      Lease liabilities                         37.8         33.6      +12.5%
  of EUR 672.3m at the end of
                                      Deferred income tax liabilities           85.7         84.9       +0.9%
  June, including fully committed
                                      Provisions                                 5.0          4.1      +22.0%
  all-senior funding in place until
                                      Other payables                            17.8          1.1   +1,518.2%
  2025
                                      Derivative financial instruments           2.5          3.7      -32.4%
• Leverage ratio at 0.8x, well        Non-current liabilities                  369.1        367.6       +0.4%
  below the targeted capital
  structure of 2-3x net debt /        Contract liabilities                     279.8        236.6     +18.3%
  EBITDA                              Trade and other payables                 231.7        222.7      +4.0%
                                      Current income tax liabilities            15.0          8.8     +70.5%
• Financial strength to support
                                      Borrowings                                 0.0          0.0           -
  strategic actions in the ongoing
                                      Lease liabilities                          9.8         10.0      -2.0%
  industry consolidation wave, in
                                      Provisions                                 7.1         10.5     -32.4%
  line with the company’s 2017-
  2026 growth strategy                Current liabilities                      543.4        488.6     +11.2%

                                      Total liabilities                        912.5        856.2      +6.6%

                                      Total equity and liabilities           1,873.0      1,814.9      +3.2%
                                                                                                                15
STRONG CASH FLOW
Record operational cash flow in the quarter of EUR 78 million and free cash flow amounted
to EUR 55 million

• Cash flow, both operational and         CASH FLOW
  free cash flow was very strong          EUR m
  in the quarter, supporting                                                         Cash
  operational and strategic                                                        generated
  flexibility                                                           Changes in    from
                                                                         working   operating
• Marel continues to invest in its                                        capital   activities
  business and improving the                                                                                                                                                       Sale of
                                                                           +27.1           77.9                                                                                   treasury
  ways of working                                                                                                                   Free cash                                   shares and
                                                          Non cash                                                                    flow1                                        options
• Strong cash conversion, backed                           items
                                                                                                         Taxes                                                                   exercised
  by book-to-bill of 1.13, operating                                                                                                   54.6
                                                             +17.8                                        paid
  cash flow of EUR 77.9m                      EBIT                                                                                                                                  0.4
                                                                                                                     Investing                    Net interest
  compared to EBITDA of 49.8m                                                                             -8.6       activities
                                              33.0                                                                                                   paid      Acquisition
• The 2021 AGM approved a                                                                                                                                           of
                                                                                                                       -14.7                          -2.0     subsidiary,                                                 Decrease in
  dividend of EUR 41.0 million
                                                                                                                                                               net of cash                                                  net debt
  (EUR 5.45 cents per share) for                                                                                                                                acquired
  the operational year 2020, was                                                                                                                                                                                                2.7
  fully paid in 2Q21                                                                                                                                                -6.0                       Dividends
                                                                                                                                                                                                                 Other
                                                                                                                                                                                                  paid
• A EUR 6.0m partial working                                                                                                                                                                                    items2
  capital settlement for the TREIF                                                                                                                                                               -41.0
                                                                                                                                                                                                                 -3.3
  acquisition was also paid out
  during the quarter

                                       Note: 1 Free cash flow defined as cash generated from operating activities less taxes paid and net investments in PP&E and intangible assets. 2 Currency effect, change in capitalized finance
                                       charges, and movement in lease liabilities.                                                                                                                                                       16
KEY PERFORMANCE METRICS
Proven track record of earnings results and value creation

           EARNINGS PER SHARE1                                                                                FREE CASH FLOW2                                                                        NET DEBT / EBITDA
           EUR per share                                                                                      EUR m                                                                                  Leverage (x)
                                                                                                                                              141
           18.0
                                                                                                              121                                                                                        2.0x
                            15.3                                                                                              115
                                             13.6                                  13.8
                                                                  11.6

                                                                                                                                                                                55                                             1.0x
                                                                                                                                                               48                                                                                      0.8x
                                                                                                                                                                                                                                           0.6x
                                                                                                                                                                                                                    0.4x

           2018             2019            2020                  2020            2021                        2018           2019            2020             2020            2021                       2018      2019        2020        2020        2021
                                                                           Q2                                                                                          Q2                                                                         Q2

       EPS expected to grow faster than revenues                                                          Robust cash flow                                                                           Capacity for further growth
       •    In the period 2017-2026, Marel’s management                                                   •    Strong free cash flow at EUR 54.6m in the                                             •    Net debt / EBITDA 0.8x at end of Q2 2021
            expects basic earnings per share to grow faster                                                    quarter (2Q20: EUR 47.6m)
            than revenues                                                                                                                                                                            •    Leverage well below the targeted capital
                                                                                                          •    Marel continues to invest in the business to                                               structure of 2-3x net debt / EBITDA
       •    Focus on margin expansion in Marel Meat and                                                        prepare for future growth with the objective to
            Marel Fish and overall operational                                                                 achieve its full potential                                                            •    Financial strength will facilitate future strategic
            improvement and value creation                                                                                                                                                                moves in line with the company’s growth
                                                                                                          •    Ramping up inventories of EUR 19.2m in 2Q21                                                strategy
                                                                                                          •    Dividend of EUR 41.0m, equivalent to 40% of
                                                                                                               net results for the year 2020
 Note: 1 Basic earnings per share, trailing twelve months.   2   Free cash flow defined as cash generated from operating activities less taxes paid and net investments in PP&E and intangible assets.                                                          17
Business
and outlook
Arni Oddur Thordarson,
Chief Executive Officer

22 July 2021
TRENDS DRIVING TRANSFORMATIVE SOLUTION DEVELOPMENT
Digitalization, sustainability, automation and line solutions are overarching themes in our innovation, whereby
standard and modular solutions are key enablers facilitating manufacturing, installation and aftermarket

         STANDARD AND MODULARIZED

                        Digitalization                                                                                 Automation
                         •   Our digital platform continues to be the food                                                   •   Need for greater automation and
                             processing industry’s first choice for bridging                                                     digitalization in food processing is
                             software and hardware                                                                               accelerating
                         •   Our digital solutions give customers the                                                        •   Marel has an automated replacement for
                             automated processes and actionable insights                                                         nearly every manual operation in a
                             they need                                                                                           processing plant, leading to improved return
                         •   We enable customers to shift from supply-                                                           on investment (RoI), as well as increased
                             driven to demand-driven production, with the                                                        consistency and yield
                             inherent positive impact on sustainability                                                      •   Agility and channel flexibility are key

                        Sustainability                                                                               Line solutions

                         •   By continuously focusing on creating new          Multiple lines with end-to-end Marel state-
                             methods to improve yields and minimize            of-the-art technology and digital solutions
                                                                               to ensure better product quality, safety,
                             waste, Marel is reducing the use of scarce
                                                                               traceability and efficiency of operations.
                             resources such as energy and water while
                             promoting food safety, traceability, and animal
                             wellbeing
                         •   Every new product developed is measured on
                             a sustainability scorecard since 2017
                         •   New technologies such as VR/XR to design,
                             test, and adjust innovations sustainably

                                                                                                                     6% INNOVATION PROMISE
                                                                                                                                                                                19
MAREL’S DIGITAL JOURNEY IS IN FULL MOTION
Marel aims to provide a platform for interconnectivity and optimization for fish, meat and poultry
processers to maximize value creation in a sustainable way

                  DIGITAL VISION                                               KEY COMPONENTS IN THE DIGITAL JOURNEY
                                                         • Digital Platform provides the infrastructure enabling digital products that drive optimized
     “To be the digital partner of choice for the food     value creation
      processing industry, and enable customers to       • Process Control allows customers to seamlessly configure and operate multiple devices as a
  sustainably maximize value creation by providing the     single automated ‘system’
     platform for interconnectivity and optimization”    • Connected Business offers digital solutions that optimize logistics, performance management,
                                                           planning and optimization and food safety management to drive value creation

      Efficiency
   Labour  Efficiency          Throughput                 Yield
                                                          Yield                    Quality                  Capacity
                                                                                                            Capacity                   Uptime

                                                                                                                                                      20
Partnership of
Pioneers
In 2019, Marel formed a strategic partnership with TOMRA, a leader
in vision technology, to jointly transform the way food is processed.

Marel and TOMRA have combined their respective expertise in food
processing and cutting-edge vision technology to launch a uniquely
valuable solution in foreign material detection that meets Marel´s
customers challenges head on for safe, high quality products that
are processed in a sustainable way.
AIR CHILLING MAKES FOR A UNIQUE GREENFIELD
Landmark order from Prestage Farms in the US is the largest turkey order to date, and as Marel’s
third big greenfield project in a short time illustrates the end-to-end integration trend in the US market

END-TO-END TURKEY SOLUTIONS BY MAREL                                       SHARED AMBITION FOR SUSTAINABILITY AND FOOD QUALITY
•   The new Prestage Farms processing plant will feature an                 •   Air chilling will lead to a massive reduction of water use,
    end-to-end Marel setup with multiple lines, from de-feathering              compared to water chilling and enable automation in other
    to deboning and inspection, with a total capacity of 6,000                  processing steps
    birds per hour
                                                                            •   The complete automation of the evisceration department will
•   This largest inline air chilling tunnel for turkeys in the US really        also result in a decrease in water consumption in comparison
    differentiates the plant from a sustainability perspective and              with a manual process
    quality of the product
                                                                            •   All systems are set to get the right product at the right moment,
•   Marel’s in-depth knowledge of turkey air chilling brings more               optimizing the use of raw material and reducing environmental
    influence on appearance, tenderness, quality, yield,                        footprint, and creating the ability to produce on a continuous
    throughput and end-to-end connected product data                            basis throughout the day according to forecasted demand
•   Highest attention to food safety is also supported by multiple
    SensorX X-ray solutions to detect bones and foreign material
    in turkey fillets
•   The digital layer in the Prestage Farms plant, ensures track
    and trace functionality covering the entire plant
•   The new facility will be located in Camden, South Carolina,
    and is expected to open by end of 2022
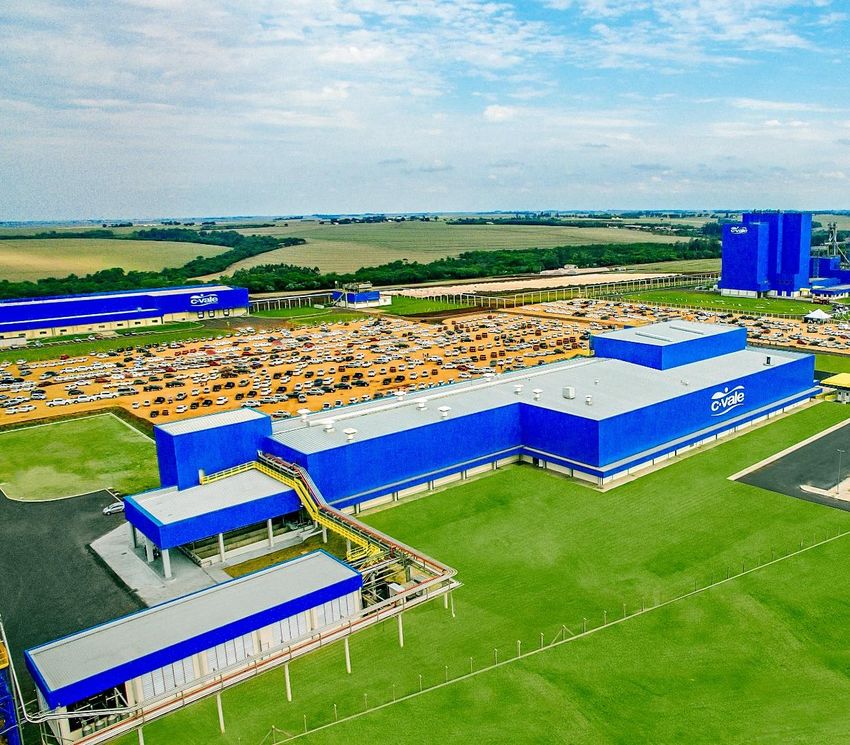
                                                                                                                                                    22
FIRST FULL-LINE TILAPIA SOLUTION WITH C.VALE
C.Vale, a large player in the food industry and one of the largest processors of tilapia in Brazil is
together with Marel transforming the way tilapia is processed

                     “Our cooperation with Marel enhances our
                     commitment to sustainability where we put
                     focus on optimal use of natural resources,”
                     says Alfredo Lang, CEO of C.Vale

AUTOMATION AND RESPONSIBLE USE OF NATURAL RESOURCES
•   The two companies share similar values and commitment to
    sustainability, animal well-being and food safety, which tightens
    their partnership as they collaborate to transform the industry
•   Software enables tracking of the raw material from receiving to
    packing with the aim to improve quality in the entire value chain
•   Automation of the filleting of tilapia with focus on quality of
    byproducts such as belly-meat recovery
•   Optimal use of raw material, less water usage, less CO2 emissions
    and data collection to measure progress
•   Increased flexibility to handle both fresh and frozen products

                                                                                                        23
FINANCIAL TARGETS AND DIVIDEND POLICY
Marel is targeting 12% average annual revenue growth from 2017-2026 through market
penetration and innovation, complemented by strategic partnerships and acquisitions

MID-TERM TARGETS BY YE23                                                2017-2026 TARGETS                                                                                      FY17              FY18             FY19               FY20                   1H21

                                                                                                                                                          Organic               4.9%             12.5%             5.4%              -5.4%

                                                                                                                                                          Acquired              2.2%              2.9%             1.8%               1.8%

                                                                                                                                                          Total                 7.1%             15.4%             7.2%              -3.6%                 8.9% YoY
                                                                       Revenue
                                                                                                                            12%
Gross profit                                   40%                     growth1

                                                                                                                                                           CAGR 2017-2Q21                                   6.6%

                                                                        Innovation
                                                                                                                   ~6% of revenues                                              5.6%              6.2%             6.4%               5.6%                  6.2%
                                                                        investment
Innovation
                                                 6%
investment                                                              Earnings per                             EPS to grow faster
                                                                                                                                                                                13.7              18.0             15.3               13.6                   13.8
                                                                        share (TTM)                                than revenues
SG&A                                            18%                                                               Net debt / EBITDA
                                                                        Leverage                                                                                                1.9x              2.0x             0.4x               1.0x                   0.8x
                                                                                                                        2-3x

Adj.EBIT                                        16%
                                                                        Dividend policy                         20-40% of net result                                            30%               30%              40%                40%                     -

Note: 1 Growth is not expected to be linear but based on opportunities and economic fluctuations. Operational results may vary from quarter to quarter due to general economic developments, fluctuations in orders received and timing of deliveries of              24
larger systems.
FINANCIAL TARGETS AND DIVIDEND POLICY
Marel is targeting 12% average annual revenue growth from 2017-2026 through market
penetration and innovation, complemented by strategic partnerships and acquisitions

MID-TERM TARGETS BY YE23                                               2017-2026 TARGETS

                                                                                                                                                     Market conditions have been challenging due to geopolitical uncertainty and the ongoing
                                                                                                                                                     COVID-19 pandemic. Marel enjoys a balanced exposure to global economies and local
                                                                                                                                                     markets through its global reach, innovative product portfolio and diversified business mix.
                                                                                                                                                     At the moment it is not known what the full economic impact of COVID-19 will have on
                                                                                                                                                     Marel. Marel is committed to achieve its mid- and long term growth targets.
                                                                                                                                                     In the period 2017-2026, Marel is targeting 12% average annual revenue growth through
                                                                      Revenue                                                                        market penetration and innovation, complemented by strategic partnerships and
                                                                                                                        12%
Gross profit                                   40%                    growth1                                                                        acquisitions.
                                                                                                                                                     Marel’s management expects average annual market growth of 4-6% in the long term.
                                                                                                                                                     Marel aims to grow organically faster than the market, driven by innovation and growing
                                                                                                                                                     market penetration.
                                                                                                                                                     Solid operational performance and strong cash flow is expected to support 5-7%
                                                                                                                                                     revenue growth on average by acquisitions.

                                                                       Innovation                                                                    To support new product development and ensure continued competitiveness of existing
                                                                                                               ~6% of revenues
                                                                       investment                                                                    product offering.
Innovation
                                                 6%
investment                                                             Earnings per                      EPS to grow faster than                     Marel’s management targets Earnings per Share to grow faster than revenues.
                                                                       share                                    revenues
SG&A                                            18%                                                           Net debt / EBITDA
                                                                       Leverage                                                                      The leverage ratio is targeted to be in line with the targeted capital structure of the company.
                                                                                                                    2-3x

Adj.EBIT                                        16%                                                                                                  Dividend or share buyback targeted at 20-40% of net result. Excess capital used to
                                                                       Dividend
                                                                                                            20-40% of net result                     stimulate growth and value creation, as well as payment of dividends / funding share
                                                                       policy                                                                        buybacks.
Note: 1 Growth is not expected to be linear but based on opportunities and economic fluctuations. Operational results may vary from quarter to quarter due to general economic developments, fluctuations in orders received and timing of deliveries of   25
larger systems.
CMD 360°
NOVEMBER 2021
Q&A
Arni Oddur Thordarson
Chief Executive Officer

Linda Jonsdottir
Chief Financial Officer

22 July 2021
QUESTIONS?
WE’RE HERE TO HELP

Tinna Molphy
Director of Investor Relations

Marino Thor Jakobsson
Investor Relations

Drofn Farestveit
Investor Relations

        +354 563 8001

        ir@marel.com

        @Marel_IR / $MAREL
DISCLAIMER

FORWARD-LOOKING STATEMENTS                                                          MARKET SHARE DATA

Statements in this press release that are not based on historical facts are         Statements regarding market share, including those regarding Marel’s
forward-looking statements. Although such statements are based on                   competitive position, are based on outside sources such as research institutes,
management’s current estimates and expectations, forward-looking statements         industry and dealer panels in combination with management estimates.
are inherently uncertain.
                                                                                    Where information is not yet available to Marel, those statements may also be
We therefore caution the reader that there are a variety of factors that could      based on estimates and projections prepared by outside sources or
cause business conditions and results to differ materially from what is             management. Rankings are based on sales unless otherwise stated.
contained in our forward-looking statements, and that we do not undertake to
update any forward-looking statements.

All forward-looking statements are qualified in their entirety by this cautionary
statement.

                                                                                                                                                                      29
Thank you
You can also read