Investor Presentation - 1H-2021 Results 27 August 2021
←
→
Page content transcription
If your browser does not render page correctly, please read the page content below
Investor Presentation
1H-2021 Results
27 August 2021
Disclaimer

This document was prepared by Rönesans Gayrimenkul Yatırım (“RGY” or “the Company”) solely for use of presenting the financial and operational results for the first
half of 2021, published on August 27, 2021. This document is not to be reproduced or distributed, in whole or in part, by any person other than the Company. The
Company takes no responsibility for the use of these materials by any person.

The information contained in this document has not been subject to independent verification and no representation, warranty or undertaking, express or implied, is
made as to, and no reliance may be placed on, the fairness, accuracy, completeness or correctness of the information or opinions contained herein.

Neither the Company nor its shareholders, its advisors, its representatives or any other person shall be held liable for any loss arising from any use of this document or
its contents or otherwise arising in connection with this document. In the event of any discrepancies between the information contained in this document and the public
documents, the latter shall prevail.

This document does not constitute an offer to sell or an invitation or solicitation of an offer to subscribe for or purchase any securities, and this shall not form the basis
for or be used for any such offer or invitation or other contract or engagement in any jurisdiction.

All the figures illustrated in this document are derived from the IFRS accounts, but adjusted to reflect proportionate figures for the assets fully
consolidated and the ownership at share of the assets accounted for using the equity method, unless stated otherwise.

                                                                                                                                                                                 2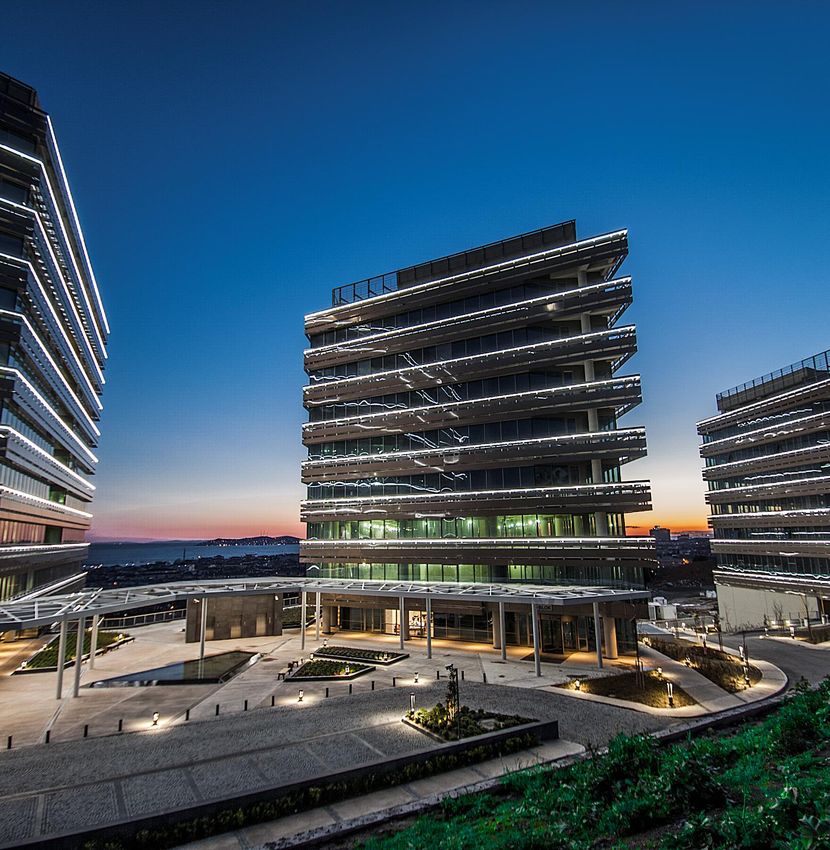
Table of Contents

A. Highlights

B. Operations

C. Financing

Appendix

                          Samsun Piazza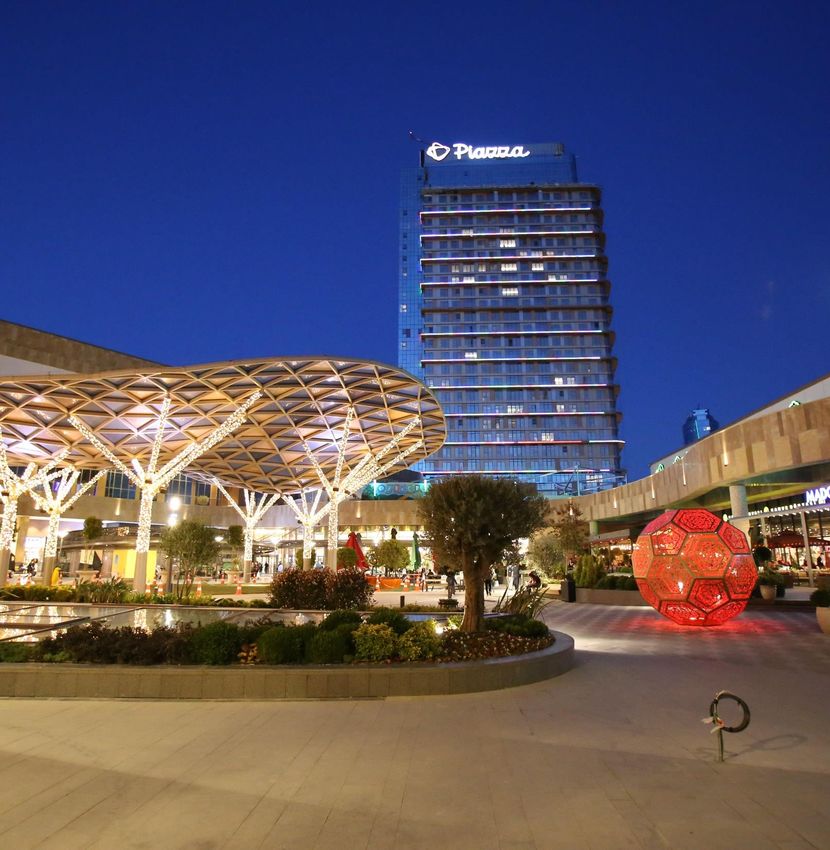
Financial Highlights                   1H21 Financial Year Results

       Limited working hours due to curfews in the first half reflected on the operational performance

                 Net Operating Income (m EUR)                                                            GAV (m EUR)
                                                                                        2,445       2,393
  105.9                                       LfL Decrease ~
                                                                                                                  1,952    1,815
                                    77.1           5.8%
                   66.8
                                            33.8         30.8
   94.3%          95.9%             95.6%   96.2%        95.6%

   2019            2020             2021F   1H20         1H21                          Dec-18       Dec-19        Dec-20   Jun-21

* Period-average Retail Occupancy

                                                                        1H21
                                                                        2020

                          EBITDA (m EUR)                                                             EPRA NAV (m EUR)
                                                                                        1,374       1,267
  102.4                                                                                                            928
                                    75.2                                                                                    828
                   63.9
                                            32.9         29.7

   2019            2020             2021F   1H20         1H21                          Dec-18       Dec-19        Dec-20   Jun-21

                                                                                                                                    4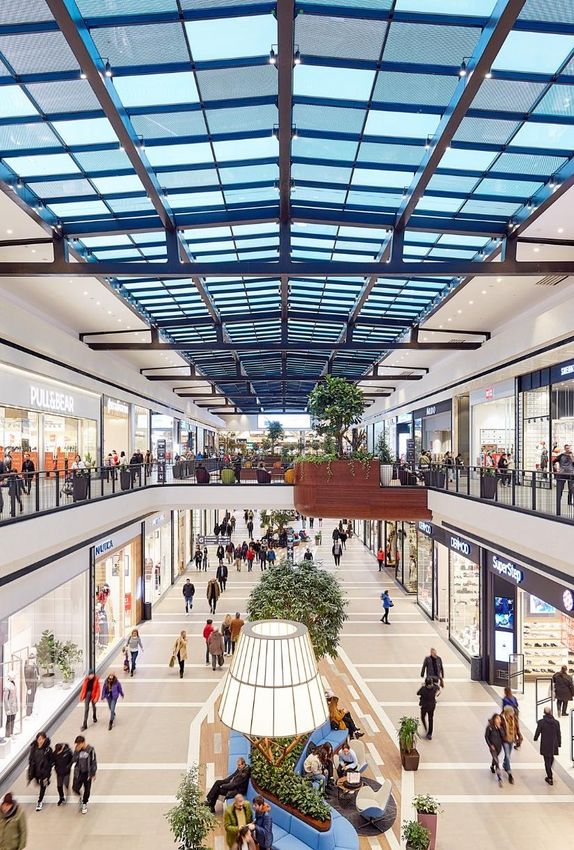
Business Highlights                            Recovery Expectations after Reopening

           Substantial recovery observed in the consumer activity after restrictions lifted in July, signalling a strong bounce for 2H21

     Shopping centers operating at full capacity July                                                                              Footfall (Base=100)              Shopping centers operate
     onwards after being allowed to be open for only                                                                                                                    at full capacity
                                                                                                                     100
     59% of the hourly capacity (1) due to curfews in                                                                                                                           94

     1H21                                                                                                                                     68

     All portfolio-wide concessions granted due to
     limited working hours cancelled starting from July

     Footfall figures restored to 94% of July 2019
                                                                                                                   Jul-19                    Jul-20                          Jul-21
     Tenant sales above even pre-pandemic levels with
     78% growth over July 2019                                                                                                   Tenant Sales (Base=100)
                                                                                                                                                                          178
     Unaudited monthly NOI figure of EUR 7.9m in July
     (Annualized: EUR 94.8m)                                                                                                                                                         133
                                                                                                                                        106        112
                                                                                                               100         100
     A July-like August and reopening of schools in
     September underway

                                                                                                                   Jul-19                    Jul-20                          Jul-21

                                                                                                                                    Tenant Sales      Turkish CPI

(1) Capacity utilization rate = Hours per day that the shopping centers were allowed to open due to curfews / 12 Hours per Day
                                                                                                                                                                                               5
Business Highlights          1H21 First Half Results

           Divestments and refinancing deals supporting the financial risk reduction strategy

Investments & Divestments                                                 Financing & Liquidity & Hedge Position
     Healthy progress in non-core property disposal plan with 3               Relieve of repayment schedule for 2021-2022 with refinance
     new transactions                                                         of EUR 140m (1) and rescheduling of EUR 61m, leaving
                                                                              only a single balloon payment (Optimum İzmir(2)-Oct’22)
             Bayraklı Land for TL 396.3m (USD 50m) in Mar-21                  in the agenda until the redemption of Eurobond in Apr’23
             with 16% premium above the latest TL valuation.
             (USD 40m of the proceeds to be received in December
             2021)                                                            EUR 50m cash in hand (Post-Konak sale in July: EUR 71m),
                                                                              to be supported by the remaining collection of EUR 43m
             Bursa Land for TL 165.4m (USD 19m) in Jun-21 with                in the second half from Bayraklı and Bursa sales
             27% premium above the latest TL valuation. (USD
             16m of the proceeds to be received between July-
                                                                              Enhancement of the liquidity with bonds with a nominal
             November 2021)
                                                                              value of USD 32m. (August: USD 34m)
             Konak Land for TL 217.5m (USD 25.3m) in Jul-21
             with 0.4% premium above the latest TL valuation.
                                                                              35% of total loan hedged against currency risk & 20% of
                                                                              the loan portfolio in the local currency

                                                                              Successful execution of consent solicitation process to
                                                                              amend Eurobond covenants with 94% attendance and
                                                                              99% support

(1) Both closed and term sheet signed
(2) JV with GIC
                                                                                                                                           6
Business Highlights                            1H21 First Half Results

           Curfews and restrictions in the first half of the year constrained the consumer activity

Operations                                                                                                        Income & Valuations
     Shopping centers allowed to be open for only 59% of the                                                            Portfolio-wide concessions provided to the tenants due to
     hourly capacity (1) (1H20: 59%)                                                                                    limited working hours in 1H21 to be cancelled starting from
                                                                                                                        July as long as there will not be any government imposed
                                                                                                                        restrictions
     Limited working hours leading to the decline of footfall
     figures by 58% and a real decrease of the tenant sales by
     33% over the base period                                                                                           Generating a net operating income of EUR 31m in 1H21
                                                                                                                        with 5.8% LfL decrease over previous year, given the
                                                                                                                        limited operating capacity and the currency depreciation
     High retail occupancy which has historically been one of the
     core strengths of RGY sustained at 95.6%
                                                                                                                        Same-property valuation decline by 5.2% in Euro terms
                                                                                                                        compared to 2020 year-end
     Net bad debt ratio at 1.0%, slightly below the historical
     averages

(1) Capacity utilization rate = Hours per day that the shopping centers were allowed to open due to curfews / 12 Hours per Day
                                                                                                                                                                                      7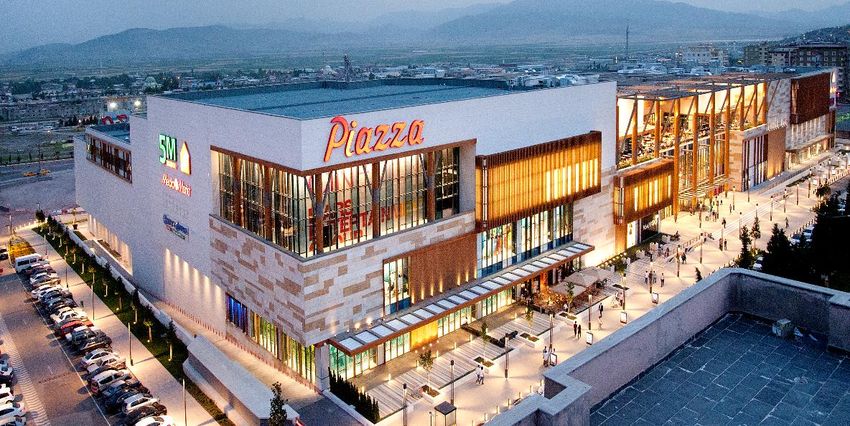
Table of Contents

A. Highlights

B. Operations

C. Financing

Appendix

                          Optimum İzmir
Covid-19 Pandemic                    Pandemic in Turkey

               Third wave of the pandemic and the government imposed curfews were effective from December to June

                                                                                     Closure of shopping
                                       The Ministry of Internal Affairs
                                                                                     centers for 73 days
                                       warned citizens not to leave their
                                       houses unless absolutely necessary
                                       and announced several precautions,
                                       including a temporary suspension on
                                       the activities of entertainment venues
                                       and common areas such as                                                             Shopping centers reopened after 73-
                                       performance centres, concert venues,                                                 days lockdown except entertainment
         11 March 2020                 cinemas, cafes, playgrounds, and                20 March 2020                        areas including cinemas and
                                       sports centres.                                                                      playgrounds.
The first COVID-19 case was detected                                            Upon several retailers closing their
in Turkey.                                                                      stores and the advice of Council of
                                               16 March 2020                    Shopping Centers-Turkey, RGY
                                                                                                                                     1 June 2020
                                                                                voluntarily shut its shopping centers
                                                                                except supermarkets and pharmacies.

                                                                                                                            Government announced new
                                            Closure of shopping                                                             measures including a weekday curfew              1 July 2020
                                                                                                                            between 9.00 pm and 5.00 am and a
                                            centers for 16 days
                                                                                                                            weekend curfew. Restaurants/cafes      Entertainment areas reopened.
                                        Full curfew for 16 days is announced                                                are allowed to open for takeaway and
                                        by the Government after increasing                                                  delivery services only, the visitor
                                        number of cases. Shopping centers                                                   capacity at shopping centres is
                                        remained closed in this period.
            1 July 2021                 Weekend curfews are maintained
                                                                                         1 March 2021                       limited, and gatherings at home are
                                                                                                                            prohibited. It is unclear when these
                                        after 16 days.                                                                      measures will be lifted.
All restrictions are lifted.                                                    Gradual normalization from
                                                                                Coronavirus restrictions started.
                                                 1 May 2021                     Weekend curfews were fully or                    30 November 2020
                                                                                partially lifted for the cities depending
                                                                                on their infection risk.

                                                                                                                                                                                                   9
Covid-19 Pandemic           Number of Daily Cases & Vaccine Rollout

           Vaccine rollout has accelarated since the beginning of June with daily doses reaching up to 1.5 million people

                                                            New Cases & Vaccine Rollout in Turkey
                                                                   as of 22 August 2021
                                                                                                                                            42% of the population
70000                                                                                                                                                               60
                                                                                                                                              fully vaccinated

60000
                                                                                                                                                                    50

50000
                                                                                                                                                                    40

40000

                                                                                                                                                                    30

30000

                                                                                                                                                                    20
20000

                                                                                                                                                                    10
10000

    0                                                                                                                                                               0

                                    Number of Daily Cases     People Vaccinated % - Right Axis   People Fully Vaccinated (%) - Right Axis

(1) Source: Our World in Data
                                                                                                                                                                         10
Shopping Centers Footfall & Tenant Sales
Significant bounce in footfall and tenant sales in July after the first half in the shadow of restrictions
Being allowed to be operational for 59% of the hourly capacity due to Increasing cases and curfews negatively impacted the trading with a real
government imposed restrictions, shopping centers were able to recover only decline of 33% in 1H21. After loosening of the restrictions, consumer activity
42% of the footfall figures in previous year in the same period. With curfew surged with the deferred demand where the real increase in tenant sales
lifted, recovery rate reached to 94% in July 2021. reached 45.3% in July.
Hourly Capacity Utilization Rate vs. Footfall Recovery (1) (2) (3) (4) Growth in Same-Shopping CenterTenant Sales (1) (2)
Year-over-year Monthly Year-over-year Monthly
78.2%
100% 100% 100% 100% 100%
94%
79% 94%
76% 29.9% 29.9% 29.8% 32.3%
15.6%
62% 11.8% 11.8% 11.9% 14.0% 14.6% 15.0% 11.9%
23.5% 32.9%
60%
68% 68% 54% 54%
62%
60% -17.2%
57% 57% 4.4%
54%
-7.8% -29.1%
30% -14.1% -12.5%
-38.7%
38%
35%
30% 31%
27%
-40.2% -41.8%
Aug Sep Oct Nov Dec Jan Feb Mar Apr May Jun Jul
Jul-20 Aug-20 Sep-20 Oct-20 Nov-20 Dec-20 Jan-21 Feb-21 Mar-21 Apr-21 May-21 Jun-21 Jul-21 2021
Capacity Utilization Footfall Recovery Change in Tenant Sales Annual Inflation
(1) Only the shopping centers that are operational at both T and T-12 were taken into account for each individual month.
(2) Data collected for Mar-Jul 2021 is compared to the same period in 2019 to avoid misleading base effect as the shopping centers were fully or partially closed in 2020.
(3) Capacity utilization rate = Hours per day that the shopping centers were allowed to open due to curfews / 12 Hours per Day
11
(4) Footfall Recovery = Footfall in current period / Footfall in previous periodShopping Centers Occupancy
High retail occupancy sustained for long years has been preserved despite the challenging marketing conditions
Average occupancy of shopping centers in the first half of 2021 was 95.6%, in
All shopping centers have an occupancy above 90%, except Optimum İstanbul
line with the long-term trend. Rent-free periods and temporary discounts
whose re-tenanting operation has been recently initiated.
provided to the tenants helped occupancy to be stable.
Retail Occupancy Occupancy by Shopping Centers
Period-Average June 2021
99.6%
99.3%
99.3%
100.0%
99.1%
850
97.7%
97.7%
97.2%
97.2%
97.1%
96.8%
95.0%
96.6%
96.9%
96.3%
96.1%
95.9%
95.9%
95.9%
95.8%
95.4% 95.4% 95.6%
95.6%
95.4%
95.3%
94.3%
95.0%
750
94.3%
90.0%
92.8%
91.9%
85.0% 650
90.9%
90.8%
89.9%
80.0%
550
88.2%
75.0%
640 640 450
70.0% 594
530
350
65.0% 398
374 374
60.0% 250
Karşıyaka Samsun Optimum Optimum K. Maraş Maltepe Optimum Küçükyalı Ş. Urfa Optimum Kozzy Maltepe Portfolio
2015 2016 2017 2018 2019 2020 Jun-21 Hilltown Piazza Izmir Ankara Piazza Piazza Adana Hilltown Piazza Istanbul Park
GLA Occupancy Jun-21 Dec-20
12Shopping Centers Occupancy Cost Ratio
Tenants’ affordability ratio which fell below the long term average of 12.5-13% is soaring up with the restrictions lifted
Operational leverage of tenants weakened due to the loss in sales resulted in
As the negative impact of COVID-19 fade away, RGY expects to capture more
an increase in the amount of temporary incentives and lower OCR after
share from the increasing sales of tenants.
pandemic.
Portfolio OCR after Incentives (1) (2) Portfolio OCR after Incentives (1)
Last 12 Months Last 12 Months
12.5% 15.5%
12.4%
12.3%
12.2%
12.2% 12.2% 12.2%
12.1% 13.3%
12.1%
12.7%
12.0%
12.0% 12.2% 12.2%
11.9%
Aug Sep Oct Nov Dec Jan Feb Mar Apr May Jun Jul
2021 Dec-17 Dec-18 Dec-19 Dec-20 Jul-21
(1) Occupancy Cost Ratio = (Base rent + turnover rent + service charges [incl. management costs] + marketing contribution) / tenants’ sales in preceding 12 months
(2) OCR between Mar-May 2020 is not calculated due to closure of shopping centers.
13Shopping Centers Lease Profile
Long term rental contract profile is maintained with a WAULT of 5.7 years.
Weighted average unexpired lease term is 5.7 years thanks to the policy to
99% of the contracts include turnover rent clause, which enables RGY to
negotiate long-term lease contracts. The share of contracts to be renewed in
capture a better margin from the over-performing tenants.
next five years are well balanced.
Lease Expiry Schedule by GLA Type of Contracts by GLA
Retail - June 2021 Retail - June 2021
51%
88%
WAULT is 5.7
years.
1%
12%
13%
11% 10%
9%
7%
0 to 1 year 1 to 2 years 2 to 3 years 3 to 4 years 4 to 5 years 5+ years Base Rent Base + Turnover Rent Turnover Rent
14Offices Occupancy
Vacant units in office buildings are being filled with local and global names.
Three new lease contracts were signed in Hilltown Office for 4,378 sqm,
Occupancy in office buildings has risen to 98.7% in January, excluding Maltepe making the office fully leased. Also, Rönesans Group has relocated to 5,793
Piazza (34,266 sqm). (73.4% including Maltepe Piazza) sqm of area in Maltepe Piazza, which is expected to attract further anchor
tenants to the office.
Office Occupancy Occupancy by Offices
Period-end Jun 2021
99.6% 99.0% 98.7%
96.8% 94.8% 94.3%
100.0% 92.1% 120 111
120.0%
99.6% 99.0% 100.0% 100.0% 98.7%
90.0% 96.8% 94.8% 220 98.1%
100 100.0%
80.0%
70.0% 80 73.4% 76 80.0%
73.4% 170
60.0% 66.9% 65.1%
50.0% 60 52 60.0%
120
40.0%
40 34 40.0%
30.0%
125 70 16.9%
20.0% 111 111 20 15 20.0%
9
82
10.0% 66 66 66
-- --
0.0% 20
Küçükyalı Maltepe Park Hilltown Piazza Office Portfolio Portfolio
Dec-15 Dec-16 Dec-17 Dec-18 Dec-19 Dec-20 Jun-21 RönesansBiz Office Office excluding
Office GLA (000sqm) Occupancy inc. Piazza Office Piazza Office
Occupancy exc. Piazza Office GLA (000 sqm) Occupancy
15Future Outlook Operational Expectations for 2H21
Year-end expectations updated downwards due curfews in the first half of the year and the currency depreciation.
The operational results in the first half of 2021 could 2021 NOI Revisited (m TL)
not meet the expectations due to curfews prolonged to
the second quarter of the year. Variance
~ 4%
Given the encouraging results for early 2H21, we 484
update our expectations upwards in absence of the 776 807
further curfews. However the average EUR/TRY
expectation which was met in 1H21 is also increased 292
from 9.50 to 10.43 for 2021.
1H21 Actual 2H21 Budget 2021 Revisited 2021 Budget
Overall, we revise our NOI expectation for year-end to
2021 NOI Revisited (m EUR)
EUR 77m (TL 776m) and EBITDA(1) expectation to
EUR 75m (TL 756m) for the entire year at an average
Variance
EUR/TRY rate of 9.96. ~ 9%
46
85
77
31
1H21 Actual 2H21 Budget 2021 Revisited 2021 Budget
EUR/TL: 9.49 EUR/TL: 10.43 EUR/TL: 9.96 EUR/TL: 9.50
(1) EBITDA = Combined gross revenue – Combined operating expenses
16Table of Contents
A. Highlights
B. Operations
C. Financing
Appendix
Küçükyalı OfficeFinancing Loan Maturity Profile
Refinancing programme for 2021 is successully executed, relieving the repayment plan for 2021-2022.
Gross financial debt balance of EUR 1,095m as of Loan Maturity Profile (m EUR) Corporate Loans
Jun-21 (Net: EUR 1,019m (1)) June 2021 Corporate Bonds
PF Balloon - Other Assets
PF Balloon - GIC JVs
Optimum Ankara 469
14 PF Amortization
Term sheet signed to
refinance the loan. The
deal is expected to be
Reduction of net debt by EUR 15m in 1H21 despite closed by September. 264 297
the lost income due to curfews
136
133 145
- -
26 169 48
52
91 51 131
6
-
41 - 46
Completion of three long-term financing deals 4 17 22
2H21 2022 2023 2024 2025 and beyond
amounting EUR 140m and rescheduling of EUR 61m
payment between 2021-2024 to relieve the repayment Loan Maturity Profile (m EUR) (2)
schedule and to reduce the currency mismatch risk Reduction by Reduction by June 2020
Corporate Loans
Corporate Bonds
Samsun Piazza – TRY 525m EUR 229m EUR 65m PF Balloon - Other Assets
PF Balloon - GIC JVs
PF Amortization
Optimum İstanbul – EUR 55m (3) 481
14
Optimum Ankara – USD 42.5m (3) (Term sheet
signed) 281 264
27
198
Maltepe Piazza – Rescheduling 89 18
179
54 92
Küçükyalı Hilltown – Rescheduling and partial 106
91
169
43
conversion to Turkish Lira 59 36 34 43
88
2021 2022 2023 2024 2025 and beyond
(1) Net Debt = Gross financial debt – cash – bonds held
(2) For a like-for-like comparison, June-21 ending FX rates are used.
(3) RGY share
18
PF: Project FinanceFinancing Liquidity & Hedge Position
FX mismatch risk is being mitigated with several tools including liquidity, borrowing in local currency and derivatives.
Sufficient amount of liquidity (EUR 50m) despite FX Short Position (m EUR)
challenging pandemic conditions which impeded 1,200
business operations. 1,000
Reduction by
EUR 325m
800
Bonds held with a nominal value of USD 32m
600
1,056 1,034
Reduction of FX short position by EUR 325m to EUR 400
727 709
709m since 2019 year-end through conversion of 200
some of FX loans to TL, increasing FX liquidity and --
forward positions. Dec-18 Dec-19 Dec-20 Jun-21
Increasing the share of TL indebtedness to 20% in Loan Breakdown by Currencies FX Hedge Breakdown of Cash Loans
June 2021 from 1% at December 2019 2021-06
Hedge rate of 35% for the cash loan portfolio TL
20.2%
TL Debt 20%
Unhedged Hedged
65% 35%
EUR
66.4% FX Liquidity 3%
USD Forwards 9%
13.4%
Positive MtM 0%
Bonds 2%
Exchange rates on 30/06/2021: EUR/TRY 10.36, EUR/USD: 1.19
19Financing Covenants
All covenants at both project finance loans and Eurobond are satisfied without any breach and with sufficient headroom.
Combined LTV (1) Unencumbered Asset Value Ratio (1)
2.29x
65% 2.11x
1.61x
52.3% 53.8%
1.36x
44.3% 46.2%
1.20x
Dec-18 Dec-19 Dec-20 Jun-21 Dec-18 Dec-19 Dec-20 Jun-21
Combined Loan-to-Value Eurobond Covenant Unencumbered Asset Value Ratio Eurobond Covenant
(1) Based on the methodology in Eurobond offering circular
20Investments &
Divestment Plan for Non-core Assets
Divestments
Disposal plan for non-core properties is on progress as planned.
Strategy to recycle the balance sheet and dispose the non-core assets has been The remaining non-core assets in the portfolio amounting to EUR 104m are
succesfully executed. So far EUR 116m of assets has been disposed with an planned to be exposed in next 2-3 years. When completed, RGY will have
average premium of 12.6% over the most recent TRY valuation. achieved EUR 220m of disposals.
Property Deal Size Premium Date Status Property Valuation (Jun-21)
Maltepe Piazza Office EUR 39.8m
Antalya Land TRY 24.3m 9.9% Jun-20 Completed
Maltepe Park Office EUR 15.9m
Mecidiyeköy Office EUR 31.5m 10.8% Aug-20 Completed
Antalya Muratpaşa Land EUR 17.3m
USD 40m to be collected in Dec- Ümraniye Land EUR 9.6m
Bayraklı Land USD 50m 16.2% Mar-21
21
Mamak Land EUR 9.1m
USD 16m to be collected btw Jul-
Bursa Land USD 19m 27.2% Jun-21
Nov-21
Silivri Land EUR 4.8m
Konak Land USD 25.3m 0.4% Jul-21 Completed in Jul-21 Ayazağa Land EUR 4.7m
İzmit Land EUR 2.5m
Disposals-to-date EUR 116m 12.6%
Disposals in the agenda EUR 104m
Total Disposal Plan EUR 220m
21Table of Contents
A. Highlights
B. Operations
C. Financing
Appendix
Maltepe PiazzaCompany Overview Shareholding Structure
GIC
Rönesans Emlak 21.44%
Geliştirme Holding
74.24% Government of Singapore Investment
Corporation (GIC) is a global investment
Rönesans Holding is a shareholder of RGY, management company established in 1981
via Rönesans Emlak Geliştirme Holding. to manage Singapore's foreign reserves.
Rönesans Holding operates in the sectors GIC is also 50% partner with RGY in three
of construction, real estate, energy and joint ventures holding Optimum İstanbul,
PPP in healthcare. Optimum Ankara, and Optimum İzmir.
Flagship operation, Rönesans
Construction, is the world’s 33 largest
rd
international contracting company. Other (1)
4.32%
(1) Kamil Yanıkömeroğlu, Chairman of RGY and Murat Özgümüş
23Company Overview Rönesans Holding – Key Partnerships
Investor Since Scope Details
Member of the World Bank • USD 215m equity investment for 5.25% stake
International Finance Institution (IFI) that focuses exclusively on the 2016 Rönesans Holding • c. USD 4bn pre-money valuation
private sector in developing countries • Extensive financial, corporate, environmental and social due diligence
Sovereign wealth fund established by the Government of Singapore RGY • EUR 250m equity investment for 21.44% stake (4Q14)
2013 (Turkish real estate • Acquired 50% in 3 prime operational retail assets in Turkey prior to platform
Worldwide investor of real estate across the entire capital structure platform) transaction between 2013 - 2014
RSY • Partnered at development stage in Adana, Yozgat, Elazig and Bursa Hospital PPP
(Turkish PPP investment projects
France based asset manager EUR6bn AuM 2013
platform) • >4k beds to be built and operated under a 25-year concession from the MoH
Hospital PPP projects • Yozgat, Adana and Elazığ hospitals are in operation
• Partnered at development stage for the 2,682 bed capacity Ikitelli Hospital to be
RSY
Japan based investment and trading company 2017 built & operated under a 25-year concession from MoH
Hospital PPP project
• Financial close with JPY163bn (JPY200bn total capex) in Jul’17
• Partnered for the design and building works of three gravity base structures for
Italian based engineering, construction and drilling provider specialized Renaissance
2018 the Arctic LNG 2 project with a total contract amount of c. EUR2.4bn.
in the oil and gas industry Heavy Industries
• In 2020, also cooperating in RHI’s first project in Mozambique
Sovereign wealth fund established by the government of Russia Desna • Partnered for attractive investment opportunities in the Russian Federation,
Working alongside the world’s foremost investors, makes direct 2017 (Russian real especially in commercial real estate sector.
investments in leading, as well as promising, Russian companies. estate platform) • Raised RUB6.4bn in 2017
24Property Portfolio Yielding Properties
# Property Partner Location Opening Type Encumbrance GAV (m EUR) (1) GLA (sqm) Occupancy (2)
1 Karşıyaka Hilltown - Karşıyaka / İzmir October 2019 Retail Yes 209.9 63,000 99.7%
2 Maltepe Piazza - Maltepe / İstanbul April 2018 Retail / Office / Residence Yes 237.3 53,000 / 34,000 96.4% / 16.9%
3 Küçükyalı Hilltown - Maltepe / İstanbul October 2017 Retail / Office Yes 229.8 63,000 / 9,500 95.1% / 100%
4 Şanlıurfa Piazza - Eyyübiye / Şanlıurfa October 2013 Retail Yes 56.5 42,000 95.2%
5 Kahramanmaraş Piazza - Onikişubat / K.Maraş April 2013 Retail No 76.9 48,000 96.5%
6 Samsun Piazza - Canik / Samsun March 2013 Retail / Hotel Yes 159.5 62,000 99.7%
7 Optimum İzmir GIC (50%) Gaziemir / İzmir March 2012 Retail Yes 325.5 84,000 96.5%
8 Optimum Adana - Yüreğir / Adana April 2011 Retail Yes 147.5 60,000 96.2%
9 Kozzy - Kadıköy / İstanbul April 2010 Retail Yes 24.4 14,000 91.0%
10 Optimum İstanbul GIC (50%) Ataşehir / İstanbul November 2008 Retail Yes 188.9 41,000 89.4%
11 Maltepe Park - Maltepe / İstanbul January 2005 Retail / Office No 161.7 73,000 / 15,000 89.8% / 100%
12 Optimum Ankara GIC (50%) Etimesgut / Ankara October 2004 Retail Yes 145.0 38,000 96.5%
13 RönesansBiz Küçükyalı - Maltepe / İstanbul December 2014 Office / School Yes 73.8 52,000 98.1%
(1) IFRS figures as of Jun-21
(2) As of Jul-21
25Property Portfolio Land Assets
# Property Partner Location Encumbrance GAV (m€) Area (sqm)
14 Antalya Beachtown Land - Konyaaltı / Antalya No 25.2 121,000
15 Konak Land (1) Tekfen Group (50%) Konak / İzmir No 42.0 49,000
16 Mamak Land - Mamak / Ankara No 9.1 46,000
17 Silivri Land - Silivri / Istanbul No 4.8 42,000
18 Optimum Antalya Land - Muratpaşa / Antalya Yes 17.3 31,000
19 İzmit Land - Körfez / İzmit Yes 2.5 30,000
20 Bursa Land (2) - Nilüfer / Bursa Yes 14.3 25,000
21 Ümraniye Land Doğan Group (50%) Ümraniye / Istanbul No 19.2 23,000
22 Ayazağa Land - Sarıyer / Istanbul No 4.7 7,000
(1) Disposed in July 2021
(2) Contract to sell signed in June 2021, the proceeds will be collected by November 2021.
26Property Portfolio Karşıyaka Hilltown
Project Overview
Type Retail
Location Karşıyaka / İzmir
Opening October 2019
Partner -
DST (1) 850 m
GLA (sqm) 63,000
Occupancy 99.7%
GAV € 209.9
Major Tenants
(1) Distance from station refers to distance to metro, light or high speed train
27Property Portfolio Maltepe Piazza
Project Overview
Type Retail & Office & Residence
Location Maltepe / İstanbul
Opening April 2018
Partner -
DST (1) Direct
GLA (sqm) 53,000 / 34,000
Occupancy 96.4% / 16.9%
GAV € 237.3m (2)
Major Tenants
(1) Distance from station refers to distance to metro, light or high speed train
(2) Residences are not included
28Property Portfolio Küçükyalı Hilltown
Project Overview
Type Retail & Office
Location Maltepe / İstanbul
Opening October 2017
Partner -
DST (1) 300 m
GLA (sqm) 63,000 / 9,500
Occupancy 95.1% / 100%
GAV € 229.8m
Major Tenants (2)
(1) Distance from station refers to distance to metro, light or high speed train
(2) Trelleborg, Tavuk Dünyası And Polisan are office tenants.
29Property Portfolio Şanlıurfa Piazza
Project Overview
Type Retail
Location Eyyübiye / Şanlıurfa
Opening October 2013
Partner -
DST (1) N/A (2)
GLA (sqm) 42,000
Occupancy 95.2%
GAV € 56.5m
Major Tenants
(1) Distance from station refers to distance to metro, light or high speed train
(2) No metro or light train line in the city
30Property Portfolio Kahramanmaraş Piazza
Project Overview
Type Retail
Location Onikişubat / K.Maraş
Opening April 2013
Partner -
DST (1) N/A (2)
GLA (sqm) 48,000
Occupancy 96.5%
GAV € 76.9m
Major Tenants
(1) Distance from station refers to distance to metro, light or high speed train
(2) No metro or light train line in the city
31Property Portfolio Samsun Piazza
Project Overview
Type Retail & Hotel
Location Canik / Samsun
Opening March 2013
Partner -
DST (1) 100 m
GLA (sqm) 62,000
Occupancy 99.7%
GAV € 159.5m
Major Tenants
(1) Distance from station refers to distance to metro, light or high speed train
32Property Portfolio Optimum İzmir
Project Overview
Type Retail
Location Gaziemir / İzmir
Opening March 2012 (2)
Partner GIC (50%)
DST (1) 50 m
GLA (sqm) 84,000
Occupancy 96.5%
GAV € 325.5m
Major Tenants
(1) Distance from station refers to distance to metro, light or high speed train
(2) Extension part was opened in March 2017.
33Property Portfolio Optimum Adana
Project Overview
Type Retail
Location Yüreğir / Adana
Opening April 2011
Partner -
DST (1) 350 m
GLA (sqm) 60,000
Occupancy 96.2%
GAV € 147.5m
Major Tenants
(1) Distance from station refers to distance to metro, light or high speed train
34Property Portfolio Kozzy
Project Overview
Type Retail
Location Kadıköy / İstanbul
Opening April 2010
Partner -
DST (1) 1,300 m
GLA (sqm) 14,000
Occupancy 91.0%
GAV € 24.4m
Major Tenants
(1) Distance from station refers to distance to metro, light or high speed train
35Property Portfolio Optimum İstanbul
Project Overview
Type Retail
Location Ataşehir / İstanbul
Opening November 2008
Partner GIC (50%)
DST (1) 650 m
GLA (sqm) 41,000
Occupancy 89.4%
GAV € 188.9m
Major Tenants
(1) Distance from station refers to distance to metro, light or high speed train
36Property Portfolio Maltepe Park
Project Overview
Type Retail / Office
Location Maltepe / İstanbul
Opening January 2005
Partner -
DST (1) 200 m
GLA (sqm) 73,000 / 15,000
Occupancy 89.8% / 100%
GAV € 161.7m
Major Tenants (2)
(1) Distance from station refers to distance to metro, light or high speed train
(2) CarrefourSA and TeknoSA are tenants on both retail and office parts.
37Property Portfolio Optimum Ankara
Project Overview
Type Retail
Location Etimesgut / İstanbul
Opening October 2004
Partner GIC (50%)
DST (1) 1,600 m
GLA (sqm) 38,000
Occupancy 96.5%
GAV € 145m
Major Tenants
(1) Distance from station refers to distance to metro, light or high speed train
38Property Portfolio RönesansBiz Küçükyalı
Project Overview
Type Office / School
Location Maltepe / İstanbul
Opening December 2014
Partner -
DST (1) 500 m
GLA (sqm) 52,000
Occupancy 98.1%
GAV € 73.8m
Major Tenants
(1) Distance from station refers to distance to metro, light or high speed train
39Financial Highlights First Half 2021 Results
Consolidated (000 TRY) Combined (000 TRY) (1) Combined (000 EUR) (1)
Jun-21 Dec-20 Jun-21 Dec-20 Jun-21 Dec-20
Cash and cash equivalents 462,744 843,516 513,753 892,142 49,569 99,040
Financial Investments 270,864 203,234 270,863 203,234 26,134 22,562
Trade Receivables 162,586 105,908 177,957 123,467 17,170 13,707
Investments accounted for using the equity method 2,235,236 2,055,437 -- -- -- --
Investment Properties 14,933,419 14,187,841 18,667,540 17,586,111 1,801,104 1,952,299
VAT Receivable 363,305 408,110 375,313 420,110 36,211 46,638
Other Assets 666,552 268,080 1,161,249 727,607 112,041 80,774
Total Assets 19,094,706 18,072,126 21,166,675 19,952,671 2,042,228 2,215,019
Financial Borrowings 9,548,098 8,760,572 11,305,862 10,369,164 1,090,826 1,151,119
Trade Payables 88,012 91,185 94,216 97,820 9,090 10,859
Deferred Tax Liabilities 1,224,974 1,123,725 1,788,707 1,637,127 172,580 181,743
Other Liabilities 1,413,498 1,377,213 1,157,766 1,129,129 111,705 125,349
Total Liabilities 12,274,582 11,352,695 14,346,551 13,233,240 1,384,201 1,469,070
Total Shareholders' Equity 6,820,124 6,719,431 6,820,124 6,719,431 658,027 745,949
1H21 1H20 1H21 1H20 1H21 1H20
Revenue 364,351 304,121 431,005 355,702 45,436 49,886
Cost of Sales (115,884) (95,117) (130,809) (106,804) (13,790) (14,979)
Gross Profit 248,467 209,004 300,196 248,898 31,646 34,907
Operating Expenses (16,841) (13,745) (18,669) (14,312) (1,968) (2,007)
EBITDA 231,626 195,259 281,527 234,586 29,678 32,900
NOI 238,743 199,599 292,139 240,809 30,797 33,772
(1) Proportionate figures for the assets fully consolidated and the ownership at share of the assets accounted for using the equity method.
Figures may not add up to sum due to rounding.
40Financial Highlights Covenant Calculation
Related Footnotes in the Independent Auditor’s Report – December 2020
TRY 000 June 2021 (1) Note 22 (p.52)
(1)
Total Current and Non-Current Financial Debt 9,548,098 (2) Share of RGY (50%) in joint ventures’ financial debts, Note 3 (p.17)
Less: Current Portion of Long Term Operational Lease (1) 6,005 (3) Second paragraph, Note 11 (p. 43)
(1)
Less: Long Term Obligation under Operational Lease 208,439 (4) “Combined” line, Note 4a (p.21)
(2)
Add: Current Financial Debts of JVs 467,588
(5) Sum of assets of Kabataş Rönesans, Nisbetiye, Pendik, Mel3, Florya, Bakırköy, Kavacık,
(2)
Add: Non-Current Financial Debts of JVs 1,504,667
(3)
Sancaktepe, Akatlar, Kandilli, Rönesans Gayrimenkul Yatırım, Rönesans Yönetim and Other, Note
Add: Off Balance Sheet 82,164
4a (p.21)
Total Indebtedness 11,388,072
Total Assets (4) 21,166,675 (6) Encumbered landplot value as per management reporting
Combined LTV 53.8% (7) Note 22 (p.52) (Refers to unsecured Eurobond issued by RGY)
(8) Note 22i (p.53) (Refers to secured and unsecured corporate loans utilized by RGY)
(5)
Unencumbered Total Assets 4,225,881 (9) Secured corporate loans utilized by RGY as per management reporting
(6)
Less: Encumbered Landplot Value 353,935
Combined Unencumbered Total Assets 3,871,946
Short term portion of issued corporate bonds (7) 42,032
(7)
Corporate bonds 2,611,560
(8)
Corporate Loans 447,000
(9)
Less: Secured Corporate Loans 264,000
Combined Unsecured Indebtedness 2,836,592
Unencumbered Asset Value Ratio 1.36x
41Contact Details
Sercan Yüksel
CFO
sercan.yuksel@rgy.com.tr
Investor Relations
investor.relations@rgy.com.tr
Rönesans Gayrimenkul Yatırım A.Ş.
Cevizli Mahallesi, Tugay Yolu Caddesi A Blok No: 69A Kat:7, Maltepe, İstanbul, 34846, Turkey
Phone: +90 216 430 6000
Fax: +90 216 430 6902
Çankaya Mahallesi Atatürk Bulvarı No:144-146 Protokol Yolu, Çankaya, Ankara 06690, Turkey
Phone: +90 312 840 1000
Fax: +90 312 442 5948
42You can also read