Investor Presentation - FY-2020 Results 23 March 2021 - Rönesans Gayrimenkul

Page created by Brandon Mills
 
CONTINUE READING
Investor Presentation - FY-2020 Results 23 March 2021 - Rönesans Gayrimenkul
Investor Presentation
FY-2020 Results
23 March 2021
Investor Presentation - FY-2020 Results 23 March 2021 - Rönesans Gayrimenkul
Disclaimer

This document was prepared by Rönesans Gayrimenkul Yatırım (“RGY” or “the Company”) solely for use of presenting the financial and operational results for the
financial year of 2020, published on March 23, 2020. This document is not to be reproduced or distributed, in whole or in part, by any person other than the Company.
The Company takes no responsibility for the use of these materials by any person.

The information contained in this document has not been subject to independent verification and no representation, warranty or undertaking, express or implied, is
made as to, and no reliance may be placed on, the fairness, accuracy, completeness or correctness of the information or opinions contained herein.

Neither the Company nor its shareholders, its advisors, its representatives or any other person shall be held liable for any loss arising from any use of this document or
its contents or otherwise arising in connection with this document. In the event of any discrepancies between the information contained in this document and the public
documents, the latter shall prevail.

This document does not constitute an offer to sell or an invitation or solicitation of an offer to subscribe for or purchase any securities, and this shall not form the basis
for or be used for any such offer or invitation or other contract or engagement in any jurisdiction.

                                                                                                                                                                                 2
Investor Presentation - FY-2020 Results 23 March 2021 - Rönesans Gayrimenkul
Financial Highlights                            2020 Financial Year Results

           Global turmoil due to Covid-19 has negatively affected an otherwise strong operational performance

       107.1            105.9                            Net Operating                                                                    Gross Asset   2,445    2,393
                                                               Income                                                                     Value                           1,952
                                         66.8

                                                                € 67m                                                                      € 2.0bn

        2018             2019             2020              * Year-average Retail                                                                       Dec-18   Dec-19   Dec-20
                                                            Occupancy

                                                                                                           2020

       102.2            102.4                                         EBITDA                                                              EPRA NAV      1,374
                                                                                                                                                                 1,267

                                          63.9                                                                                                                             928

                                                                € 64m                                                                      € 0.9bn

        2018             2019             2020                                                                                                          Dec-18   Dec-19   Dec-20

Proportionate figures for the assets fully consolidated and the ownership at share of the assets accounted for using the equity method.
                                                                                                                                                                                   3
Investor Presentation - FY-2020 Results 23 March 2021 - Rönesans Gayrimenkul
Business Highlights        2020 Financial Year Results

Operations                                                    Income & Valuations
  COVID-19 caused a stagnation in consumer activity both        RGY has granted rent-free period to tenants for the
  through lockdowns/curfews and people wary of                  period that shopping centers were closed and has been
  spreading risk. Shopping centers were fully or partially      providing discounts since June based on the monthly
  closed for almost 4 months in 2020.                           performance.

  Trading resumed by 1st of June as shopping centers
  reopened after the lockdown. From June to November,           Severe depreciation of Turkish Lira in 2020 was another
  tenant sales and footfall were down by 10.4% and              challenger. Average EUR/TRY was up by 26% over
  42.5% respectively compared to the same period in             2019.
  previous year. Yet the government-imposed curfews
  since the end of November has caused another break
  from the recovery.                                            Consequently RGY generated a net operating income of
                                                                EUR 67m in 2020 with 45% LfL decrease over previous
                                                                year.
  Despite pandemic conditions, year-average retail
  occupancy remained high at 95.9%, +1.3% above of
  2019 on LfL basis.                                            Same-property valuations declined by 17.1% in Euro
                                                                terms compared to 2019 year-end.
  Net bad debt ratio is realized as 1.6%.

                                                                                                                          4
Investor Presentation - FY-2020 Results 23 March 2021 - Rönesans Gayrimenkul
Business Highlights       2020 Financial Year Results

Investments & Divestments                                    Management & Shareholders
  Disposal of three non-core properties since June 2020 in     Shareholders' support in place with EUR 25.5m loan. No
  line with the strategy                                       plan for dividend distribution and commitment to provide
      Antalya land plot for TL 24.5m (~EUR 3.2m) in            additional support if needed.
      Jun-20 with 10% premium above the latest TL
      valuation.
      Mecidiyeköy Office for TL 270.4m (EUR 31.5m)
      in Aug-20 with 11% premium above the latest TL
      valuation.
      Bayraklı Land for TL 396.3m (USD 50m) in Mar-
      21 with 16% premium above the latest TL
      valuation. (USD 40m of the proceeds will be
      received in December 2021)

  Purchase of own bonds from the secondary market with
  a face value of USD 30m.

                                                                                                                          5
Investor Presentation - FY-2020 Results 23 March 2021 - Rönesans Gayrimenkul
Business Highlights                            2020 Financial Year Results

Financing                                                                               Liquidity & Hedge Position
     Procurement of three long-term financing at TRY 1                                    EUR 99m cash in hand
     billion in 2020 to relieve the repayment schedule and
     currency mismatch risk
                                                                                          Enhancement of liquidity with bonds with a nominal
              Küçükyalı Office & School – TRY 270m                                        value of USD 30m.
              Optimum Adana – TRY 525m
              Şanlıurfa Piazza – TRY 200m                                                 Reduction of FX short position by EUR 307m in 2020

     Conversion of existing corporate loans from Euro (EUR                                37% of total loan hedged against currency risk
     14.8m) to TL with a top-up of EUR 35.2m

                                                                                          Compensation of the loss in operational cash flow in
     Reduction of net debt                  (1)   by EUR 68m in 2020                      2020 through the gain on FX derivatives

     Successful execution of consent solicitation process to
     amend Eurobond covenants with 94% attendance and
     99% support

(1) Net Debt = Gross financial debt – cash – bonds held
                                                                                                                                                 6
Investor Presentation - FY-2020 Results 23 March 2021 - Rönesans Gayrimenkul
Business Highlights                      COVID-19 Update

         COVID-19 had a detrimental effect over shopping center operations despite several precautions are applied to relieve the stress

    The outbreak has adversely impacted operational performance of shopping centers since March 2020 through both
    government-imposed restrictions and stagnation in consumer demand.

    Economic uncertainties due to pandemic are expected to prevail until the end of 2021, challenging the income projections
    of the shopping centers.

                                                                 Closure of shopping centers for 73 days.                          Limited recovery after reopening impeded by the second wave

                              The Ministry of Internal Affairs                                                                                                    Government announced new
                              warned citizens not to leave                                                                                                        measures including a weekday
                              their houses unless absolutely                                                                                                      curfew between 9.00 pm and
                              necessary and announced                                                                                                             5.00 am and a weekend
                              several precautions, including                                                                                                      curfew. Restaurants/cafes are
                              a temporary suspension on                                                                                                           allowed to open for takeaway
                              the activities of entertainment                                                                                                     and delivery services only, the
                              venues and common areas                                                                                                             visitor capacity at shopping
      11 March 2020           such as performance centres,
                                                                       20 March 2020               Shopping centers reopened
                                                                                                                                           1 July 2020            centres is limited, and
The first COVID-19 case was   concert venues, cinemas,           Upon several retailers closing    after 73-days lockdown except   Entertainment areas            gatherings at home are
detected in Turkey.           cafes, playgrounds, and sports     their stores and the advice of    entertainment areas including   reopened.                      prohibited. It is unclear when
                              centres.                           Council of Shopping Centers-      cinemas and playgrounds.                                       these measures will be lifted.
                                                                 Turkey, RGY voluntarily shut
                                    16 March 2020                its shopping centers except
                                                                                                            1 June 2020                                               30 November 2020
                                                                 supermarkets and pharmacies.

                                                                                                                                                                                                    7
Investor Presentation - FY-2020 Results 23 March 2021 - Rönesans Gayrimenkul
Future Outlook                                  Operational Expectations for 2021

           Conservative expectations are maintained against a third wave of a lockdown.

     2021 is likely to keep staying in the shadow of the                                                                                       2021 NOI Projection (m TL)
     Coronavirus pandemic. Countrywide curfews since the
     end of November 2020 are expected to be loosened
     after the first quarter of 2021.                                                                                                                                      200

                                                                                                                                                72
                                                                                                                                                                          +37.4%
     As weather gets warmer and restrictions are lifted, a                                                                                    +13.5%
     sharp increase in consumer activity is expected in                                                                                                                                         807

     second and third quarters.                                                                                  535

     15% of the Turkish population has been vaccinated
     since Jan-21. We expect it to profilerate before the last                                               2020 Actual                  Inflation Impact            Pandemic Impact        2021 Budget
     quarter of the year so there will not be any
     lockdowns/curfews after the first quarter.                                                                                               2021 NOI Projection (m EUR)
     In the light these assumptions, our NOI expectation is
     EUR 85m (TL 807m) and EBITDA(1) expectation is
                                                                                                                                                                                    16
     EUR 83m (TL 791m) for 2021 at a year-average                                                                                                              25
                                                                                                                                                                                   -23.6%
     EUR/TRY rate of 9.50.                                                                                                                9
                                                                                                                                                             +37.4%
                                                                                                                                     +13.5%
     Total y-o-y growth in TL terms is expected to be 51%,                                                                                                                                         85
     of which 37.4% is directly linked to the pandemic                                                         67

     impact as shopping centers were fully or partially
     closed for almost 4 months in 2020.
                                                                                                         2020 Actual            Inflation Impact       Pandemic Impact           FX Impact     2021 Budget

Proportionate figures for the assets fully consolidated and the ownership at share of the assets accounted for using the equity method.
(1) EBITDA = Combined gross revenue – Combined operating expenses
                                                                                                                                                                                                             8
Investor Presentation - FY-2020 Results 23 March 2021 - Rönesans Gayrimenkul
Shopping Centers                   Occupancy

         High retail occupancy sustained for long years has been preserved despite the challenging marketing conditions

Year-average occupancy of shopping centers in 2020 was 95.9%, surpassing
                                                                                All shopping centers have an occupancy above 90%, except Maltepe Park
the previous year. Rent-free periods and temporary discounts provided to the
                                                                                whose re-tenanting operation has been delayed due to pandemic.
tenants helped occupancy to be stable.

                             Retail Occupancy                                                                                  Occupancy by Shopping Centers                                                                     Jan-21
                                                                  GLA
                              Period-Average                                                                                             Jan 2021                                                                                Dec-19
                                                                  Occupancy
100.0%
                                                                          850
 95.0%           96.9%
         95.4%             95.9%    95.4%               95.9%    95.8%
                                                94.3%
 90.0%                                                                    750

                                                                                                                                                 99.0%
                                                                                                                                     98.7%
                                                                                                 98.5%

                                                                                                                       97.1%
                                                                                 99.5%

                                                                                                         99.5%
                                                                                             99.1%

                                                                                                         98.5%

                                                                                                                                                                                     95.6%

                                                                                                                                                                                                                                       95.3%
                                                                                     95.3%

                                                                                                                                                                                                             94.5%
                                                                                                                   96.7%

                                                                                                                                 96.6%

                                                                                                                                             96.3%

                                                                                                                                                                         93.6%
                                                                                                                                                             93.5%

                                                                                                                                                                                                                                  95.8%
 85.0%

                                                                                                                                                         95.6%

                                                                                                                                                                     95.5%

                                                                                                                                                                                 95.4%

                                                                                                                                                                                                 92.9%
                                                                          650

                                                                                                                                                                                             93.3%

                                                                                                                                                                                                         90.6%

                                                                                                                                                                                                                     88.9%
                                                                                                                                                                                                                         86.2%
 80.0%
                                                                          550

 75.0%
                                                         640      640     450
 70.0%                                           594
                                     530
                                                                          350
 65.0%                      398
          374     374

                                                                                                         Optimum

                                                                                                                   Optimum

                                                                                                                                Optimum

                                                                                                                                             Optimum

                                                                                                                                                                     Küçükyalı

                                                                                                                                                                                 K. Maraş

                                                                                                                                                                                             Ş. Urfa

                                                                                                                                                                                                                                    Portfolio
                                                                                 Karşıyaka

                                                                                                                                                         Maltepe

                                                                                                                                                                                                                     Maltepe
                                                                                                                                                                                                           Kozzy
                                                                                             Samsun

                                                                                                                                                                                             Piazza
                                                                                                                   Istanbul

                                                                                                                                                                      Hilltown
                                                                                  Hilltown

                                                                                                                                                         Piazza
                                                                                              Piazza

                                                                                                                                 Ankara

                                                                                                                                                                                  Piazza
                                                                                                                                              Adana

                                                                                                                                                                                                                      Park
                                                                                                          Izmir
 60.0%                                                                    250
         2015     2016     2017      2018       2019    2020     Jan-21

                                                                                                                                                                                                                                                9
Investor Presentation - FY-2020 Results 23 March 2021 - Rönesans Gayrimenkul
Shopping Centers                                 Tenant Sales

           Same shopping center tenant sales declined by 23% in 2020 due to Coronavirus pandemic

High tenant performance in early 2020 was impeded by the pandemic. The                                           Few categories including electronics, jewellery, homewares & bulky goods and
gradual improvement after reopening is once again slowed down by the                                             hypermarkets outperformed the rest of the portfolio while entertainment, F&B,
country-wide curfews since the end of November.                                                                  and apparel segments are adversely impacted by the pandemic.

                    Growth in Same-Shopping Center Tenant Sales                     (1)                                                Change in Same-Store Tenant Sales by Categories in 2020                                                                                                                                             (1) (2)
                                                                                              Change in
                                Year-over-year Monthly                                        Tenant Sales
                                                                                                                  47%
                                                                                              Annual Inflation

                                                                                                                                                                                                                                                                                                                                           Average Inflation
 27.9% 30.3%                                                                                                                                                                                                                                                                                                                                   12.28%
                                                                                                                                      13%
                                                                                                                                                  5%
                 11.9% 10.9% 11.4% 12.6% 11.8% 11.8% 11.8% 11.9% 14.0% 14.6% 15.0%                                                                                          3%

 12.2% 12.4%                                                                                                                                                                              -5%                                                                                                                                                                            -8%
                                                  5.9%                      4.4%                                                                                                                            -13%
                                                                                                                                                                                                                              -17% -18%
                                                                    -7.8%                                                                                                                                                                                   -24%
                                                           -14.1%                  -12.5%                                                                                                                                                                                     -33% -34%

                                                                                                                                                                                                                                                                                                             -51%
                                                                                                                                                                                                                                                                                                                                             -55%
                 -42.9%                    -34.3%                                           -40.2% -41.8%

                      Shopping                                                                Country-

                                                                                                                                                                                                                               Apparel
                                                                                                                                                                            Hypermarket

                                                                                                                                                                                                                                                                                             Food Catering
                                                                                                                                                                                          Retail Services

                                                                                                                                                                                                                                         Department Store
                                                                                                                   Electrical Goods

                                                                                                                                      Jewellery

                                                                                                                                                                                                                                                                               Food Retail

                                                                                                                                                                                                                                                                                                              Other reporting categories
                                                                                                                                                                                                             General Retail

                                                                                                                                                                                                                                                                                                                                                                         Portfolio
                                                                                                                                                  Homewares & Bulky Goods

                                                                                                                                                                                                                                                                                                                                               Entertainment & Leisure
                                                                                                                                                                                                                                                             Leisure Retail
                    centers closed                                                              wide
                                                                                              curfews
                          -94.5% -96.1%

   Jan     Feb     Mar     Apr     May     Jun       Jul    Aug      Sep    Oct     Nov      Dec     Jan
                                              2020                                                  2021

(1) Only the malls that are operational at both T and T-12 are taken into account at each individual month.
(2) Excluding March, April and May
(3) Excluding Karşıyaka Hilltown
                                                                                                                                                                                                                                                                                                                                                                                     10
Shopping Centers                                 Occupancy Cost Ratio

           The slowdown in consumer activity resulted in tenants’ affordability ratio to fall below the long term average of 12.5-13%.

Operational leverage of tenants weakened due to the loss in sales resulted in                                     As the negative impact of COVID-19 fade away, RGY expects to capture more
an increase in the amount of temporary incentives and lower OCR in 2020.                                          share from the increasing sales of tenants.

                                       Portfolio OCR (1) (2)                                                                                                Portfolio OCR (1)
                                        Last 12 Months                                                                                                      Last 12 Months
 13.1%                                                                                                                                                15.5%

          12.9%

                                            12.7%

                                                                                                                                                                            13.3%
                                                             12.5%                                                          12.7%
                                                    12.5%
                                                                     12.4%                                                                                                          12.2%

                                                                              12.2%            12.2%
                                                                                      12.1%

   Jan     Feb     Mar      Apr     May      Jun      Jul     Aug     Sep      Oct     Nov      Dec
                                                2020                                                                        Dec-17                   Dec-18                Dec-19   Dec-20

(1) Occupancy Cost Ratio = (Base rent + turnover rent + service charges [incl. management costs] + marketing contribution) / tenants’ sales in preceding 12 months
(2) OCR between Mar-May 2020 is not calculated due to closure of shopping centers.
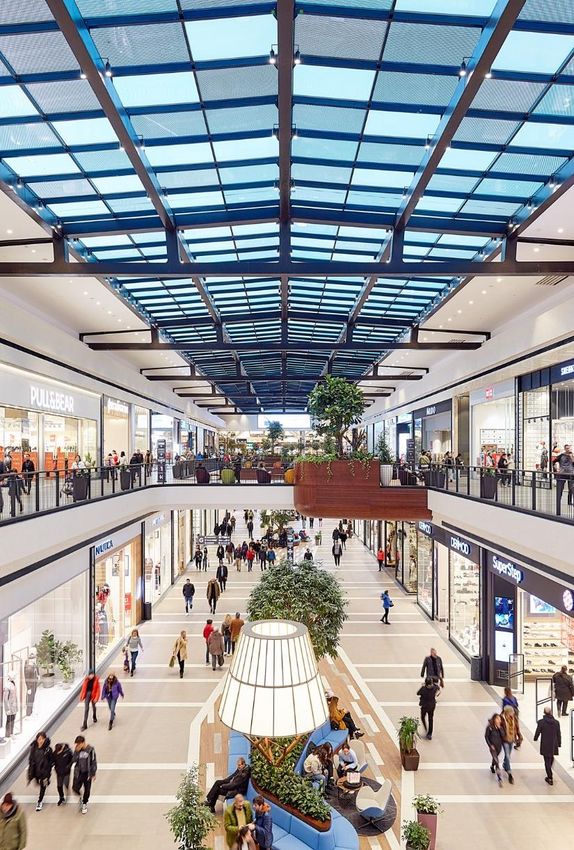
                                                                                                                                                                                              11
Shopping Centers                                Footfall

           The number of visitors have declined by 47% in 2020 as customers were wary of the spreading risk

Decline in the footfall figures were much severe than the tenant sales as
customers used shopping centers as instant buy-and-leave spots rather than                                    Footfall loss led an unprecedented increase in the average basket size.
entertainment and socializing venues.

                         Change in Same-Shopping Center Footfall                 (1)                                                      Change in Basket per Capita
                                   Year-over-year Monthly                                                                                       2019 vs. 2020
                                                                                                                                                                                               Inflation
                                                                                                                                                                                                12.3%

                                                                                                                          57.7%
   4%      4%
                                                                                                                                  51.1% 49.5%
                                                                                                                                              48.9% 48.8%
                                                                                                                                                            46.2%
                                                                                                                  43.4%                                             43.9%
                                                                                                                                                                            38.9%
                                                                                                                                                                                    36.0%
                                                  -32%                    -32%
                                                                                                                                                                                            29.7%
                                                                  -40%
                                                           -43%
                                                                                   -46%                                                                                                             23.3%
                  -51%
                                          -61%
                                                                                             -70%   -69%

                          -99%    -98%

   Jan     Feb     Mar     Apr     May     Jun       Jul   Aug     Sep     Oct         Nov   Dec    Jan
                                              2020                                                  2021

(1) Only the malls that are operational at both T and T-12 are taken into account at each individual month.
                                                                                                                                                                                                            12
Shopping Centers                           Lease Profile

         Long term rental contract profile is maintained with a WAULT of 6.1 years.

Weighted average unexpired lease term is over 6 years thanks to the policy to
                                                                                           99% of the contracts include turnover rent clause, which enables RGY to
negotiate long-term lease contracts. The share of contracts to be renewed in
                                                                                           capture a better margin from the over-performing tenants.
next five years are well balanced.

                                Lease Expiry Schedule by GLA                                                          Type of Contracts by GLA
                                   Retail - December 2020                                                              Retail - December 2020

                                                                                 53%

                                       WAULT is 6.1                                                                                                    89%

                                                                                                          1%

                                                                                                          10%

                                      15%

      9%                                              9%             8%
                     7%

   0 to 1 year   1 to 2 years      2 to 3 years   3 to 4 years   4 to 5 years   5+ years
                                                                                                          Base Rent     Base + Turnover Rent     Turnover Rent

                                                                                                                                                                     13
Offices                                    Occupancy

         Vacant units in office buildings are being filled with local and global names.

                                                                                                      In early 2021, two new lease contracts were signed in Hilltown Office for 1,508 sqm.
Occupancy in office buildings has risen to 96.2% in January, excluding Maltepe
Piazza (34,266 sqm). (71.7% including Maltepe Piazza)                                                 Rönesans Group has relocated to 5,793 sqm of area in Maltepe Piazza from its
                                                                                                      current office. Relocation is expected to attract further anchor tenants to the office.

                                  Office Occupancy                                                                                    Occupancy by Offices
                                     Period-end                                                                                            Jan 2021
         99.6%        99.0%
                               96.8%                                              96.2%                      100.0%       100.0%
100.0%                                      94.8%                    94.3%                            180                                                                        96.2%        110.0%
                                                         92.1%
         99.6%        99.0%
 90.0%                         96.8%                                                                  160
                                            94.8%                                               220
                                                                                                                                                                                              90.0%
                                                                                                                                        69.7%                      71.7%
 80.0%                                                                                                140                                                                                     70.0%

 70.0%                                                                                                120                                                           111
                                                                                  71.7%                                                                                                       50.0%
                                                                                                170
 60.0%                                                   66.9%       65.1%                            100
                                                                                                                                                      16.9%                                   30.0%
                                                                                                                                                                                   76
 50.0%                                                                                                80
                                                                                                120                                                                                           10.0%
 40.0%                                                                                                60        52

                                                                                                      40                                               34
 30.0%
                                                          125                                   70                          15
 20.0%                                                                111          111                20                                  9
                                              82                                                       --
 10.0%     66           66       66
                                                                                                             Küçükyalı Maltepe Park    Hilltown   Piazza Office   Portfolio     Portfolio
  0.0%                                                                                          20          RönesansBiz   Office        Office                                  excluding
         Dec-15      Dec-16    Dec-17      Dec-18       Dec-19      Dec-20       Jan-21                                                                                       Piazza Office

         Office GLA (000sqm)   Occupancy inc. Piazza Office      Occupancy exc. Piazza Office                                         GLA (000 sqm)         Occupancy

                                                                                                                                                                                                       14
Financing                                        Loan Maturity Profile

           Refinancing & rescheduling plan to relieve the repayment schedule is on track

     Gross financial debt balance of EUR 1,156m as                                                             Loan Maturity Profile (m EUR)
                                                                                                                December 20 – RGY's Share
     of Dec-20 (Net: EUR 1,032m (1))                                                                                                         Corporate Loans
                                                                                                                                             Corporate Bonds
                                                                                                                           483
                                                                                                                            17               Project Finance Bullet Payments - Other Assets
                                                                                                                                             Project Finance Bullet Payments - GIC JVs
                                                                                                                                             Project Finance Amortization
     Reduction of net debt                   (1)   by EUR 68m in 2020                                                       261

                                                                                          189           185                                                                  199
                                                                                          31            20
                                                                                                        38                                         101                        94
                                                                                          105                               169
                                                                                                         91                                        55
                                                                                                                                                                             105
                                                                                           53            36                 37                     46
     Completion of three long-term financing deal                                         2021          2022               2023                    2024                     2024+

     amounting TRY 1 billion in 2020 to relieve the
                                                                                                             Loan Maturity Profile (m EUR)   (2)
     repayment schedule in 2021 and 2022 by EUR                                     Reduction by   Reduction by June 20 – RGY's Share
     111m and reduce the currency mismatch risk                                      EUR 95m        EUR 16m                                  Corporate Loans
                                                                                                                                             Corporate Bonds
                                                                                                                           480               Project Finance Bullet Payments - Other Assets
              Küçükyalı Office & School – TRY 270m                                                                          17
                                                                                                                                             Project Finance Bullet Payments - GIC JVs
                                                                                                                                             Project Finance Amortization
              Optimum Adana – TRY 525m                                                    284                               261
                                                                                          31
              Şanlıurfa Piazza – TRY 200m                                                 89
                                                                                                        201
                                                                                                        20
                                                                                                                                                                             182
                                                                                                        54                                                                    92
                                                                                          105                               169
                                                                                                         91                                        43
                                                                                           59                                                                                 90
                                                                                                         36                 34                     43
                                                                                          2021          2022               2023                    2024                     2024+

(1) Net Debt = Gross financial debt – cash – bonds held
(2) For a like-for-like comparison, year end FX rates are used.
                                                                                                                                                                                              15
Financing                                   Liquidity & Hedge Position

          FX short position is reduced by EUR 307m in 2020 while cash balance is increased to EUR 99m

     Sufficient amount of liquidity (EUR 99m)                                                                   FX Short Position (m EUR)

     despite challenging pandemic conditions which                          1,200

                                                                            1,000
     impeded business operations.                                                                                                               Reduction by
                                                                             800                                                                EUR 307m
     Bonds held with a nominal value of USD 30m                              600
                                                                                                1,056                       1,034
                                                                             400
     Reduction of FX short position by EUR 307m to                                                                                                              727

                                                                             200
     EUR 727m since 2019 year-end through
                                                                               --
     conversion of some of FX loans to TL, increasing                                           Dec-18                      Dec-19                             Dec-20

     FX liquidity and forward positions.
                                                                                            Loan Breakdown                            FX Hedge Breakdown of Cash Loans
     Increasing the share of TL indebtedness to                                                2020-12
                                                                                          TL
     15% in 2020 from 1% at December 2019                                               15.3%                                                                            TL Debt
                                                                                                                                                                          15%

     Hedge rate of 37% for the cash loan portfolio                                   USD                                                                                   FX
                                                                                    12.3%                                            Unhedged        Hedged
                                                                                                                                                                        Liquidity
                                                                                                                                       63%            37%
                                                                                                                                                                           6%

                                                                                                                                                                        Forwards
                                                                                                                                                                          14%
                                                                                                              EUR
                                                                                                             72.4%
                                                                                                                                                                        Bonds 2%

Exchange rates on 31/12/2020: EUR/TRY 9.01, EUR/USD: 1.23
                                                                                                                                                                                    16
Financing                   Consent Solicitation

  94% of the investors participated, of which 99% voted in favor

Consent solicitation process was launched on 28                    Results at the Early Consent Deadline
January 2021 to modify terms and conditions of                     Outstanding                             $270,000,000

Eurobond to avoid any covenant breach. Following                   Votes in favour                         $251,610,000
                                                                   Votes against                             $2,250,000
amendments have been presented to the investors'
                                                                   Abstain                                          $0
consent.
                                                                   Attend Meeting                                   $0
 • LTV covenant: 60% > 65%                                         Total represented                       $253,860,000
 • CCR covenant: No test in 2020 and 2021, 1.35x                   Quorum reached                             94.02%
   in 2022 (currently 1.75x in 2020 & 2021, 2.00x
                                                                   Of which, in favour                        99.11%
   in 2022)
                                                                   Of which, against                             0.89%
Investors were offered with a consent fee of 0.4%                  Of which, abstain                             0.00%
for early birds and 0.1% for latecomers.

Investors welcomed this request with high
acceptance. The process is completed with 94%
quorum reached, of which 99% voted in favor.

                                                                                                                          17
Financing                                     Covenants

           All covenants at both project finance loans and Eurobond are satisfied without any breach and with sufficient headroom.

                                          Combined LTV       (1)
                                                                                                            Unencumbered Asset Value Ratio   (1)

                                                                                 65%             2.29x
                                                                                                                           2.11x

                                                                                                                                                   1.61x
                                                                                 52%
                                                  46%
               44%
                                                                                                                                                       1.20x

             Dec-18                             Dec-19                         Dec-20            Dec-18                   Dec-19                   Dec-20

                        Combined Loan-to-Value                     Eurobond Covenant                Unencumbered Asset Value Ratio       Eurobond Covenant

Sufficient headroom until a valuation loss of the property portfolio by                 Declining due to refinancing of Küçükyalı Office and depreciation of
22%                                                                                     TRY but still with sufficient headroom

(1) Based on the methodology in Eurobond offering circular
                                                                                                                                                               18
Investments &
                               Divestment Plan for Non-core Assets
   Divestments
   Disposal plan for non-core properties is on progress as planned.

                     Completed                                                     Planned to be disposed
Mecidiyeköy Office: EUR 31.5m disposal value – Aug’20                 Konak Land: EUR 24m valuation (RGY’s Share)
                                                                      Optimum Antalya Land: EUR 18.2m valuation
Antalya Land Plot : EUR 3.2m disposal value – Jun’20                  Maltepe Park Office: EUR 16.8m valuation
                                                                      Maltepe Piazza Office: EUR 43.8m valuation
Bayraklı Land Plot: USD 50m disposal value – Mar’21                   Ümraniye Land: EUR 10.4m valuation (RGY’s Share)
(USD 40m will be received in Dec-21)                                  Mamak Land: EUR 9.4m valuation
                                                                      Ayazağa Land: EUR 5.1m valuation
                 Total: EUR 76.5m                                     Silivri Land: EUR 4.9m valuation
                                                                      İzmit Land: EUR 2.7m valuation
Bursa Land Plot: USD 19m disposal value (Letter of
intent signed)

                                                                                     Total: EUR 135.2m
                  Total: USD 19m

                                                                                                                         19
APPENDIX
Company Overview                           Shareholding Structure

                                                                                   GIC
                                               Rönesans Emlak                      21.44%
                                             Geliştirme Holding
                                                       74.24%                      Government of Singapore Investment
                                                                                   Corporation (GIC) is a global investment
                 Rönesans Holding is a shareholder of RGY,                         management company established in 1981
                 via Rönesans Emlak Geliştirme Holding.                            to manage Singapore's foreign reserves.

                 Rönesans Holding operates in the sectors                          GIC is also 50% partner with RGY in three
                 of construction, real estate, energy and                          joint ventures holding Optimum İstanbul,
                 PPP in healthcare.                                                Optimum Ankara, and Optimum İzmir.

                 Flagship        operation,       Rönesans
                 Construction, is the world’s 33 largest
                                                 rd

                 international contracting company.                           Other (1)
                                                                               4.32%

(1) Kamil Yanıkömeroğlu, Chairman of RGY and Murat Özgümüş
                                                                                                                               21
Company Overview             Rönesans Holding – Key Partnerships

       Investor                                       Since   Scope                   Details
       Member of the World Bank                                                       • USD 215m equity investment for 5.25% stake
       International Finance Institution (IFI) that                                   • c. USD 4bn pre-money valuation
                                                      2016    Rönesans Holding
       focuses exclusively on the private sector in                                   • Extensive financial, corporate, environmental and social
       developing countries                                                             due diligence

       Sovereign wealth fund established by the
       Government of Singapore                                RGY                     • EUR 250m equity investment for 21.44% stake (4Q14)
                                                      2013    (Turkish real estate    • Acquired 50% in 3 prime operational retail assets in
       Worldwide investor of real estate across the           platform)                 Turkey prior to platform transaction between 2013 - 2014
       entire capital structure

                                                                                      • Partnered at development stage in Adana, Yozgat, Elazig
                                                              RSY
                                                                                        and Bursa Hospital PPP projects
                                                              (Turkish PPP
       France based asset manager EUR6bn AuM          2013                            • >4k beds to be built and operated under a 25-year
                                                              investment platform)
                                                                                        concession from the MoH
                                                              Hospital PPP projects
                                                                                      • Yozgat, Adana and Elazığ hospitals are in operation
                                                                                      • Partnered at development stage for the 2,682 bed
                                                                                        capacity Ikitelli Hospital to be built & operated under a
                                                              RSY
       Japan based investment and trading company     2017                              25-year concession from MoH
                                                              Hospital PPP project
                                                                                      • Financial close with JPY163bn (JPY200bn total capex) in
                                                                                        Jul’17

                                                                                                                                                    22
Property Portfolio                 Yielding Properties

#             Property          Partner          Location            Opening                 Type                Encumbrance   GAV (m EUR)   (1)     GLA (sqm)       Occupancy (2)

1         Karşıyaka Hilltown        -        Karşıyaka / İzmir     October 2019              Retail                  Yes           223.2               63,000           99.5%

2          Maltepe Piazza           -        Maltepe / İstanbul      April 2018    Retail / Office / Residence       Yes           251.7           53,000 / 34,000   95.6% / 16.9%

3         Küçükyalı Hilltown        -        Maltepe / İstanbul    October 2017          Retail / Office             Yes           243.3           63,000 / 9,500    95.5% / 69.7%

4          Şanlıurfa Piazza         -       Eyyübiye / Şanlıurfa   October 2013              Retail                  Yes            60.4               42,000           93.3%

5      Kahramanmaraş Piazza         -       Onikişubat / K.Maraş     April 2013              Retail                  No             82.6               48,000           95.4%

6          Samsun Piazza            -         Canik / Samsun        March 2013           Retail / Hotel              Yes           169.7               62,000           99.1%

7          Optimum İzmir        GIC (50%)     Gaziemir / İzmir      March 2012               Retail                  Yes           332.0               84,000           98.5%

8          Optimum Adana            -         Yüreğir / Adana        April 2011              Retail                  Yes           158.3               60,000           96.3%

9               Kozzy               -        Kadıköy / İstanbul      April 2010              Retail                  Yes            26.9               14,000           90.6%

10        Optimum İstanbul      GIC (50%)    Ataşehir / İstanbul   November 2008             Retail                  Yes           200.4               41,000           96.7%

11          Maltepe Park            -        Maltepe / İstanbul    January 2005          Retail / Office             No            160.0           73,000 / 15,000   88.9% / 100%

12        Optimum Ankara        GIC (50%)   Etimesgut / Ankara     October 2004              Retail                  Yes           153.3               38,000           96.6%

13      RönesansBiz Küçükyalı       -        Maltepe / İstanbul    December 2014        Office / School              Yes            80.2               52,000            100%

(1) IFRS figures as of Dec-20
(2) As of Jan-21
                                                                                                                                                                                     23
Property Portfolio             Land Assets

#          Property                Partner              Location          Encumbrance   GAV (m€)   Area (sqm)

14   Antalya Beachtown Land           -            Konyaaltı / Antalya        No          26.0      121,000

15        Konak Land          Tekfen Group (50%)      Konak / İzmir           No          48.1       49,000

16        Mamak Land                  -             Mamak / Ankara            No          9.4        46,000

17         Silivri Land               -              Silivri / Istanbul       No          4.9        42,000

18   Optimum Antalya Land             -            Muratpaşa / Antalya        No          18.3       31,000

19         İzmit Land                 -               Körfez / İzmit          No          2.7        30,000

20         Bursa Land                 -              Nilüfer / Bursa          No          14.4       25,000

21        Bayraklı Land               -              Bayraklı / Izmir         Yes         37.8       24,000

22       Ümraniye Land        Doğan Group (50%)    Ümraniye / Istanbul        No          10.4       23,000

23       Ayazağa Land                 -             Sarıyer / Istanbul        No          5.1        7,000

                                                                                                                24
Property Portfolio                              Karşıyaka Hilltown

             Project Overview
Type                   Retail
Location               Karşıyaka / İzmir
Opening                October 2019
Partner                -
DST (1)                850 m
GLA (sqm)              63,000
Occupancy              99.5%
GAV                    € 223.2

                Major Tenants

  (1) Distance from station refers to distance to metro, light or high speed train
                                                                                     25
Property Portfolio                              Maltepe Piazza

             Project Overview
Type                  Retail & Office & Residence
Location              Maltepe / İstanbul
Opening               April 2018
Partner               -
DST (1)               Direct
GLA (sqm)             53,000 / 34,000
Occupancy             95.6% / 16.9%
GAV                   € 251.7m (2)

                Major Tenants

  (1) Distance from station refers to distance to metro, light or high speed train
  (2) Residences are not included
                                                                                     26
Property Portfolio                              Küçükyalı Hilltown

             Project Overview
Type                  Retail & Office
Location              Maltepe / İstanbul
Opening               October 2017
Partner               -
DST (1)               300 m
GLA (sqm)             63,000 / 9,500
Occupancy             95.5% / 69.7%
GAV                   € 243.3m

              Major Tenants (2)

  (1) Distance from station refers to distance to metro, light or high speed train
  (2) Trelleborg, Tavuk Dünyası And Polisan are office tenants.
                                                                                     27
Property Portfolio                              Şanlıurfa Piazza

             Project Overview
Type                  Retail
Location              Eyyübiye / Şanlıurfa
Opening               October 2013
Partner               -
DST (1)               N/A   (2)

GLA (sqm)             42,000
Occupancy             93.3%
GAV                   € 60.4m

                Major Tenants

  (1) Distance from station refers to distance to metro, light or high speed train
  (2) No metro or light train line in the city
                                                                                     28
Property Portfolio                              Kahramanmaraş Piazza

             Project Overview
Type                  Retail
Location              Onikişubat / K.Maraş
Opening               April 2013
Partner               -
DST (1)               N/A   (2)

GLA (sqm)             48,000
Occupancy             95.4%
GAV                   € 82.6m

                Major Tenants

  (1) Distance from station refers to distance to metro, light or high speed train
  (2) No metro or light train line in the city
                                                                                     29
Property Portfolio                              Samsun Piazza

             Project Overview
Type                  Retail & Hotel
Location              Canik / Samsun
Opening               March 2013
Partner               -
DST (1)               100 m
GLA (sqm)             62,000
Occupancy             99.1%
GAV                   € 169.7m

                Major Tenants

  (1) Distance from station refers to distance to metro, light or high speed train
                                                                                     30
Property Portfolio                              Optimum İzmir

             Project Overview
Type                  Retail
Location              Gaziemir / İzmir
Opening               March 2012 (2)
Partner               GIC (50%)
DST (1)               50 m
GLA (sqm)             84,000
Occupancy             98.5%
GAV                   € 332m

                Major Tenants

  (1) Distance from station refers to distance to metro, light or high speed train
  (2) Extension part was opened in March 2017.
                                                                                     31
Property Portfolio                              Optimum Adana

             Project Overview
Type                  Retail
Location              Yüreğir / Adana
Opening               April 2011
Partner               -
DST (1)               350 m
GLA (sqm)             60,000
Occupancy             96.3%
GAV                   € 158.3m

                Major Tenants

  (1) Distance from station refers to distance to metro, light or high speed train
                                                                                     32
Property Portfolio                              Kozzy

             Project Overview
Type                  Retail
Location              Kadıköy / İstanbul
Opening               April 2010
Partner               -
DST (1)               1,300 m
GLA (sqm)             14,000
Occupancy             90.6%
GAV                   € 26.9m

                Major Tenants

  (1) Distance from station refers to distance to metro, light or high speed train
                                                                                     33
Property Portfolio                              Optimum İstanbul

             Project Overview
Type                  Retail
Location              Ataşehir / İstanbul
Opening               November 2008
Partner               GIC (50%)
DST (1)               650 m
GLA (sqm)             41,000
Occupancy             96.7%
GAV                   € 200.4m

                Major Tenants

  (1) Distance from station refers to distance to metro, light or high speed train
                                                                                     34
Property Portfolio                              Maltepe Park

             Project Overview
Type                  Retail / Office
Location              Maltepe / İstanbul
Opening               January 2005
Partner               -
DST (1)               200 m
GLA (sqm)             73,000 / 15,000
Occupancy             88.9% / 100%
GAV                   € 160.0m

              Major Tenants (2)

  (1) Distance from station refers to distance to metro, light or high speed train
  (2) CarrefourSA and TeknoSA are tenants on both retail and office parts.
                                                                                     35
Property Portfolio                              Optimum Ankara

             Project Overview
Type                  Retail
Location              Etimesgut / İstanbul
Opening               October 2004
Partner               GIC (50%)
DST (1)               1,600 m
GLA (sqm)             38,000
Occupancy             96.6%
GAV                   € 153.3m

                Major Tenants

  (1) Distance from station refers to distance to metro, light or high speed train
                                                                                     36
Property Portfolio                              RönesansBiz Küçükyalı

             Project Overview
Type                  Office / School
Location              Maltepe / İstanbul
Opening               December 2014
Partner               -
DST (1)               500 m
GLA (sqm)             52,000
Occupancy             100%
GAV                   € 80.2m

                Major Tenants

  (1) Distance from station refers to distance to metro, light or high speed train
                                                                                      37
Financial Highlights                         2020 Financial Year 2020 Results

                                                                           Consolidated (000 TRY)                                 Combined (000 TRY) (1)             Combined (000 EUR) (1)
                                                                      Dec-20                      Dec-19                      Dec-20                 Dec-19      Dec-20                 Dec-19
 Cash and cash equivalents                                            843,516                     332,087                     892,142                356,573     99,040                 53,615
 Financial Investments                                                203,234                        --                       203,234                  --        22,562                   --
 Trade Receivables                                                    105,908                      99,469                     123,467                112,674     13,707                 16,942
 Investments accounted for using the equity method                   2,055,437                   1,901,598                       --                    --           --                    --
 Investment Properties                                               14,187,841                 12,891,842                  17,586,111             15,916,157   1,952,299              2,393,191
 VAT Receivable                                                       408,110                     427,730                     420,101                439,694     46,637                 66,113
 Other Assets                                                         268,080                     376,444                     727,616                729,145     80,775                 109,636
Total Assets                                                        18,072,126                  16,029,170                 19,952,671              17,554,243   2,215,019             2,639,498

 Financial Borrowings                                                8,760,572                   6,471,471                  10,369,164              7,851,919   1,151,119              1,180,633
 Trade Payables                                                        91,185                     199,899                     97,820                 210,916     10,859                 31,714
 Deferred Tax Liabilities                                            1,123,725                   1,098,866                   1,637,127              1,573,993    181,743                236,669
 Other Liabilities                                                   1,377,213                   1,142,259                   1,129,129               800,741     125,349                120,401
Total Liabilities                                                   11,352,695                  8,912,495                  13,233,240              10,437,569   1,469,070             1,569,418
Total Shareholders' Equity                                           6,719,431                  7,116,675                   6,719,431              7,116,675    745,949               1,070,080

                                                                       2020                        2019                        2020                   2019        2020                   2019
 Revenue                                                              688,261                      35,190                     809,445                975,222     101,004                153,684
 Cost of Sales                                                       (239,037)                    (14,059)                   (265,484)              (278,091)    (33,128)              (43,824)
Gross Profit                                                          449,224                     21,131                     543,961                697,131      67,877                109,860
 Operating Expenses                                                   (30,067)                    (3,277)                    (31,921)               (47,305)     (3,983)                (7,455)
EBITDA                                                                419,157                     17,854                     512,040                649,826      63,894                102,405
NOI                                                                   437,641                    516,986                     535,178                672,013      66,781                105,902

 (1) Proportionate figures for the assets fully consolidated and the ownership at share of the assets accounted for using the equity method.
 Figures may not add up to sum due to rounding.
                                                                                                                                                                                                   38
Financing                                       Covenant Calculation

  TRY 000                                                  Dec-2020
                                                                                       Related Footnotes in the Independent Auditor’s Report – December 2020
                                               (1)
Total Current and Non-Current Financial Debt                8,760,572
                                                                                       (1) Note 28 (p.74)
Less: Current Portion of Long Term Operational Lease (1)     5,807
Less: Long Term Obligation under Operational Lease   (1)
                                                            191,964                    (2) Share of RGY (50%) in joint ventures’ financial debts, Note 3 (p.32)
Add: Current Financial Debts of JVs   (2)
                                                            977,774                    (3) Second paragraph, Note 13 (p. 59) and Note 32 (p.89)
Add: Non-Current Financial Debts of JVs (2)                 828,727                    (4) “Combined” line, Note 4a (p.36)
Add: Off Balance Sheet (3)                                   61,045
Total Indebtedness                                         10,430,347
Total Assets (4)                                           19,952,671                  (5) Sum of assets of Balmumcu, Kabataş Rönesans, Nakkaştepe, Nisbetiye, Pendik, Mel3, Florya,
Combined LTV                                                52.3%                          Bakırköy, Kavacık, Sancaktepe, Akatlar, Kandilli, Rönesans Gayrimenkul Yatırım, Rönesans
                                                                                           Yönetim and Other, Note 4a (p.36)
                             (5)
Unencumbered Total Assets                                   4,249,678
Less: Encumbered Landplot Value (6)
                                                                                       (6) Turan land value, Note 10b (p.55)
                                                            340,910
Combined Unencumbered Total Assets                         3,908,768                   (7) Note 28 (p.74) (Refers to unsecured Eurobond issued by RGY)
Short term portion of issued corporate bonds (7)             36,186                    (8) Note 28i (p.75) (Refers to secured and unsecured corporate loans utilized by RGY)
Corporate bonds (7)                                         2,202,150
                   (8)
                                                                                       (9) Secured corporate loans utilized by RGY as per management reporting
Corporate Loans                                             447,000
Less: Secured Corporate Loans (9)                           264,000
Combined Unsecured Indebtedness                            2,421,336
Unencumbered Asset Value Ratio                               1.61x

                                                                                                                                                                                       39
Contact Details

                                             Sercan Yüksel
                                                  CFO
                                        sercan.yuksel@rgy.com.tr

                                          Investor Relations
                                      investor.relations@rgy.com.tr

                  Rönesans Gayrimenkul Yatırım A.Ş.
           Küçükbakkalköy Mahallesi, Kayışdağı Caddesi No: 1, Ataşehir, İstanbul, 34750, Turkey
                                       Phone: +90 216 430 6000
                                        Fax: +90 216 430 6902

        Çankaya Mahallesi Atatürk Bulvarı No:144-146 Protokol Yolu, Çankaya, Ankara 06690, Turkey
                                        Phone: +90 312 840 1000
                                          Fax: +90 312 442 5948

                                                                                                    40
You can also read