EARNINGS CALL PRESENTATION - Q1 2021 - IUTECREDIT EUROPE

Page created by Nathaniel Medina
 
CONTINUE READING
EARNINGS CALL PRESENTATION - Q1 2021 - IUTECREDIT EUROPE
Earnings Call Presentation
          Q1 2021
EARNINGS CALL PRESENTATION - Q1 2021 - IUTECREDIT EUROPE
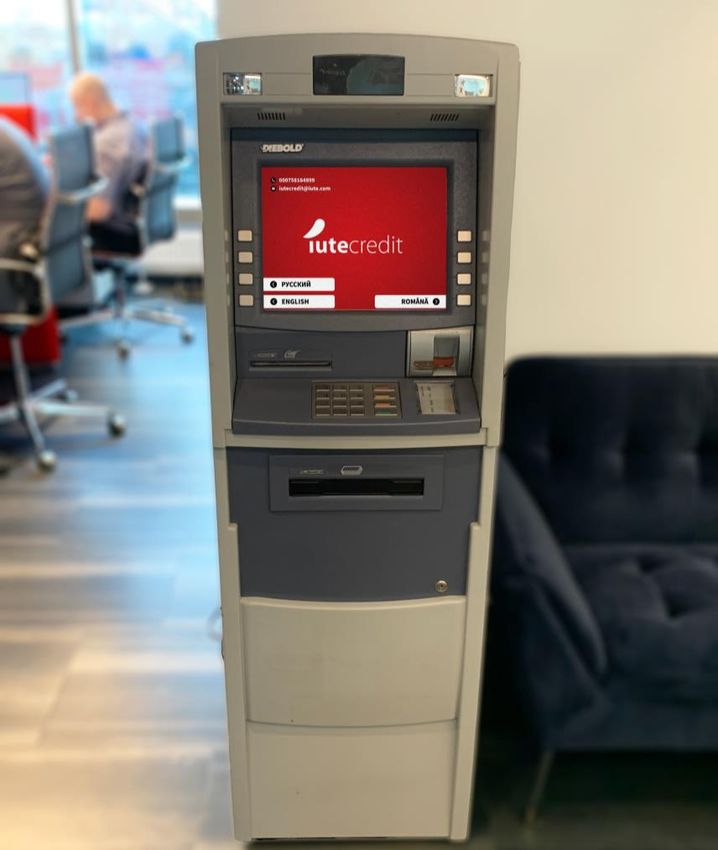
Disclaimer
The information contained in this presentation has been prepared by Aalto Capital AG, a registered corporate finance boutique located in Munich, Germany, based among others on materials provided
to us by IuteCredit.

The information in this presentation has not been independently verified and is subject to updating, completion, revision and further amendment. The presentation does not purport to contain all
information that a prospective lender may require. While the information contained herein has been prepared in good faith, neither the Borrower nor its shareholders, directors, officers, agents,
employees, or advisors, give, has given or has authority to give, any representations or warranties (expressed or implied) as to, or in relation to, the accuracy, reliability or completeness of the
information in this presentation or any revision thereof, or of any other written or oral information made or to be made available to any interested party or its advisors (all such information being
referred to as information) and liability therefore is expressly disclaimed save by each person in respect of their own fraud. Accordingly, the Borrower and its shareholders, directors, officers, agents,
employees or advisors do not take any responsibility for, and will not accept any liability whether direct or indirect, expressed or implied, contractual, statutory or otherwise, in respect of the accuracy
or completeness of the information or for any of the opinions contained herein or for any errors, omissions or misstatements or for any loss, how so ever arising from the use of this presentation.

Information contained in this presentation is confidential information and the property of the Borrower. It is made available strictly for the purposes referred to above. The presentation and any further
confidential information made available to any recipient must be held in complete confidence and documents containing such information may not be reproduced, used or disclosed without the prior
written consent of the Borrower. This presentation shall not be copied, published, reproduced or distributed in whole or in part at any time without the prior written consent of the Borrower. By
accepting delivery of this presentation, the recipient agrees to return it to the Borrower at the request of the Borrower.

This presentation should not be considered as the giving of investment advice by the Borrower or any of its shareholders, directors, officers, agents, employees or advisors. Each party to whom this
presentation is made available must make its own independent assessment of the Borrower after making such investigations and taking such advice as may be deemed necessary. In particular, any
estimates or projections or opinions contained herein necessarily involve significant elements of subjective judgment, analysis and assumption and each recipient should satisfy itself in relation to such
matters. Neither the issue of this presentation nor any part of its contents is to be taken as any form of commitment on the part of the Borrower to proceed with any transaction nor is the right
reserved to terminate any discussions or negotiations with any prospective lenders. In no circumstances will the Borrower be responsible for any costs, losses or expenses incurred in connection with
any appraisal or investigation of the Borrower.

This presentation does not constitute, or form part of, any offer or invitation to sell or issue, or any solicitation of any offer to subscribe for or purchase any securities in the Borrower, nor shall it, or the
fact of its distribution, form the basis of, or be relied upon in connection with, or act as any inducement to enter into, any contractor commitment what so ever with respect to such securities. The
Borrower assumes that the recipient has professional experience and is a high-net worth individual or Borrower this presentation has not been approved as any governmental agency.

By accepting this presentation, the recipient represents and warrants that it is a person to whom this presentation may be delivered or distributed without a violation of the laws of any relevant
jurisdiction. This presentation is not to be disclosed to any other person or used for any other purpose and any other person who receives this presentation should not rely or act upon it. Neither the
Borrower nor its directors make any recommendation as to the matters set out in the presentation. Prospective lenders interested in investing in the Borrower are recommended to seek their own
independent legal, tax and/or financial investment advice from a competent financial advisor. The whole of the presentation should be read. Reliance on this presentation for the purposes of engaging
in any investment in the Borrower may expose an individual to a significant risk of losing the entire investment and may not be suitable for all recipients.
EARNINGS CALL PRESENTATION - Q1 2021 - IUTECREDIT EUROPE
Presenting
Experienced in Banking and Finance with strong self-made entrepreneurial track record

                        Tarmo Sild                                                                              Kristel Kurvits
                        Chief Executive Officer                                                                 Chief Financial Officer

 ▪ Co-founder of IuteCredit
                                                                                      ▪ Kristel has been with IuteCredit since 2017
 ▪ After graduating high school with gold medal in 1994, tossed the coin, whether
   to study economics or law. Tarmo holds a Master’s degree with distinction in       ▪ Kristel holds a Master’s degree in Financial Management from Estonian Business
   Law from Vrije Universiteit Brussels                                                 School

 ▪ Tarmo started his professional career as attorney in 1999 and was founding         ▪ Since 2000 and onwards she served as Chief Financial Officer for MTÜ Estonian
   partner and manager of LEXTAL Law Firm until 2010                                    Banking Association

 ▪ Co-founded IuteCredit with Allar Niinepuu in 2008, after a late-night discussion   ▪ Prior to her recent engagements, Kristel was responsible amongst others for
   with an inspirational Estonian banker                                                accounting of Ektornet Land Estonia OÜ (part of Swedbank Group) and financial
                                                                                        reporting of the group companies

                                                                                      ▪ Kristel started her professional career at Hansa Leasing Inkasso OÜ (part of
                                                                                        Hansapanga Group)

                                                                                                                                                               1.   3
EARNINGS CALL PRESENTATION - Q1 2021 - IUTECREDIT EUROPE
IuteCredit Group Highlights
Drive for growth is stronger than third-wave headwinds

Number of customers*                        Net loan portfolio        • Loan payouts increased y-o-y despite missing internal growth targets, the third
                                                                         pandemic wave limited loan demand in January and February
            695,000+                                 € 80.8m
                                                                      • Shifting towards longer loan maturities with growing share of repeating customers
            +115,000 (Q1/20)                         + 2.0% (FY/20)
                                                                         drove CPI above pre-pandemic level

                                                                      • Continued investment into digitalization paving the way for upcoming

Total income                                EBITDA                       breakthrough of online shopping in Iute`s operating countries
                                                                              o Evolution of MyIute App in Albania enables online signing of the loan
           € 13.9m                                   4.9m                        agreements
           - 11% (Q1/20)                             - 10% (Q1/20)
                                                                              o Successful implementation of ATMs in Moldova; More than 25% of the
                                                                                 loans issued via Iute´s own ATM network
                                                                      • Growth in net loan portfolio and total balance sheet, ruling over third pandemic

Customer Performance                        NPLs in net portfolio        wave

Index (CPI 30)

            87.9%                                    13.1%
            84.7% (Q1/20)                            16.6% (FY/20)

* Excluding number of customers in Kosovo

                                                                                                                                                    1.     4
EARNINGS CALL PRESENTATION - Q1 2021 - IUTECREDIT EUROPE
Operational Footprint
Geographical diversification

              Bosnia and Herzegovina                                                                           Moldova
              ▪    Launch: May 2019                                                ▪   Launch: August 2008
              ▪    Loans issued Q1 2021: EUR 1.5m                                  ▪   Loans issued Q1 2021: EUR 12.3m
              ▪    Net loan portfolio Q1 2021: EUR 3.1m                            ▪   Net loan portfolio Q1 2021: EUR 34.2m
              ▪    Total income Q1 2021: EUR 0.4m                                  ▪   Total income Q1 2021: EUR 4.9m
              ▪    EBITDA Q1 2021: EUR -0.5m                                       ▪   EBITDA Q1 2021: EUR 1.0m
              ▪    Impairments Q1 2021: EUR 0.4m                                   ▪   Impairments Q1 2021: EUR 2.2m

                     Albania
                      ▪   Launch: April 2015
                      ▪   Loans issued Q1 2021: EUR 12.4m
                      ▪   Net loan portfolio Q1 2021: EUR 30.8m
                      ▪   Total income Q1 2021 : EUR 4.1m         North Macedonia
                      ▪   EBITDA Q1 2021: EUR 2.1m                ▪   Launch: September 2017
                      ▪   Impairments Q1 2021: EUR 0.9m           ▪   Loans issued Q1 2021: EUR 6.5m
                                                                  ▪   Net loan portfolio Q1 2021: EUR 12.7m
                                                                  ▪   Total income Q1 2021: EUR 1.3m
                                                                  ▪   EBITDA Q1 2021: EUR 0.7m
                                                                  ▪   Impairments Q1 2021 : EUR 0.6m

  Share of loans issued for Q1 2021
                                                                                                                               1.   5
EARNINGS CALL PRESENTATION - Q1 2021 - IUTECREDIT EUROPE
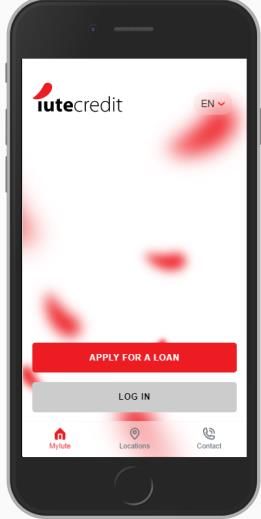
Operating Highlights
Shift towards longer maturing portfolio
Generating longer-term income                                                                             ▪ Loan pricing (APRs) continues to decrease along with the growth of repeating
EURm                                                                                                         customers share, thus improving loan portfolio risk profile
   18

         15.7                                                                              50

                                                                13.7            13.9                      ▪ Total income down by 11.3% to EUR 13.9m (Q1 2020: EUR 15.7m) affected, by
                                                                                           45

                                                 13.4
   16

   14
                            13.2                                                           40

         59.6%
                                                                                                             lower APRs, longer loan maturities, regulatory change in Moldova and lower loan
                                                                                           35

   12

                                                                58.0%
                                                                                57.3%
                                                                                           30

   10
                            56.2%
                                                 52.3%                                     25

    8

                 17.7                                                                      20
                                                                                                             base caused by contraction of portfolio during first wave of pandemic
    6
                                                                                    17.9
                                                         17.4           17.5
                                                                                           15

    4
                                   14.7                                                    10

    2
                                                                                           5              ▪ Discontinued interest accruals on loan termination date set by Moldovan
    0                                                                                      0

        Q1 2020           Q2 2020           Q3 2020     Q4 2020                Q1 2021
                                                                                                             legislation; decrease of total income by EUR 0.8m in Q1 2021
                        Total income           Maturity   %   APR
                                                                                                          ▪ Still relatively high cash position of EUR 15.5m in Q1 2021 mostly due to the
                                                                                                             below expected loan issuances, excellent customer repayment behavior and
Growth of issued loan (y-o-y vs q-o-q)
                                                                                                             examination for a strategic acquisition
                                                                                           2.8 %
                                                                                 31.7              32.6
                                                                                                          ▪ Operations in Bulgaria are well on track as the first cash loan have been issued;
 12.6                      11.6                                  11.8
            10.3                          10.5                                                               full launch expected in Q2 2021
                                                         7.5

Jan 2020 Jan 2021 Feb 2020 Feb 2021 Mar 2020 Mar 2021                           Q1 2020         Q1 2021

                                                                                                                                                                                         1.     6
EARNINGS CALL PRESENTATION - Q1 2021 - IUTECREDIT EUROPE
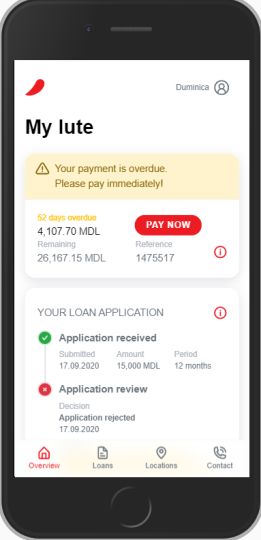
Loan Repayment Behaviour & Net Loan Portfolio
  Evolution of Customer Performance Index (CPI 30)                                         Net loan portfolio diversification
                                                                                           2015: EUR 5.1m               2018: EUR 48.1m                 Mar 2021: EUR 80.8m
                                                                                                                                                                 3.8%
90%
85%                                                                                                                  5.4%     6.5%
                                                                                             10.0%                                                       15.7%
80%
75%
70%                                                                                                                                                                       42.3%
65%                                                                                                                   33.2%           54.9%
                                                                                                 90.0%
60%
55%
                                                                                                                                                         38.2%
50%
         2016     2017     2018     2019     2020   Q1 2021      Q1 Q2 Q3 Q4 Q1
                                                                2020 2020 2020 2020 2021             Moldova                Albania           North Macedonia
                         CPI 30
                                                                                                     Kosovo                 Bosnia and Herzegovina

      ▪ CPI 30 as indicator of customers’ actual duly repayments against the expected      ▪ Diversifying risk with more balanced geographical distribution
        payments, was moderately affected by COVID-19 public lockdowns since Mid-          ▪ After the launch in 2017, the North Macedonian market continues to mature and
        March 2020                                                                            grow its share in total net loan portfolio
      ▪ CPI 30 has improved steadily in Q3 2020 to 84.6%, in Q4 2020 to 86.7% and in       ▪ During 2020, planned contraction of net loan portfolio in Q2 was offset by
        Q1 2021 to 87.9% (H1 2020: 82.9%)                                                     portfolio growth in Q3 and Q4 thus reaching EUR 79.2m
      ▪ Customer repayment behavior remained at very high level and has further
                                                                                           ▪ Net loan portfolio grew 2% to EUR 80.8m during Q1 2020 achieving the growth
        grown during the second and the third wave of the pandemic
                                                                                              during January and March
      ▪ CPI 30 has fully recovered and is above pre-pandemic levels

                                                                                                                                                                           1.     7
EARNINGS CALL PRESENTATION - Q1 2021 - IUTECREDIT EUROPE
Financial Highlights
Impact of the third wave and investments into digitalization

Adjusted EBITDA                                                                            • EBITDA decreased by 9.7% to EUR 4.9m (Q1 2020: EUR 5.4m) mostly due to lower
EURm                                                                                          interest income cause by lower APR´s and as well as continued investments into
       7.6                                                                                    digitization
                           5.7
       2.2                                  5.2          5.1                               • Net loan portfolio up 2.0% to EUR 80.8m (2020: EUR 79.2m) mostly due to limited
              2.3                 0.4
                                                0.7            0.2
              -1.3
                                                                                              loan demand for shop loans caused by the lockdown in January and February
       5.4                  5.4                          4.9
              3.6                               4.5

                                                                                           • Stable capitalization ratios of 27.2% (Q1 2020: 27.1%) and interest coverage ratio
   Q1 2020    Q2 2020    Q3 2020           Q4 2020     Q1 2021
                                                                                              of 1.6 times well above Eurobond covenant level
                         EBITDA          FX Adjustment

                                                                                           • Forex exchange movements resulted in a loss of EUR 0.2m in Q1 2021 (Q1 2020:
Net loan portfolio back to growth                          Net income                         EUR 2.2m)
EURm                                                       EURm
                                                                                           • Satisfying level of profitability archived with net profit of EUR 1.1m (Q1 2020: EUR
                                         80.8
             80.2        80.2                                        1.5   -27.5 %            1.5m) despite lower APR´s, higher interest-bearing liabilities and investments into
    79.2
                                                                                     1.1      digitalization

   Dez 20    Jan 21     Feb 21          Mar 21                   Q1 2020       Q1 2021

                                                                                                                                                                           1.   8
Financial Ratios
      Income & EBITDA in EURm                                              Net profit in EURm & Net profit margin                                                                 Capitalization ratio
                              56.0                                            9.0                     8.4
               50.8                                                           8.0
                                                                                          7.3
                                                                                                                                                             35%

                                                                              7.0                                                                            30%

                                                                                                                                                                        26.4%             27.1%   27.1%             27.2%
32.4
                                                                              6.0
                                                                                                                    5.2                                      25%
                                                                                                                                                                                  23.4%
                                       1)
                                                                              22%
                                                                              5.0

                         1)                                                                                                                                  20%

                   20.2          20.9
                                                                              4.0

                                             15.7                                                           17%                                                                                                                15%
                                                            13.9              3.0

      12.9
                                                                                                                                                             15%

                                                     1)                                                                          1.5
                                                 7.6                 1)
                                                                              2.0

                                                                                                                          9%           9%         1.1
                                                               5.1                                                                                           10%

                                                                                                                                                        8%
                                                                              1.0

                                                                              0.0                                                                            5%

2018            2019          2020           Q1 2020      Q1 2021                     2018         2019            2020        Q1 2020       Q1 2022                    2018       2019   2020    Q1 2020      Q1 2021
                      Income            EBITDA

               Cost to income ratio                                                                   Leverage ratio                                                            Interest coverage ratio
                                                                   38.5%
                                            2)
                                     32.4%                                                                                                                         1)    3.3
                      30.7%                                                                                                                  1)         4.8                                               1)
       28.8%                                        28.5%                                                                                                                                           2.8
                                                                                                             3.8                       4.1
                                                                                                                           3.5                                                     2.2
                                                                                    2.8         2.8                                                                                        1.9
                                                                                                                                                                                                                      1.6 1)
                                                                                                                                                                                                                               1.5x

       2018           2019           2020        Q1 2020       Q1 2021              2017        2018         2019         2020     Q1 2020 Q1 2021                      2018       2019   2020    Q1 2020           Q1 2021

 1)     Adjusted for FX gains/losses
 2)     Adjusted for one-time Kosovo expenses
                                                                                                                                                                                                               1.      9
Non-performing loans
Gross and net NPL (50+ DPD) portfolio                                                    Net loan portfolio quality analysis, Q1 2021
30%
25%
                                                                                                       2%
20%                                                                                                             13%
15%                                                                                                                                        Stage 1: Current - 30 days overdue
10%
5%                                                                                                                                         Stage 2: 31 - 50 days overdue
0%

                                                                                                                      84%                  Stage 3: 50+ days overdue (NPL)

                  Gross NPLs / Gross portfolio         Net NPLs / Net portfolio

▪ Rise in both Gross and Net NPLs during Q2 and Q3 2020 caused to the adverse
                                                                                         ▪ Conservative internal NPL definition: Loans 50+ DPD recognized as non-performing
   impact of COVID-19 yet consistent prudent underwriting standard
                                                                                           loans (NPLs); in 2016 and 2017 NPLs have been defined as 70+ DPD, in 2015 and
▪ Decline of Gross and Net NPLs in Q1 2021 caused by writing off EUR 2.0m of               earlier as 90+ DPD
   sold loans in Albania plus monthly write-offs, as well as the increase of portfolio
                                                                                         ▪ IuteCredit has always followed the ECL methodology prescribed by IFRS 9
   quality as more loans have been issued to better quality customers
                                                                                         ▪ IuteCredit creates and accounts for provisions simultaneously when loans are
▪ Provision coverage (Total provisions/Gross NPL) ratio of 70.5% reflecting
                                                                                           being issued
   improved portfolio quality as well as conservative NPL definition

                                                                                                                                                                      1.     10
Assets & Liabilities
Assets in EURm                                                                                                      Liabilities in EURm                                                   Liability maturities in EURm
as of 31.03.2021                                                                                                    as of 31.03.2021                                                      as of 31.03.2021
                                                                            116.6                118.9                                                                                                         44.6   1.3

                                                                                                                                                             Cash
                                                      106.3                                                                                                                        15.5
                                                                                                                                   49.3

                                                                                                                                                              Net loan portfolio
                                  55.3                                                                                                                                                                  18.0
                                                                                                                               Net interest                                        80.8
                                                                                                                             bearing liabilities                                            27.5
            23.0                                                                                                               EUR 78.4m
                                                                                                                      11.3

                                                                                                                                          33.2
            2017                 2018                  2019                 2020                Q12021

                                       2017               2018               2019               2020      Q1 2021     Loans and leasing            Bonds   P2P

 Capitalization ratio                23.0%              26.4%              23.4%              27.1%        27.2%

 ▪ 81% of total assets consist of net loan portfolio as well as cash and liquid assets                               ▪ Total liabilities increased by EUR 1.7m to EUR 96.9m (2020: EUR 95.1m)

 ▪ Simple and clearly-structured balance sheet                                                                       ▪ As of 31.03.2021, loans and borrowings amounted to EUR 93.8m (2020: EUR
                                                                                                                       91.4m), accounting for 96.9% of all liabilities (2020: 96.1%)
 ▪ Stable and healthy capitalization
                                                                                                                     ▪ Due to the high cash position of EUR 15.5m, net interest-bearing debt
                                                                                                                       amounted to EUR 78.4m as of 31.03.2021

Note: Net interest-bearing liabilities: Total interest-bearing liabilities minus cash and liquid assets
                                                                                                                                                                                                                      1.    11
Summary & Outlook
Q1 bellow the expectations – however optimistically looking forward under the “new normal”

Summary
• Although internal growth targets have been missed IuteCredit has succeeded in achieving growth despite third wave hitting full force

• Continued decrease of APRs as shifting toward longer loan maturities provides long term income stream and better portfolio quality

• Cash remains to be king for IuteCredit, focus stays on improving customer, merchant and banking experience through do-it-yourself solutions through smartphones

• Despite less reliable predictions of consumer market demand, IuteCredit continues to provide steady loans supplies in case of potential new virus waves

Outlook
• IuteCredit intends to integrate into the consumption and transaction streams, acting as an instant credit provider, payment service provider and possibly a bank

• Profitable ATM-roll-out continuing – start in Albania and Macedonia as of Q2. Growth of the business in Bulgaria

• On the balance sheet side, IuteCredit expects total assets to increase to EUR 170m by the end of 2021. Additionally, total income is expected to exceed EUR 55m whereas
  net profit should be at least EUR 6m

                                                                                                                                                                     1.   12
Appendix
Corporate Social Responsibility
IuteCredit - Responsible and socially inclusive lender

▪ Markets: Most of Iute´s markets are characterized as small developing            ▪ Increasing number of repeating customers as a proof of IuteCredit´s satisfied
   countries and are not in focus of the international actors                         customer´s experience

▪ Affordability: Longer tenors allow customers to limit the monthly cash flow      ▪ Continuous investment into technology enabling improvement of customer
   burden oppose the offer from pay day lenders                                       experience and credit underwriting

▪ Larger tickets: Customers can meet their requirements without having to tap      ▪ By financing local events, environment and education, IuteCredit has positioned
   into multiple pay day lenders                                                      itself as an active stakeholder in the social life of the countries

▪ Equitable and smart risk scoring: 360° risk profile based on alternative data-
   sources and advanced analytics

▪ Transparency: Clear pricing, moderate APRs and no hidden costs

▪ Speed: Quick decisions so customers have access to credit in a timely manner
   to live a life, without wasting time
MyIute App
Digitalization: Improving sales and service capabilities

                                                                                             Launched in Moldova and Albania
             Easy on-boarding and quick loan application process

                                One-stop-shop - easy loans application, check
                                application/loan status and repay loans

                                        Full fledge self-service functionality to existing
                                        customers - customers can do all on their own
                                        without leaving the comfort of their homes
  Launch Features                             New customers can apply for the loan

                                       Availability of preapproved loans for return
                                       customers – approvals in matter of seconds and
                                       access to cash in minutes

                            Flexibility of choosing from offers and promotions and apply

              Further development of the platform leading to improved sales
              opportunities: additional features to be added - online signing of
              the loan agreements as well as online check-outs for e-shoppers

                                                                                                                               1.   15
Cardless ATM Machines
investment into infrastructure to expand payout capabilities

                                                               ▪ IuteCredit is establishing its own ATM network by acquiring secondhand ATM´s
                                                                  from the banks

                                                               ▪ The service is available in Moldova since the end of October 2020 – roll out to
                                                                  Albania and North Macedonia will follow in Q2 2021

                                                               ▪ By investing into cash-infrastructure, IuteCredit is expanding its payout
                                                                  capabilities, and can offer better and quicker service to its customers

                                                               ▪ Convenience; customers can withdraw money without going to the post office

                                                               ▪ Withdrawal possible by using one-time password - no need of credit or debit cards

                                                                                                                                             1.    16
Legal structure
                                                                         Tarmo Sild                                     Allar Niinepuu

                                                                                    50%                               50%

                                                                                              Alarmo Kapital OÜ

                                                                                                      90%                                Management team
                                                                                                                                                &
                                                                                                                                            Investors
                                        IuteCredit Finance SA                        100%                             10%
                                                                                             IuteCredit Europe A.S.
                                   (under the laws of Luxembourg)

        100%                             100%                                 100%                   100%                 100%                 100%               100%

                                                                                                                      IuteCredit North                       IuteCredit Bosnia
  IuteCredit Moldova               IuteCredit Kosovo                    IuteCredit Albania     IuteCredit Bulgaria                        IutePay Bulgaria
                                                                                                                         Macedonia                           and Herzegovina
         ICM                             ICKO                                  ICA                    ICBG                                    IutePay
                                                                                                                           ICMK                                    ICBIH

              Note: Kosovo is currently not part of the consolidation
                                                                                                                                                                                 1.   17
Income Statement
                                          in EURm     2018       2019      2020     Q1 2020     Q1 2021
                                                      22.6       47.0      44.5        12.9        10.7
Interest and commission fee income                   (69.8%)    (92.5%)   (79.4%)     (82,4%)     (76,8%)
                                                        9.4        3.5       8.4         2.2         2.4
Loan administration fees and penalties               (29.1%)     (6.9%)   (15.0%)     (13,8%)     (17,1%)
                                                        0.3        0.3       3.1         0.6         0.9
Other income                                          (1.1%)     (0.5%)    (5.6%)      (3.8%)      (6,1%)
                                                      33.4       50.8      56.0        15.7        14.0
Total Income                                        (100.0%)   (100.0%)   (100%)      (100%)      (100%)
                                                      (3.9)      (9.0)    (11.0)       (2.8)       (3.2)
Interest expense                                     (11.9%)    (17.7%)   (19.6%)     (17.6%)     (23,0%)
                                                     (10.4)     (11.0)    (18.8)       (4.0)       (4.1)
Allowances for loan impairment                       (32.0%)    (21.5%)   (33.5%)     (25.4%)     (29,3%)
                                                      18.2       30.9      26.3          8.9         6.7
Net operating income                                 (56.1%)    (60.8%)   (46.9%)     (57.0%)     (47,7%)
                                                      (3.9)      (6.3)     (8.1)       (2.2)       (2.3)
Salaries and other personnel expenses                (12.0%)    (12.4%)   (14.4%)     (13.9%)     (16,7%)
                                                      (5.2)     (14.2)     (8.3)       (1.9)       (2.4)
Other operating expenses                             (16.1%)    (28.0%)   (14.8%)     (12.0%)     (17,4%)
                                                      (0.2)      (1.2)     (1.7)       (0.4)       (0.6)
Depreciation/amortization charge                      (0.7%)     (2.4%)    (3.1%)      (2.6%)      (4,4%)

                                                           -       1,0          -           -           -
Financial assets measured at fair value                          (1.9%)
                                                        0.7        0.4     (2.0)       (2.2)       (0.2)
Foreign exchange gains/losses                         (2.0%)     (0.7%)    (3.5%)     (14.0%)      (1,3%)
                                                        9.5      10.5        6.2         2.3         1.1
Profit or loss before taxes                          (29.3%)    (20.6%)   (11.0%)     (14.4%)     (7,9%)
                                                      (2.2)      (2.1)     (0.9)       (0.8)       (0.0)
Income tax                                            (6.9%)     (4.1%)    (1.7%)      (5.0%)     (0,2%)
                                                        7.3        8.4       5.2         1.5         1.1
Net profit for the year/period                       (22.4%)    (16.5%)    (9.4%)      (9.4%)      (7,7%)
                                                        0.5      (0.3)     (1.8)         1.0       (0.0)
Other comprehensive income                            (1.6%)     (0.6%)    (3.1%)      (6.4%)     (0,4%)
                                                        7.8        8.1       3.5         2.5         1.0
Total comprehensive income for the year/period       (24.0%)    (15.9%)    (6.2%)     (15.8%)     (7,3%)

                                                                                                            1.   18
Balance Sheet
                                in EURm   2018    2019    2020     Q1 2021

Assets
Cash and bank accounts                      2.6     6.7     19.5       15.5
Loans to customers                         48.1    79.0     79.2       80.8
Prepayments                                 0.3     0.9      1.3        2.1
Other assets                                1.7     2.5      2.7        3.1
Other financial investments                 1.5     9.9      7.2        9.5
Property, plant and equipment               0.5     1.0     1.0        1.0
Right-of-use assets                           -     2.9     2.1        2.2
Intangible assets                           0.7     3.3     3.7        4.8
Total assets                               55.3   106.3   116.6      118.9

Liabilities and equity
Liabilities
Loans and borrowings                       39.2    84.1    91.4        93.8
All other liabilities                       3.4     3.7     3.7         3.0
Total liabilities                          42.6    87.7    95.1        96.8

Equity
Share capital                              10.0    10.0     10.0        10.0
Legal reserve                               0.0     0.4      0.5         0.5
Unrealized foreign exchange differences     0.4     0.1    (1.7)       (1.7)
Retained earnings                           2.3     8.0    12.6        13.2
Total equity                               12.7    18.5    21.5       22.0
Total equity and liabilities               55.3   106.3   116.6      118.9

                                                                               1.   19
Statement of Cash Flow
                                 in EURm      2018     2019     2020       Q1 2020       Q1 2021                                              in EURm   2018     2019       2020       Q1 2020            Q1 2021
Operating activities
                                                                                                       Financing activities
 Prepayments to partners for issuance of
                                               (6.3)   (11.3)   (11.4)         (3.0)         (4.0)
 loans                                                                                                                                                   26.1     85.0       51.4          17.9                  9.5
 Received pre- and overpayments from                                                                    Loans received from investors
                                                9.3     12.8     36.2          11.8           8.7
 customers                                                                                              Repaid loans to investors                       (10.8)   (48.5)     (42.3)        (11.9)             (10.4)
 Paid trade payables                           (5.9)   (10.7)   (12.3)         (2.8)         (4.4)
 Received debts from buyers and received                                                                Change in overdraft                               2.0      4.2       (5.2)         (5.2)                    -
                                                0.0      0.8      0.9           0.1           0.1
 other claims
                                                                                                        Principal payments of lease contracts                -    (0.9)      (0.9)         (0.4)              (0.2)
 Received from collection companies              7.4    13.0     22.6            5.3           5.6
 Paid net salaries                             (2.3)    (4.5)    (5.3)         (1.9)         (1.6)                                                       (3.7)    (5.2)      (8.0)         (3.2)              (4.0)
                                                                                                        Paid interests
 Paid tax liabilties, exc. CIT                 (1.5)    (2.9)    (3.0)         (0.7)         (1.3)
                                                                                                        Paid dividends                                   (2.0)    (2.2)       0.5          (0.5)              (0.5)
 Corporate income tax paid (CIT)               (1.4)    (3.3)    (1.9)         (0.3)         (0.5)
 Paid out to customers                        (39.3)   (76.2)   (47.4)        (14.6)       (15.6))                                                        3.2           -          -             -                  -
                                                                                                        Capital increase
 Paid out loans to customers related to MC         -    (0.1)        -         (0.0)             -
 Change in MasterCard (MC) settlement                                                                   Grants received                                      -     0.0             -             -                  -
                                                   -    (1.4)    (8.2)         (0.8)         (3.6)
 account
                                                                                                        Payments for other financing activities              -          -    (0.0)         (0.0)                    -
 Principal repayments from customers           20.4     40.3     29.4           8.2           7.7
 Loan principal repayments from                                                                                                                              -          -     0.0          (0.0)                    -
                                                   -     0.5      4.5           0.7           2.4       Receipts from other financing activities
 customers related to MC
 Interest, commission and other fees             8.8     17.4    15.0           3.6            4.5                                                       14.9     32.4       (5.4)         (3.3)              (5.5)
                                                                                                       Net cash flows from financing activities
 Net cash flows from operating activities     (10.7)   (25.6)    18.9           5.6          (2.0)

Investing activities                                                                                   Cash and cash equivalents at the beginning of
                                               (0.8)                                                                                                      1.8      2.6        6.7           6.7               19.5
  Purchase of fixed assets                              (0.8)     0.5          (0.1)         (0.1)     the period
  Net cash flow from acquisition of
                                               (1.1)    (0.2)          -             -             -                                                      0.9      4.0       13.2           2.2               (4.0)
  subsidiaries                                                                                          Change in cash and cash equivalents
  Received from the sale of subsidiaries           -      0.2        -             -             -                                                       (0.0)     0.0       (0.5)         (0.1)              (0.0)
  Payments for other financial investments     (1.5)    (1.8)    (7.3)         (0.0)         (0.2)      Net foreign exchange difference
  Receipts from other financial investments      0.0        -      6.5             -           3.7     Cash and cash equivalents at the end of the
                                                                                                                                                          2.6      6.7       19.5           8.8               15.5
                                               (3.3)                                                   period
Net cash flows from investing activities                (2.7)    (0.3)         (0.1)           3.5

                                                                                                                                                                                                     1.     20
Thank you for your attention!
IuteCredit Group
Maakri 19/21                               Contact person:
EST-10145 Tallinn, Estonia                 Tarmo Sild, Group CEO
www.iutecredit.com                         Phone: +372 62 29 177
                                           tarmo.sild@iutecredit.com

Aalto Capital Group (Investor Relations)
Bahnhofstr. 98                             Contact person:
D-82166 Graefelfing / Munich, Germany      Sven Pauly, Consultant
www.aaltocapital.com                       Phone: +49 89 89 86 777 0
                                           sven.pauly@aaltocapital.com

                                                                         1.   21
You can also read