Earnings Presentation Material - Q1 FY12/2019 August 2019 J Trust Co., Ltd.
←
→
Page content transcription
If your browser does not render page correctly, please read the page content below
Q1 FY12/2019

Earnings Presentation Material

          August 2019
         J Trust Co., Ltd.

                      Copyright(C)2019 JTRUST Co.,Ltd. All Rights Reserved.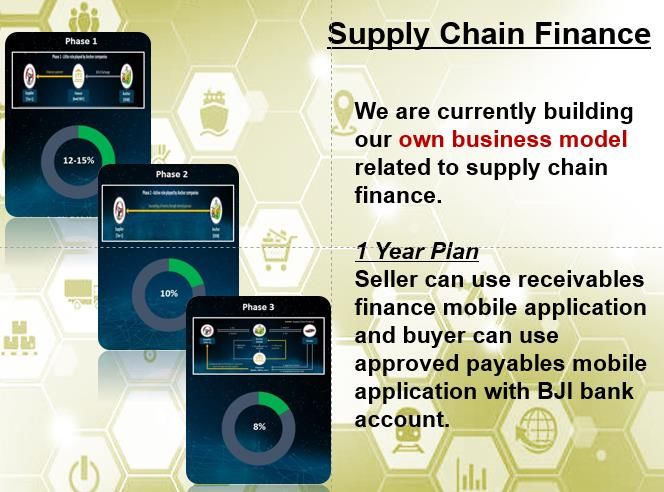
Table of Contents

    FY12/2019

    1. Summary of Consolidated Results in Q1
       FY12/2019

    2. Q1 Results by Segment

    3. Results Forecast and Status of Progress

    4. Future Outlook by Segment

                                                 1
Disclaimer

  •   In conjunction with the change in the accounting period, the current period will be nine months from
      April 2019 to December 2019.

  •   J Trust has classified the results of Highlights Entertainment, which it sold in FY03/2019, as discontinued
      operations and has similarly classified “operating revenue”, “operating profit” and “profit before tax” as
      such in year-on-year (“YOY”) comparisons.

  •   Information regarding forecasts listed in this document is estimated based on the knowledge, opinions
      and judgement of the company at the time of the document’s creation and contains underlying risks and
      uncertainties. Therefore, please understand that actual results and the forecast described here are
      subject to change greatly depending upon various factors such as the business environment.

  •   This document is intended to provide information about J Trust and is not intended to solicit investments
      in securities issued by the company.

  •   As a principle, the units listed on each page have been rounded down to the nearest unit of display. In
      addition, differences listed next to the charts and graphs illustrating YOY comparisons are calculated
      using the display unit of billions.

  •   This English-translated document was prepared solely for the convenience of English-speaking investors.
      If any discrepancies exist between this translation and the original Japanese document, the Japanese
      version always prevails. The Company shall not be liable for any damages or losses of profit arising from
      this translation.

                                                                                                                    2
1.Summary of Consolidated Results

   Deputy General Manager of Finance
              Department
           Keiichi Shimamura

                                       3
Summary of Consolidated Results
Financial Business in Japan
Financial Business in South Korea and Mongolia
These two segments drove consolidated
results.
4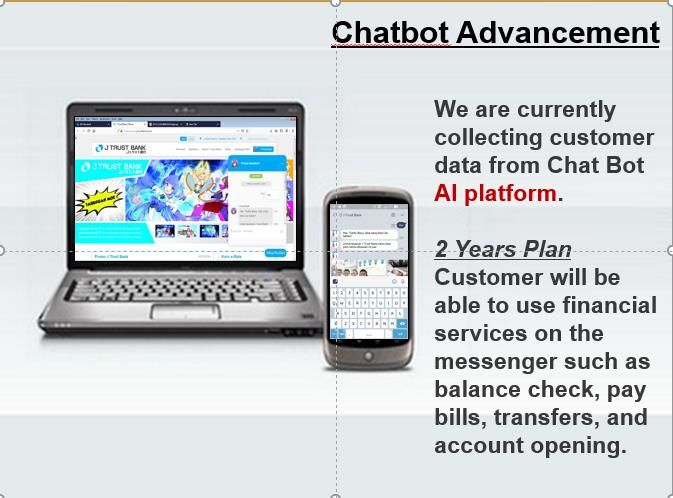
Year-on-year, revenue increased while profit decreased.
Consolidated Results (YOY)
Q1 FY03/2019 Q1 FY12/2019
(2018/4/1~2018/6/30) (2019/4/1~2019/6/30)
Difference
17.3 billion 18.2 billion +0.9 billion
Operating Revenue
※
JPY JPY JPY
-0.4 billion
Operating Profit
※
0.8 billion JPY 0.4 billion JPY
JPY
-1.8 billion
Profit before tax
※
1.9 billion JPY 0.1 billion JPY
JPY
Profit attributable to
‐0.1 billion -1.5 billion
owners of parent 1.4 billion JPY
JPY JPY
※ Operating revenue, operating profit and profit before tax do not include amounts resulting
from discontinued operations. 5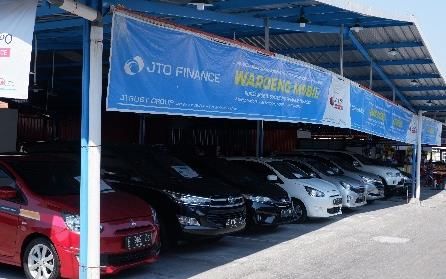
Revenue increased due to M&A in General Entertainment Business.
Operating Revenue by Segment (YOY)
Q1 FY03/2019 Q1 FY12/2019 Difference
(2018/4/1~2018/6/30) (2019/4/1~2019/6/30)
Financial Business in Japan 2.3 billion JPY 2.3 billion JPY -0.0 billion JPY
Financial Business in South
10.1 billion JPY 9.7 billion JPY -0.4 billion JPY
Korea and Mongolia
Financial Business in
3.1 billion JPY 2.7 billion JPY -0.4 billion JPY
Southeast Asia
Investment Business 0.2 billion JPY 0.2 billion JPY -0.0 billion JPY
Non-Financial Business 1.2 billion JPY 3.0 billion JPY +1.8 billion JPY
Other operations 0.2 billion JPY 0.1 billion JPY -0.1 billion JPY
Consolidated Operating
17.3 billion JPY 18.2 billion JPY +0.9 billion JPY
Revenue
Figures shown do not include amounts from discontinued operations.
6
Financial Business in South Korea and Mongolia made up for results of
Financial Business in Southeast Asia.
Operating Profit by Segment (YOY)
Q1 FY03/2019 Q1 FY12/2019
(2018/4/1~2018/6/30) (2019/4/1~2019/6/30)
Difference
Financial Business in Japan 0.9 billion JPY 1.0 billion JPY +0.1 billion JPY
Financial Business in South
1.4 billion JPY 2.5 billion JPY +1.1 billion JPY
Korea and Mongolia
Financial Business in
-0.7 billion JPY -1.8 billion JPY -1.1 billion JPY
Southeast Asia
Investment Business 0.1 billion JPY -0.5 billion JPY -0.6 billion JPY
Non-Financial Business -0.0 billion JPY 0.0 billion JPY 0.0 billion JPY
Other operations -0.0 billion JPY -0.1 billion JPY -0.1 billion JPY
(Adjustments, etc.) -1.0 billion JPY -0.6 billion JPY +0.4 billion JPY
Consolidated Operating
0.8 billion JPY 0.4 billion JPY -0.4 billion JPY
Profit
Figures shown do not include amounts from discontinued operations.
7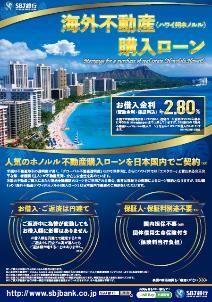
2.Results by Segment
2-1.Financial Business in Japan

                                  8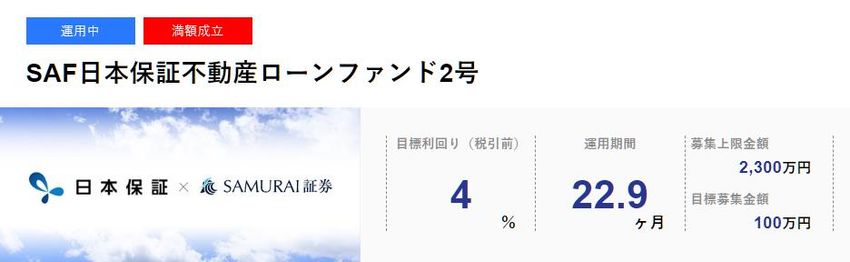
J Trust maintained a steady operating revenue.
Collections on receivables purchased in Q4 of FY03/2019
also contributed to operating profit.
Operating Revenue Operating Profit
2.3 2.3 Unit: Billions of yen
1.0
0.9
1Q FY03/2019 1Q FY12/2019 1Q FY03/2019 1Q FY12/2019
9 Net increases in guarantee balance totaled 6.0 billion yen.
Unit: Billions of yen
Guarantee balance
Light color=Condominium loan guarantees
Dark color = Other guarantees
208.9
159.7
157.7
85.9 116.5
47.2
43.2 51.2
38.7
2017/ 2018/ 2019/
03 06 09 12 03 06 09 12 03 06
10 Purchases of NPLs continued to be successful.
Unit: Billions of yen
Balance of claimed receivables in servicer business
Total:
900+ billion
Approx. Approx. Approx.
Off-balance
Approx. 150 150
Approx. 140 (claimable) receivables
Approx. 140 at Nihon Hoshou
110 acquired from
110
Takefuji Corporation
730.6 759.2 772.3 783.3 782.8 787.4 Balance of
claimed receivables
handled by
Partir Servicer
2017/ 2018/ 2019/
03 09 03 09 03 06
Balance includes both purchased and claimed receivables.
Balance includes some on-balance receivables. 11 Leases and credit receivables make up more than half of Partir Servicer’s receivables
collections.
Demonstrating its unique aptitude for collections, Partir continued to purchase and
collect those types of receivables.
Breakdown of receivables handled by servicers
Overall Industry Partir Servicer
Securitized Indemnities, Securitized
claims etc. claims
0.01% 7.65% 0.00%
Indemnities,
Receivables etc.
related to… 15.93%
Receivables
Bank loans
related to
29.27%
bankruptcy
Lease and credit- 0.17%
related
Bank loans
33.76%
58.31% Lease and credit-
related
54.63%
※ Industry data (as of December 31st, 2018) is taken from the Ministry of Law.
※ Partir Servicer data was sampled on June 30th, 2019. 122.Results by Segment
2-2.Financial Business in
South Korea and Mongolia
13 Operating revenue decreased due to a decrease in average loan interest rates.
Operating profit increased due to a decrease in reserves against potential
loan losses and gains booked from the sale of NPLs.
Unit: Billions of yen
Operating Revenue Operating Profit
10.1
9.7
2.5
1.4
1Q FY03/2019 1Q FY12/2019 1Q FY03/2019 1Q FY12/2019
14 J Trust worked toward accumulating stable assets while
focusing on the level of asset “quality”.
Loan balance and balance of loans delinquent over 90 days at
JT Savings Bank, JT Chinae Savings Bank and JT Capital
Unit: Billions of yen
400 Secured corporate loans 20.00%
Unsecured corporate loans 340.3 18.00%
350 324.1
Secured consumer loans 16.00%
300
Unsecured consumer loans 102.1
86.9 14.00%
250
12.00%
13.3 13.8
200 10.00%
90.4
103.1
8.00%
150
5.0% 6.00%
100 3.9%
4.00%
120.7 134.0
50
2.00%
0 0.00%
2016/ 2017/ 2018/ 2019/
03 06 09 12 03 06 09 12 03 06 09 12 03 06
Combined total of JT Chinae Savings Bank, JT Savings Bank and JT Capital
Figures are displayed in local currency and multiplied by the following rate:
1 KRW=0.0933 JPY(Closing rate as of June 30th 2019)
15 Purchases of receivables in the servicer business also went well.
単位:億円
Unit: Billions of yen
Balance of receivables at TA Asset Management
29.8
23.3
17.7
2017/ 2018/ 2019/
03 06 09 12 03 06 09 12 03 06
Figures are displayed by multiplying local currency with the following rate:
1 KRW=0.0933 JPY (Closing rate as of June 30th)
162.Results by Segment
2-3.Financial Business in Southeast Asia
17 Year-on-year, revenue and profit decreased.
Operating Revenue Operating Profit
Unit: Billions of yen
3.1
2.7
-0.7
-1.8
1Q FY03/2019 1Q FY12/2019 1Q FY03/2019 1Q FY12/2019
182.Results by Segment
2-4.Investment Business
19 SG&A expenses increased due to an increase in litigation fees.
Unit: Billions of yen
Operating Revenue Operating Profit
0.2 0.2
0.1
-0.5
1Q FY03/2019 1Q FY12/2019 1Q FY03/2019 1Q FY12/2019
202.Results by Segment
2-5.General Entertainment Business/
Real Estate Business
21(General Entertainment Business)
※
M&A of companies such as allfuz and Foolenlarge contributed to
both revenue and profit.
Operating Revenue Operating Profit
Unit: Billions of yen
1.7
0
0.5
-0
1Q FY03/2019 1Q FY12/2019 1Q FY03/2019 1Q FY12/2019
※ Foolenlarge changed its name to United Productions on August 1st.
22(Real Estate Business)
Year-on-year, operating revenue increased, while operating profit
decreased due to an increase in costs of sales.
Unit: Billions of yen
Operating Revenue Operating Profit
1.3
1.1
0
-0
1Q FY03/2019 1Q FY12/2019 1Q FY03/2019 1Q FY12/2019
233.Results Forecast for FY12/2019
24 Prior conditions for consolidated results forecast
• J Trust adopts the average exchange rates from the time when the company
entered each country until the end of March 2019.
1SGD :82.63 JPY 1IDR :0.0084 JPY 1 MNT:0.0437 JPY
1KRW:0.093 JPY 1USD:110.99 JPY
• Furthermore, rates from the end of June are as follows:
1SGD:79.68 JPY 1IDR :0.0077 JPY 1MNT:0.0405 JPY
1KRW: 0.0933 JPY 1USD:107.79 JPY
• Figures for Investment Business only reflect those gains and losses which
normally occur.
25 Results Forecast and Status of Progress by Segment
Operating Revenue and Operating Profit by Segment
FY12/2019 Q1 FY12/2019
Forecast Results Progress
※9 mos. from ※3 mos. from
4/1~12/31 4/1~6/30
Operating
6.9 billion JPY 2.3 billion JPY 33%
Revenue
Financial Business in Japan
Operating Profit 2.9 billion JPY 1.0 billion JPY 34%
Operating
28.9 billion JPY 9.7 billion JPY 34%
Financial Business in South Korea and Revenue
Mongolia
Operating Profit 3.3 billion JPY 2.5 billion JPY 76%
Operating
12.9 billion JPY 2.7 billion JPY 21%
Revenue
Financial Business in Southeast Asia
Operating Profit -1.7 billion JPY -1.8 billion JPY -
Operating
1.0 billion JPY 0.2 billion JPY 20%
Revenue
Investment Business
Operating Profit -0.6 billion JPY -0.5 billion JPY -
Operating
14.4 billion JPY 3.1 billion JPY 22%
Revenue
Adjustments, etc.
Operating Profit -3.8 billion JPY -0.7 billion JPY -
Operating
64.3 billion JPY 18.2 billion JPY 28%
Revenue
Total
Operating Profit 0.0 billion JPY 0.4 billion JPY -
264.Outlook by Segment
Managing Director,
Executive Officer and
General Manager of Finance Department
Ryuichi Atsuta
27 Reexamining what makes J Trust interesting
Mainly engages in finance with banking, nonbank and servicer businesses as
its core business
(Host countries: South Korea, Singapore, Indonesia and Mongolia)
A solid financial base
• Total assets:624 billion JPY
※1
• Net worth :109.6 billion JPY
※2
• Equity ratio :16.3%
In Q4 FY03/2019, booked reserves against potential loan losses as insurance
against underlying risks and minimized additional future risks
Plans to acquire a Cambodian bank in good standing
Have reformed management structures in each location to establish a first-
rate organization
※1 Net worth:Equity attributable to owners of parent
※2 Equity ratio: Proportion of equity attributable to owners of parent 28 Looking back on J Trust’s ten years of growth
Since the takeover bid in 2008, J Trust has expanded its operations.
Growth since 2008
March 31st, 2008 June 30 th, 2019
Asset size 12.1 billion JPY
Employees 81
Companies 2
Number of
countries in 1
Group
29 J Trust plans to acquire a commercial bank in Cambodia,
which boasts a GDP of nearly 7%.
ANZ Royal Bank’s asset size is in the Top 10 out of 42 Cambodian
commercial banks.
ANZ Royal has already recorded a high revenue and an operating
profit of 3.1 billion yen in 2018.
Unit: Billions of yen
Profits (over five years)
Operating revenue Operating profit Distribution of
Other revenue Net interest income 94.3 billion JPY assets
(As of Dec. 31st, 2018)
5.4 5.4 1
5.2 5.2 5.1 3.1 10
3.0 2.9
2.8 2.8 Other assets
1.6
1.9 2.0 1.9 1.8 Statutory deposits
43.7
Loans
3.8 Deposits/Placements
3.2 3.3 3.2 3.2
28.3
Cash deposits
11.3
2014 2015 2016 2017 2018 2014 2015 2016 2017 2018
※Data taken from the National Bank of Cambodia’s 2018 Annual Report
Financial Highlights are taken from ANZ Royal Bank’s 2018 Annual Report
Reference rate:1USD=107.79 JPY (Closing rate as of June 30th)
30 Experts at bank management have been dispatched from J Trust.
ANZ Royal Bank’s forte is corporate transactions.
J Trust will combine its expertise in retail finance with ANZ Royal Bank’s
achievements.
Once J Trust’s advancement into Cambodia is established, Cambodia will
become the sixth country to host J Trust’s business.
Toru Myochin Makoto Kurokawa
(※ Logo and design
undetermined)
Mr. Myochin joined Dai-Ichi Mr. Kurokawa joined Sanwa
Kangyo Bank (now Mizuho Bank (now MUFG Bank) in
Financial Group) in 1988. He 1979. He then worked at
then held important positions foreign-owned security firms
at Shinsei Bank and joined the and joined the J Trust Group in
J Trust Group in 2015. 2012.
31 Financial Business in Japan:
J Trust will continue to diversify its guarantee products.
Nihon Hoshou launched guarantees on crowdfunded products as a
form of new guarantees. The company released two types of
guarantees for mortgages, which are its forte.
The number of banks that partner with Nihon Hoshou for guarantees
on overseas mortgages increased to three.
• Began accepting
applications on May 10th, 2019
• Application limit:
13 million JPY
(Full amount raised)
• Sold out in roughly 40 min.
• Began accepting applications on
June 4th, 2019
• Application limit:
23 million JPY
(Full amount raised)
• Sold out in roughly 10 min.
32 Financial Business in South Korea and Mongolia: recorded high
profitability despite strict caps on maximum interest rates
Introduced CSS (automatic totaling and self learning functions) to provide
highly accurate credit lines to prevent the occurrence of NPLs
Conducted effective business operations through marketing and brand strategy
to draw in highly creditworthy customers
7,000 people are currently participating in the
Added machine learning Group’s golf championship.
capabilities to our credit scoring
system
Customer info
Loan amount
Delinquency
record
Attributes
Ability to repay CSS
+
Other info Automatic Provides
Real estate totaling and highly accurate
market
self learning credit lines
Market situation
according to each functions
industry
More detailed scoring (screening) can be
achieved through the use of Fintech.
Brand marketing and CSR activities
that utilize the Group’s brand mascots
33 General Entertainment Business: The Group will improve managerial
efficiency by organizing its businesses.
Consolidated allfuz and KeyStudio on July 1st
Consolidated KeyProduction and Foolenlarge as well as changed the
company name to United Productions on August 1st
JASDAQ:4712
Advertisement Pop idol group Video production Live entertainment
Real estate business
business production business business business
Consolidated on Changed company name
July 1st on July 1st Consolidated and changed
company name on August 1st
34Current Condition of Financial Business in
Southeast Asia (Indonesia) and Strategy for
Future Growth
Representative Senior Managing Director
and Executive Officer
Nobuiku Chiba
Copyright(C)2019 JTRUST Co.,Ltd. All Rights Reserved. 35Thankful for
the raging
waves…
36 Reserves against potential loan losses were booked due to processing of NPLs.
J Trust Bank Indonesia(BJI): Revenue decreased due to decreased assets
J Trust Investments Indonesia (JTII): Booked reserve against potential
loan losses for the NPLs which were transferred from BJI
Financial Business in Southeast Asia: Summary for each company
Unit: Billions of yen
JT
1Q FY12/2019 J Trust Bank JT Olympindo Segment total
Investments
2.2 0 0.4 2.7
※
Operating revenue
Operating expenses 0.1 4.4 0.3 4.8
Expenses related to
bad debt -2.9 4.4 0.1 1.5
SG&A fees 1.0 0 0.3 1.4
Other revenue 1.6 0 0 1.7
Other expenses 0 0 0 0
Operating profit 2.6 -4.5 -0.2 -1.8
Reference rate: 1 IDR=0.0077 JPY (Closing rate as of 30th)
※ J Trust Investment’s operating revenue is 67 million yen.
Individual figures for each company are found under Financial Data at: https://www.jt-corp.co.jp/en/ir/library/ir_data_00/ 37Root Causes of BJI’s Problems and Countermeasures
In this quarter, J Trust worked on “building a foundation”.
What were the causes of
What does it mean to “build a foundation”?
our mistakes?
I. Reshuffling personnel and organizations
• Dispatched elite group members to Indonesia
II. Enhancing risk management
• Enhanced risk management structure and screening
① Insufficient III. Improvements
dept. to IT
employees’ skills • Development of mobile banking and efforts to achieve
digital banking
② Risk IV. Improvements to COF(Cost of Funds)
Management Reductions to interest on deposits and adequate control
•
of deposit (amounts)
③ IT system + Accumulation of quality assets
• Accumulate assets mainly through JTO
Business deals with Japanese, South Korean and highly-
rated companies
381.Reshuffling personnel
and organizations
39 1.Reshuffling personnel and organizations/ Strengthening management
To rebuild the bank’s foundation, we dispatched an elite team who
had rebuilt a failed South Korean bank to Indonesia.
In addition, we dispatched specialists in areas such as screening,
sales, and auditing.
Ritsuo Fukadai Jo Wonjun Toshio Yasumatsu Masayoshi
Nobuiku Chiba President Director Director Executive Officer Kobayashi
Representative Senior Managing Executive Officer
Director, Executive Officer
Kazuyuki Matsuoka Teruhiko Miwa Yoshihiko Tomohide
Nobiru Adachi Representative Vice President Kusubae Takayama
Senior Managing Director, Director President Director Director
Executive Officer
402.Enhancing Risk Management
41 Enhancing risk management/Enhancing compliance system and screening process
Will place Japanese specialists as heads of departments and make improvements
Risk Management: Prevent future risks before they occur by detecting risks early through a “checking
function” and “visualization” of the risk as well as enhancement and continuation of monitoring functions
Screening: Reevaluate existing loans, increase the collateral coverage ratio required for loans, and
disperse risks by using a joint finance scheme
Category Issue Future plan for improvement
Place quality control supervisors in all locations one by one and
• Governance monitor the situation 24/7
Establish a system to report problems when detected even if they
• Slow to respond occur in a different department
Risk
when problems occur, Increase monitoring through daily reports and regularly scheduled
management
and no prevention meetings by the risk management committee
measures are being ↓
taken Making risks “visible” allows us to nip them in the bud.
Anticipating future risks allows us to prevent problems before they occur.
Stop giving out loans that are at high risk for default
(We will continue to only provide loans to companies with good standing such
as state-run agencies, conglomerates and banks)
• Lax screening system Set standards for all loans to determine whether or not they will
be renewed upon completion of contracts
Screening
• Low collateral Increase the collateral coverage ratio
coverage ratio Utilize the joint finance scheme operated by BJI and JTO
↓
Minimize and disperse risks
Portfolio diversification
423.Improvements to IT
43 Introducing mobile banking
Will obtain approval from Central Bank on August 2 nd and begin notifying
general customers throughout August.
We expect that drawing creditworthy customers and luring deposits will lead
to lower costs of maintaining deposits.
42% of Indonesians use smartphones.
Even with simple calculations, that
equals over 100 million people. Screen which
displays
Log-in screen accessible remaining
Icon menu Menu balance
with fingerprint ID
※ Source:Pew Research Center, Spring 2018 Global Attitudes Survey
44 Opening bank accounts online (A three-year plan)
In a country like Indonesia that is so spread out, there is a strong interest in
opening bank accounts without having to interact with someone face-to-face.
Adopt the most attractive approach for people without bank accounts.
45 Estimated schedule for digital banking
1st Year 2 nd Year 3 rd Year
Build Integrated
Platform
Build
Infrastructure
Improved Risk Management
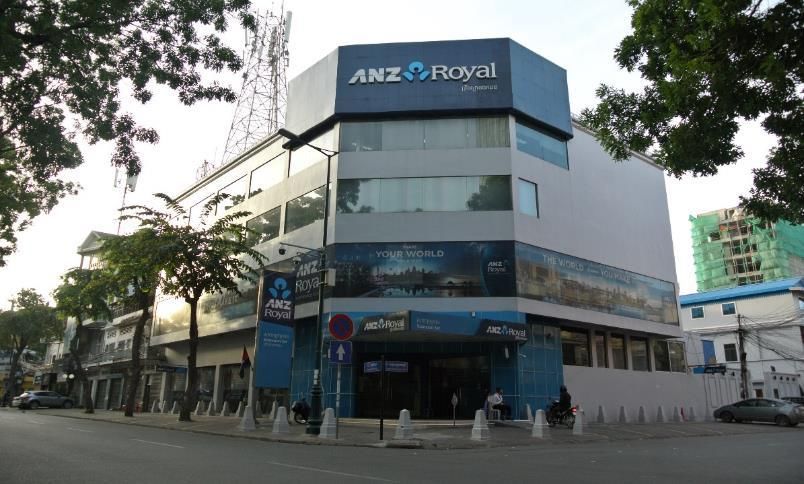
Extend Various
Customer Integration with E-
Channels Supply Chain Finance Money SNS Hub Banking
Further implementation of chat bots
Improve Customer
Service Quality Opening savings accounts without Applying for loans without face-
face-to-face interaction to-face interaction
464.Improving Cost of Funds
47 Cost of Funds
Introduce mobile banking ⇒ Increase deposits ⇒ increase percentage of ordinary
deposits ⇒ Lower cost of funds
Deposits are decreasing because deposit amounts are being controlled amid
regulations on loans (which will lead to lower costs)
Balance of deposits and cost of funds (deposit costs)
Unit: Billions of yen
Deposit balance COF(AVG.Balance)
105 7.60%
7.39%
7.40%
100 7.20%
7.20%
7.00%
95
6.80%
101.4
90
6.60%
6.59%
6.40%
85 89.7
6.20%
80 6.00%
2019/ 2019/
12 01 02 03 04 05 06 12 (Forecast)
※ Figures shown have been multiplied by local currency using the following rate:
1 IDR=0.0077 JPY(Closing rate as of June 30th) 48+. Accumulating good-quality assets
49 Accumulating good-quality assets
First work to reduce NPLs, including accounts at risk for NPLs
Using joint finance with JTO, increase secured loans which have
convertibility (such as vehicles and farm equipment).
Lend to or invest in bonds from highly reliable companies such as
Japanese, state-owned, conglomerates and banks.
Conceptual time for accumulating good-quality assets
250
Unit: Billions of yen
197.0
200
162.3 Other
150 132.2 Joint finance
108.0 with multi-
finance
100 84.6 companies
71.8
65.1 Loans for good-
quality
50 companies and
bond
investments
0
2018/ 2019/ 2019/ 2020/ 2021/ 2022/ 2023/
12 01 02 03 04 05 06 12 12 12 12 12
※ Figures shown have been multiplied by local currency using the following rate:
1 IDR=0.0077 JPY(Closing rate as of June 30th) 505.Missions for JTO and JTII
51 Missions for JTO and JTII
J TRUST OLYMPINDO:Accumulate a large amount of secured loans
which have convertibility, such as loans for cars and farm equipment
J TRUST INVESTMENTS: Collect receivables transferred from BJI
三位一体の経営体制を確立
Bank Multi-finance Servicer
52 JTO will aim to increase its balance by collaborating with BJI
The balance decreased temporarily as a result of the long holiday taken by
dealers for Lebaran in June 2019, but July figures largely exceeded figures from
May, and are now reaching a new record high.
JTO will work more closely with dealers and try to expand its network even
further.
Monetary amount and number of new loans at JTO
Unit: Billions of yen Unit: Number of loans
1.2 1,141 1200
1,047
Amount from new loans(Bar graph, left axis)
1 950 1000
Number of new loans (Line graph, right axis) 874
799
748 720
0.8 800
615
577
0.6 519 600
427 0.97
0.89
0.4 0.80 0.81 400
0.67 0.66
0.53 0.54 0.56
0.2 0.40 0.43 200
0 0
2018/
09 10 11
※ Figures shown have been multiplied by local currency using the following rate:
1 IDR=0.0077 JPY(Closing rate as of June 30th)
53 JTII will use the expertise it has gained in the 3.5 years since its establishment and work to expand
receivables collections.
Obtain profit (a revenue opportunity) as the first servicer business of its kind in the
Indonesian market, where there are a lack of specialized collection vendors
Combine the expertise gained in Japan and South Korea and work to expand collections
Principle amount claimed (Bar graph, left axis)
Unit: Millions of yen
Actual amount collected (Line graph, right axis Unit: Millions of yen
40,000 120
101
35,000 32,620
Since the 100
30,000 reorganization, we have
boosted the amount of 80
25,000 collections.
60 61
20,000 60
36 45
15,000 Ave.42
10,939 40
29 26
10,000 29
16 16
20
5,000 4 8 5 6
5 5
Ave.10
0 0
2018/ 2019/
04 05 06 07 08 09 10 11 12 01 02 03 04 05 06 07
※ Figures shown have been multiplied by local currency using the following rate:
1 IDR=0.0077 JPY(Calculated on June 30th) 54 “Issues” to address in the Indonesian business
Increasing net worth
Determining how many creditworthy customers there are for
whom we can make loans
Legal stability/Heavy restrictions on foreigners/Resolving
inconsistent judgement/Figuring out how to improve the
Indonesian business segment and help it grow
55Q&A Session
56Thank You
You can also read