INVESTOR PRESENTATION - Diamond Trust Bank

Page created by Bryan Lane
 
CONTINUE READING
INVESTOR PRESENTATION - Diamond Trust Bank
INVESTOR
             Q1 2021
PRESENTATION
INVESTOR PRESENTATION - Diamond Trust Bank
➢ Who We Are

➢ Macro Economic Highlights

➢ DTB’s Response to COVID-19

➢ DTB’s Strategy- DTB Vision 2020

➢ DTB’s Strategy- DTB Strategy 2030 and Beyond

➢ DTB’s Recognition

➢ Managing Risks and Building Resilience

➢ Remodeling the Business Pivoting to Digital

➢ Financial Performance

➢ DTB 2020 Integrated Report & Financial Statements

➢ Outlook
INVESTOR PRESENTATION - Diamond Trust Bank
WHO WE ARE

                                                                                                                To make our
               Enabling people to                                                                               customers prosper,
               advance with                                                                                     our staff excel and
               confidence and                                                                                   create value for our
               success                                                                                          stakeholders.

                       Integrity - Be Ethical and Fair
                       • We honour our commitments and do what is right                                 Progressive - Innovate and Challenge
                       • We are fair, respectful and honest at all times                                • We challenge our thinking to raise the bar
                       • We are ethical in our decisions and interactions                               • We encourage our team members to question
                       • We take responsibility for our actions                                           the status quo
                       • We are prudent and responsible with the assets entrusted to DTB                • We innovate and adapt to change
                                                                                                        • We positively impact and serve the communities
                       Customer Centric - Deliver Great Experiences                                       in which we live
                       • We value our customers and develop products and services around their
                         needs
                       • We provide exceptional service to all we serve                                 Excellence - Be Your Best
                       • We understand and respect our customers                                        • We take ownership of what we do
                       • We deliver solutions that add value to our customers’ lives                    • We relentlessly pursue quality without
                       • We consider the impact of our policies and decisions on our customers            compromise
                       • We endeavor to be fully transparent with our customers                         • We consistently adhere to measurable standards
                                                                                                          and look for ways to exceed them
                       Value   People - Respect, Empower, Appreciate                                    • We benchmark against the best
                       • We    treat our people equitably and make decisions on merit
                       • We    invest in people and provide opportunities for learning and growth
                       • We    empower people to do what is needed for success
                       • We    provide a positive and collaborative work environment
                       • We    celebrate our successes and recognise people for their contributions
                       • We    encourage and embrace diversity
                                         DTB’s Response to
                      Macro Economic                         DTB’s Strategy   Managing Risks            Remodeling the Business   Financial
         Who We Are                      COVID-19                                                                                               Outlook
                      Highlights                                              and Building Resilience    Pivoting to Digital      Performance
INVESTOR PRESENTATION - Diamond Trust Bank
DTB GROUP STRUCTURE
as at March 2021

                                                 DTB’s Response to
                                Macro Economic                       DTB’s Strategy   Managing Risks            Remodeling the Business   Financial
                   Who We Are                    COVID-19                                                                                               Outlook 4
                                Highlights                                            and Building Resilience    Pivoting to Digital      Performance
INVESTOR PRESENTATION - Diamond Trust Bank
DTB’S FOOTPRINT
as at March 2021

                                                     8%                                                                                                        1%
                                                  year on year                                                                                           year on year
                                                    growth                                                                                                 decline
               650,623                                                                                                      134
                   Customers
                                                                                                                          Branches
                   : 260,536     : 167,493                                                                                     : 69           : 33
                   : 219,722     : 2,872                                                                                       : 28           :4

                                                     4%                                                                                                            -
                                                  year on year                                                                                            No change

                   2,208                            decline
                                                                                                                            160
                                                                                                                                                         year on year

                   Employees
                      : 1,023     : 602                                                                                       ATMs
                                                                                                                                 : 67         : 56
                      : 536       : 47
                                                                                                                                 : 37
                                                     DTB’s Response to
                                 Macro Economic                          DTB’s Strategy   Managing Risks            Remodeling the Business          Financial
                    Who We Are                       COVID-19                                                                                                          Outlook 5
                                 Highlights                                               and Building Resilience    Pivoting to Digital             Performance
INVESTOR PRESENTATION - Diamond Trust Bank
WHAT
DIFFERENTIATES US

          Commitment to a               Diversified distribution
          sustained organisation-       channels and footprint.
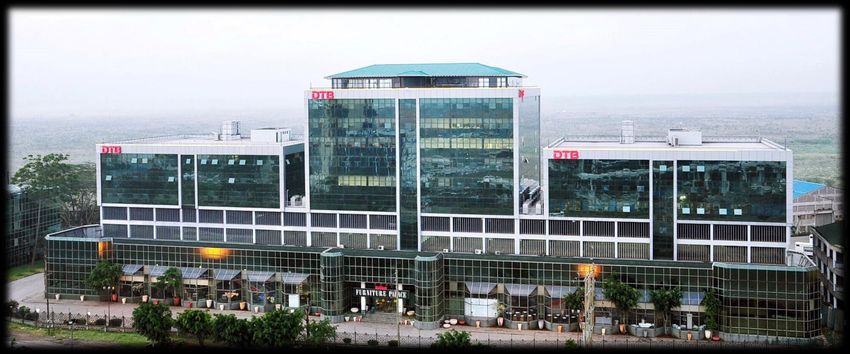
          wide culture of service                                                                     Diamond Trust Bank (DTB) is a leading, Tier I
          excellence.                                            Extensive product                    East African commercial bank headquartered in
                                                                 range, with growing                  Nairobi, Kenya and listed on the Nairobi Securities
                                                                 emphasis on digital                  Exchange (NSE) since 1972. As one of Eastern
Solid brand                                                      products, services and               Africa’s leading and longest established banking
equity built                                                     channels.                            groups, we understand the intricacies of the
over 75 years.                                                                                        region’s markets and provide a wide range of
                                                                                                      services in business and retail banking. To
                                                                    Robust IT                         continue staying at the forefront of the industry,
                                                                    Platform.                         we are re-imagining banking.
Strong capital
                                                                                                      We use innovation and digital technology to
base anchored
on shareholders
                                                                                                      extend our reach, provide convenience and a
                                                               Reputation for                         better customer experience, as well as become
resources and                                                  professionalism
standing.                                                                                             more agile in creating tomorrow’s solutions. The
                                                               and integrity.
                                                                                                      Group remains a purpose-driven institution
                                                                                                      with a tailored corporate culture to the local
          Established regional                  Strong corporate                                      markets in which it operates in and is driven
          network and market                    governance and                                        towards a more customer-centric and
          knowledge covering the                compliance culture                                    innovative business organisation.
          East African Community.               underpinned by
                                                effective internal
                                                control systems.
                                                      DTB’s Response to
                                    Macro Economic                        DTB’s Strategy   Managing Risks            Remodeling the Business   Financial     6
                      Who We Are                      COVID-19                                                                                                   Outlook
                                    Highlights                                             and Building Resilience    Pivoting to Digital      Performance
INVESTOR PRESENTATION - Diamond Trust Bank
MACRO- ECONOMIC
HIGHLIGHTS

                  7
INVESTOR PRESENTATION - Diamond Trust Bank
MACRO- ECONOMIC
HIGHLIGHTS- EAST AFRICA
       GDP Growth
                                    7.6%
                                                                                                        6.3%

                                                                  2.7%                                                                       2.8%
                                                          1.0%
                          -0.1%

                              Kenya                          Tanzania                           Uganda                             Burundi
                                                                                                                               -1.3%
                                                                                             -2.1%

                                                                    2020           Expected 2021
                                                                                                                                   Source: IMF World Economic Outlook April 2021
       Exchange Rate to USD

           Uganda                                                                                                                                 3762.9
                                                                                                                                                3,665.0
                                                                                                                                                                  3%

          Tanzania                                                                               2296.5
                                                                                                  2,319.0
                                                                                                                  1%

           Burundi                                                                 1876.0
                                                                                     1,947.4       4%

            Kenya          104.3
                            109.4    5%

                                                                                                                                      Source: Respective Central Banks
                                                                    Mar-20          Mar-21
                                             DTB’s Response to
                            Macro Economic                        DTB’s Strategy        Managing Risks             Remodeling the Business          Financial                      8
             Who We Are                      COVID-19                                                                                                                    Outlook
                            Highlights                                                  and Building Resilience     Pivoting to Digital             Performance
INVESTOR PRESENTATION - Diamond Trust Bank
MACRO- ECONOMIC
HIGHLIGHTS- KENYA
     Inflation, CBR and 91-Day T-Bills rate (%)

    Apr-20   May-20     Jun-20           Jul-20    Aug-20         Sep-20          Oct-20   Nov-20        Dec-20        Jan-21      Feb-21         Mar-21
                                                                                                                                  Source: CBK March 2021
                                                      CBR             Inflation        91 day T-Bills

                            ▪     CBR is only applicable to 30% of the Banks’ legacy Kenya Shilling denominated
                                  loans still under Rate Cap Law (now repealed).
                            ▪     T-bills rate has remained stable-Government is converting short term debt to long
                                  term bonds to ease repayment burden
                            ▪     Inflation is stable anchored by stable monetary policies put in place

                                                  DTB’s Response to
                                Macro Economic                            DTB’s Strategy     Managing Risks             Remodeling the Business      Financial     9
               Who We Are                         COVID-19                                                                                                             Outlook
                                Highlights                                                   and Building Resilience     Pivoting to Digital         Performance
INVESTOR PRESENTATION - Diamond Trust Bank
DTB’s RESPONSE
TO COVID-19

                          Relief to          MSME Credit           Pivoting to            Capital             Liquidity
   Citizenship
                         Borrowers             Access                Digital              Buffers              Buffers

   Committed the          Repayment         Partnered with the     Waived fees on      Given the global      Boosted DTB’s
 equivalent of over    holidays granted     National Treasury      mobile banking        and regional      liquidity through
  KShs 100 million        for stressed          of Kenya to        transactions to        uncertain       USD 100 million
    to COVID-19         facilities. As at    provide access to   discourage the use       operating        in new funding
   support in East    Q1 2021 valued at      credit amounting          of cash.       environments, we    from Development
 Africa. Supported      KShs 72 Billion              to           Transaction fees     have enhanced            Finance
    over 30,000         (33% of loan         KShs 1.6 billion         foregone           our capital          Institutions.
    economically      book) across the      to MSMEs, under         amounted to            buffers.
     vulnerable              Group.              the Credit      KShs 140 million
 households across                              Guarantee        since March 2020.
     East Africa.                                 Scheme.

                                                                                                                10
DTB’s APPROACH TO
SUSTAINABILITY
        DTB’s approach to sustainability involves connecting directly with people and making a lasting impact on their
        lives. DTB gives careful consideration to the impact of our business activities on the interests of our
        stakeholders— customers, employees, the larger community and shareholders. We strive to create sustainable
        social and economic value by delivering delightful and lasting experiences to all those we interact with.

        The Bank continues to track progress in 10 of the 17 UN SDGs. More details of the same can be found on the
        Bank’s website by visiting: https://dtbk.dtbafrica.com/sites/default/files/downloads/2020_Integrated_report.pdf

                                          DTB’s Response to
                         Macro Economic                       DTB’s Strategy   Managing Risks            Remodeling the Business   Financial
            Who We Are                    COVID-19                                                                                               Outlook
                         Highlights                                            and Building Resilience    Pivoting to Digital      Performance             11
DTB’s STRATEGY-
DTB VISION 2020
 DTB Vision 2020 envisioned DTB as a leading commercial bank and a significant
 participant in the economies where it operates:
 ➢ Rank among the top tier banks by liabilities

 ➢ Be a sustainable deposit led bank (CASA)

 ➢ Play a leading role in transitioning economies to support economic development

 ➢ as a ‘one- bank, one customer’ omnichannel regional bank.

 ➢ by providing seamless and consistent customer experience, across borders, through a
   multiplicity of channels:
             - traditional (branches, ATMs, cards etc.)
             - digital channels (enriched mobile banking and enhanced on-line banking
               platforms, digital branches, social media channels, etc.)

              DTB Vision 2020

                                                   DTB’s Response to                                                                                          12
                                  Macro Economic                       DTB’s Strategy   Managing Risks            Remodeling the Business   Financial
                     Who We Are                    COVID-19                                                                                               Outlook
                                  Highlights                                            and Building Resilience    Pivoting to Digital      Performance
DTB’s STRATEGY-
DTB STRATEGY 2030 AND BEYOND
  DTB Strategy 2030 and Beyond: under review and
  modification:

  ➢ will take into account the changing environment and
    customer behaviour, including the ongoing effects of the
    unexpected COVID-19 pandemic and the post-
    pandemic business landscape.

  ➢ will be anchored on the improvement in the quality of
    lives of customers – those that DTB is currently serving,
    as well as those that are under-served.

  ➢ will be digital at the   core through continued investment
    in its people, new       skills and technologies (Big Data
    analytics, Artificial    Intelligence (AI), robotics, cloud
    computing, etc) and      innovation.

                 In Progress
                                                    DTB’s Response to                                                                                          13
                                   Macro Economic                       DTB’s Strategy   Managing Risks            Remodeling the Business   Financial
                     Who We Are                     COVID-19                                                                                               Outlook
                                   Highlights                                            and Building Resilience    Pivoting to Digital      Performance
DTB’S
RECOGNITION

              WINNERS                     RUNNERS UP

       ➢ Best Bank in Customer      ➢Best Bank in Mobile Banking
                                      (of 4 participants).
         Satisfaction- Tier I       ➢Best Bank in Asset Finance
         (of 9 participants)          (of 3 participants).
       ➢ Best Bank in SME Banking   ➢Best Bank in Product Innovation
         (of 11 participants)        (of 6 participants).
                                                                       14
MANAGING RISKS AND
BUILDING RESILIENCE

                      15
SECTOR-WISE
RESTRUCTURES-                                         Facilities Restructured Relating to
GROUP                                                         COVID-19 (Q1 2021)
                     3%                                                                                                    2% 6%
                4%
           5%            1% 0%                  23%                                                                  8%                0%
                                                                                                                                                      26%

      7%
                                                                                                             8%
                 Overall Loan                                                                                                Facilities
    8%
                    Book                                                                                                   Restructured
                 KShs 219 Bn                                                                                7%              KShs 72 Bn

                                                      19%
         14%
                                                                                                                     14%
                                                                                                                                                  29%
                          16%

                                                                                                33% of the loan
                     •       Moratorium of up to 12 months.                                     book on
                     •       Extension of tenor.                                                restructured
                     •       Cost of restructuring absorbed by                                  terms as at
                             the Bank.                                                          March 2021.

                                                      DTB’s Response to
                               Macro Economic                             DTB’s Strategy   Managing Risks             Remodeling the Business   Financial
                Who We Are                            COVID-19                                                                                                Outlook   16
                               Highlights                                                  and Building Resilience     Pivoting to Digital      Performance
SECTOR-WISE
RESTRUCTURES-                                     Facilities Restructured Relating to
KENYA                                                     COVID-19 (Q1 2021)
                      2%                                                                                                    2%
                 3%
                                                                                                                    8%
            5%                              22%
                       2%      0%                                                                                             2%       0%

                                                                                                             8%                                        30%
      8%

                 Overall Loan                                                                                            Facilities
    8%                                                                                                  8%
                    Book                                                                                               Restructured
                 KShs 166 Bn                                                                                            KShs 62 Bn

                                                  21%
      13%                                                                                                   13%

                                                                                                                                            29%
                          16%

                                                                                             37% of the loan
                      •       Moratorium of up to 12 months.                                 book on
                      •       Extension of tenor.                                            restructured terms
                      •       Cost of restructuring absorbed by                              in Kenya as at
                              the Bank.                                                      March 2021.

                                                  DTB’s Response to
                                Macro Economic                        DTB’s Strategy   Managing Risks             Remodeling the Business     Financial
                 Who We Are                       COVID-19                                                                                                   Outlook   17
                                Highlights                                             and Building Resilience     Pivoting to Digital        Performance
SECTOR-WISE ANALYSIS
OF LOAN BOOK AND NPAs-
GROUP
                  47.5

Q1 2021 (%)
              23.3                   27.3
                                18.5            16.1
                                                                   14.2
                                                     10.6                             7.7                7.0               4.8
                                                                           1.5               5.0                                  1.8            3.8    5.3         3.2
                                                                                                                 0.1                                                        0.2         1.2             0.2
                                                                                                                                                                                              0.7                  0.0
              Trade          Real Estate    Manufacturing        Tourism          Transport and      Agriculture        Building &        Personal              Financial         Energy &              Mining
                                                                                 communication                         Construction      Household              services           Water

                                                                                         Loans             Sector-wise NPA
                                                                                                           % of total NPA

                      46.8

               25.3

Q1 2020 (%)                      17.3
                                         16.4     16.9
                                                         17.3         13.2
                                                                                         7.4                                                           4.0
                                                                                               8.3             6.3               5.0
                                                                             2.6                                                                              5.2         3.3                                      0.2
                                                                                                                     1.8                0.5                                       0.0         1.1 1.1
                                                                                                                                                                                                                          0.0
                                                                                                                                                                                                                          -
              Trade           Real Estate    Manufacturing         Tourism          Transport and       Agriculture         Building &            Personal            Financial     Energy & Water               Mining
                                                                                   communication                           Construction          Household            services

                                                                                               Loans            Sector-wise NPA
                                                                                                                % of total NPA

                                                                DTB’s Response to
                                        Macro Economic                                      DTB’s Strategy             Managing Risks                    Remodeling the Business               Financial      18
                       Who We Are                               COVID-19                                                                                                                                             Outlook
                                        Highlights                                                                     and Building Resilience            Pivoting to Digital                  Performance
BALANCE SHEET
HIGHLIGHTS-
GROUP
        Provision Movement                                                                                 Provision Split
        (KShs Mn)                                                                                          (KShs Mn)

                                                                                                                                        10,118

                                                                                                        4,510

                                                                                                        1,609                           1,763

                                                                                                        1,329                           1,174

                                                                                                       Q1 2020                         Q1 2021

                                                                                                           Stage 1     Stage 2        Stage 3

                                        DTB’s Response to
                       Macro Economic                       DTB’s Strategy   Managing Risks                 Remodeling the Business       Financial     19
          Who We Are                    COVID-19                                                                                                             Outlook
                       Highlights                                            and Building Resilience         Pivoting to Digital          Performance
NON PERFORMING LOANS &
COVERAGE RATIOS- GROUP
                                          NPA Ratio Evolution (%)
                                                              14.1                               14.1 (April 2021)
                           12.5
                                                               11.9                                11.9

                                                               10.3                                10.2
                          8.3
                             7.9
                                                                                                                                      NPL ratio stable and
                                                                                                                                      below industry average.
                                                               3.4
                                                                                                    1.3
                            0.8
                        Q1 2020                              FY 2020                           Q1 2021

                            Industry Gross NPA Ratio (Kenya)           Group Gross NPA Ratio
                            Group COR                                  Kenya Gross NPA Ratio

                           Specific Provision/ NPA Coverage Ratio (%)
                                                               43.3                                45.2

                            32.0
                                                                                                                                      Increase in coverage
                                                                                                                                      anchored on prudence
                                                                                                                                      and conservatism.

                          Q1 2020                             FY 2020                           Q1 2021

                                         DTB’s Response to
                       Macro Economic                            DTB’s Strategy      Managing Risks                  Remodeling the Business   Financial     20
          Who We Are                     COVID-19                                                                                                                 Outlook
                       Highlights                                                    and Building Resilience          Pivoting to Digital      Performance
EVOLUTION OF NON PERFORMING
ACCOUNTS (NPA)
                                   Evolution of NPAs (Gross of Interest in Suspense) +
                               Coverage Ratio (Specific Provision/ NPAs Coverage Ratio) (%)

                                                                                                                                10.3%                            10.2%
                                                                                                                                 22.8                             22.9
                                                                                           8.3%
                                                          8.2%                                                      11.9%                                11.9%
                         7.9%                                                                                           19.7                              19.8
                                                                                  8.8%     18.0
                                                 8.6%      17.5
                 8.3%        16.6
      KShs Bn

                                                                                  14.6
                                                 13.9
                 13.3

                                                                                                                                                                 46.5%
                                                                                          54.7%
                                                         51.2%                                                                  44.6%
                                                                                57.2%                                                                    45.9%
                                                                                                                    44.6%
                         42.4%                   53.8%

                45.2%

                    Mar-20                          Jun-20                           Sep-20                               Dec-20                            Mar-21

                                                              Coverage      Gross          Gross NPA        NPA Ratio
                                                              Ratio         NPA Bank       Group

                                                  DTB’s Response to
                                Macro Economic                           DTB’s Strategy       Managing Risks                   Remodeling the Business      Financial     21
                Who We Are                        COVID-19                                                                                                                     Outlook
                                Highlights                                                    and Building Resilience           Pivoting to Digital         Performance
LOAN BOOK PERFORMANCE-
NON PERFORMING ACCOUNTS (NPA)
                                             Top 10 NPAs as a % of Total NPAs

                                                                                                                                      72%
    Mar-21
                                                                                                                                                     81%

                                                                                                                                        75%
    Dec-20
                                                                                                                                                           83%

                                                                                                           58%
    Sep-20
                                                                                                                               70%

                                                                                                                 62%
    Jun-20
                                                                                                                                      72%

                                                                                                                   64%
    Mar-20
                                                                                                                                      72%

                                                                     Group      Bank

                                           DTB’s Response to
                          Macro Economic                       DTB’s Strategy    Managing Risks             Remodeling the Business         Financial     22
             Who We Are                    COVID-19                                                                                                            Outlook
                          Highlights                                             and Building Resilience     Pivoting to Digital            Performance
STRONG CAPITAL
BUFFERS
                  Core Capital to RWA (%)                                               Total Capital to RWA (%)
                              Kenya                                                                            Kenya
                               20.7                  20.8                                                       22.5                      22.4
        19.3                                                                            21.0

                                                                                        14.5                    14.5                      14.5
        10.5                   10.5                  10.5

                                                                                     Q1 2020                   FY 2020                Q1 2021
       Q1 2020                FY 2020              Q1 2021
                                                                                           Min Total Capital/RWA           Total Capital /RWA
          Min Core Capital/RWA            Core Capital /RWA
                                                                                                                                                    Adequate
                              Group                                                                            Group                                capital ratios
                                                     19.7
                                                                                                                                                    above
        18.4                   18.0
                                                                                        20.2                                              21.1      statutory
                                                                                                                19.7
                                                                                                                                                    requirement
                                                                                        14.5                    14.5                      14.5
        10.5                   10.5                  10.5

       Q1 2020                FY 2020             Q1 2021                            Q1 2020                   FY 2020                Q1 2021

          Min Core Capital/RWA            Core Capital /RWA                                Min Total Capital/RWA           Total Capital /RWA

                                                DTB’s Response to
                              Macro Economic                        DTB’s Strategy   Managing Risks             Remodeling the Business      Financial
                 Who We Are                     COVID-19                                                                                                   Outlook
                              Highlights                                             and Building Resilience     Pivoting to Digital         Performance             23
LIQUIDITY                                                        Liquidity (%)

                   Kenya

                                                                                                       58.7
                                           54.7                          56.0

                                                                                                                                           Stable liquidity
                                                                                                                                           levels across the
                                           20.0                          20.0                          20.0                                Group

                                          Q1 2020                      FY 2020                       Q1 2021

                                                      Min. Liquidity (Statutory)        DTB Kenya
                   Group

                                            56.3                          56.3
                                                                                                       59.5                       Draw down of
                                                                                                                                  USD 100 million from
                                                                                                                                  Development Financial
                                                                                                                                  Institutions:
                                            20.0                          20.0                         20.0                       IFC- USD 50 million,
                                                                                                                                  AfDB- USD 40 million &
                                                                                                                                  DEG- USD 10 million.
                                          Q1 2020                      FY 2020                      Q1 2021

                                                          Min. Liquidity (Statutory)       Group

                                             DTB’s Response to
                         Macro Economic                             DTB’s Strategy     Managing Risks            Remodeling the Business       Financial
            Who We Are                       COVID-19                                                                                                        24 Outlook
                         Highlights                                                    and Building Resilience    Pivoting to Digital          Performance
REMODELING THE BUSINESS
PIVOTING TO DIGITAL

                          25
CHANNEL PERFORMANCE-
 Q1 2021

Group
                                                                                                            Kenya                            9%
                                                                                                                                               Branches

    85% of transactions
         done outside
           branches
                                                                                       91%          of transactions
                                                                                                     done outside
                                                                                                       branches
                                 15%
                                  Branches

                                                         Over                 84% of DTB’s retail                                  88% of mobile banking
                                                         KShs 140 million     customers subscribe to                               subscribers  use   the
                                                         foregone in mobile   mobile banking.                                      channel regularly, up
                                                         banking commissions.                                                      from 76% in Mar 2020.

                                 Macro Economic   DTB’s Response to                    Managing Risks            Remodeling the Business   Financial
                    Who We Are                                        DTB’s Strategy                              Pivoting to Digital                    26   Outlook
                                 Highlights       COVID-19                             and Building Resilience                             Performance
MERGING BRANCHES
➢ In line with DTB’s digital strategy, the              ➢ Below is a list of the branches that will be merged:
  Bank has responded to the shift to
                                                          Branch to be Merged               Receiving Branch                         Last Date of Operation
  digital channels by merging some of its
                                                          Jamhuri Street Branch             Malindi Branch                           30 June 2021
  branches, which are in close proximity
  to each other.                                          The Oval Digital Lobby            Westgate Branch                          30 June 2021
                                                          9 West Branch                     Westgate Branch                          30 June 2021
                                                          Kago Street Branch                Eldoret Branch                           30 June 2021
                                                          Garden City Branch                Thika Road Mall Branch                   30 September 2021
                                                          Eastleigh Branch                  Madina Mall Branch                       30 October 2021

                               Macro Economic   DTB’s Response to                    Managing Risks            Remodeling the Business   Financial
                  Who We Are                                        DTB’s Strategy                              Pivoting to Digital                    27   Outlook
                               Highlights       COVID-19                             and Building Resilience                             Performance
DTB MOBILE
BANKING- m24/7
                                                               Using m24/7 mobile banking platform our customers can:

                                                               ➢ open a Bank 24/7 digital account in under 5 minutes.

                                                               ➢ make seamless payments to settle their credit card balances.

                                                               ➢ worry less about security by authenticating transactions using
                                                                 leading biometrics such as facial recognition.
                                                               ➢ conveniently be informed of recent and upcoming transactions
                                                                 through in-app notifications.
                                                               ➢ confirm their beneficiary’s name before sending money to
                                                                 another DTB customer.
                                                               ➢ effortlessly book fixed deposits directly                             from    their   phone
                                                                 promoting a convenient savings culture.
                                                               ➢ easily conduct foreign currency internal transfers denominated
                                                                 in USD, GBP and EUR.
                                                               ➢ comfortably send/ receive Western Union transfers directly on
                                                                 their phones.
                                                               ➢ send money to and from their DTB account effortlessly to third
                                                                 party.

                          Macro Economic   DTB’s Response to                       Managing Risks            Remodeling the Business     Financial
             Who We Are                                           DTB’s Strategy                              Pivoting to Digital                       Outlook
                          Highlights       COVID-19                                and Building Resilience                               Performance              28
CHANNEL PERFORMANCE-
KENYA MOBILE BANKING
     No. of Mobile Banking (m24/7)
     Transactions (Mn)
                                                                                 9.4

                                                   5.4                                                                   m24/7
                                                                                                                         transaction count up
                                                                                                                         by
                                                                                                                                       74%
                                               Q1 2020                         Q1 2021

      Value of m24/7 Transactions (KShs Bn)

                                                                                 34.7
                                                                                                                        m24/7
                                                                                                                        transaction values up by
                                                                                                                                       114%
                                                  16.2

                                               Q1 2020                         Q1 2021

                         Macro Economic   DTB’s Response to                                                  Remodeling the Business   Financial
            Who We Are                                        DTB’s Strategy       Managing Risks                                                    29   Outlook
                         Highlights       COVID-19                                                            Pivoting to Digital      Performance
                                                                                   and Building Resilience
CHANNEL PERFORMANCE-
KENYA
       Mobile Banking Transaction type (% value)
                                                                                                                                                 Over KShs 60 bn
                                                                                                                                                 transferred through
                                                                                                                                                 the m24/7 channel from
      59.5%
                                                                                                                                                 Jan 2021 to Mar 2021.

              44.5%

                                                                                                                                                 Customers deposits
                                                                                                                                                 using mobile platforms

                                                22.7%
                                                                                                                                                 up by   3X
                                    20.0%
                                                                                  16.9%
                                                                                                                        15.5%
                                                                                                          13.4%

                                                                         6.7%

                                                                                                                                                0.4%   0.4%

          B2B                                 B2C                             C2B                        FUNDS TRANSFER                        BILL PAYMENTS

                                                                        Q1 2020     Q1 2021

                             Macro Economic         DTB’s Response to                                                       Remodeling the Business    Financial
                Who We Are                                                DTB’s Strategy      Managing Risks                                                         30   Outlook
                             Highlights             COVID-19                                                                 Pivoting to Digital       Performance
                                                                                              and Building Resilience
DTB INTERNET
BANKING-   i24/7
                                                                Using i24/7 our internet banking platform, is a ‘walk in the
                                                                park’ experience for our customers as they can:

                                                                ➢ pay their taxes real time on KRA’s iTax portal.

                                                                ➢ no longer queue in long lines to pay bills to Kenya Power and
                                                                  Nairobi Water.

                                                                ➢ easily transfer foreign currency denominated in USD, GBP and
                                                                  EUR.

                                                                ➢ transact securely with a one-time pin sent on email every time
                                                                  they log in to the i24/7 portal.

                                                                ➢ view accounts of related companies effortlessly on a single
                                                                  screen.

                                                                ➢ get a 360 view of all the products they subscribe to, without a
                                                                  hitch.

                          Macro Economic   DTB’s Response to                                              Remodeling the Business   Financial
             Who We Are                                        DTB’s Strategy   Managing Risks                                                    Outlook
                          Highlights       COVID-19                                                        Pivoting to Digital      Performance
                                                                                and Building Resilience                                                     31
CHANNEL PERFORMANCE-
KENYA INTERNET BANKING

    No. of Internet Banking (i24/7)
    Transactions (Thousands)                                                      223

                                                                                                                                i24/7
                                                                                                                                transactions up by
                                                 120

                                                                                                                                            86%

                                              Q1 2020                           Q1 2021                                      Average of 3,480
                                                                                                                             transactions done per
                                                                                                                             business day on i24/7
     Value of i24/7 Transactions (KShs Bn)

                                                                                   47
                                                                                                                                  i24/7 transaction
                                                  27
                                                                                                                                  values up by

                                                                                                                                            74%
                                              Q1 2020                           Q1 2021

                          Macro Economic   DTB’s Response to                                                  Remodeling the Business   Financial
             Who We Are                                        DTB’s Strategy       Managing Risks                                                    32   Outlook
                          Highlights       COVID-19                                                            Pivoting to Digital      Performance
                                                                                    and Building Resilience
CHANNEL PERFORMANCE-
KENYA
      No. of POS Acquiring Transactions
      (Thousands)
                                                                                162

                                                  120                                                                           POS
                                                                                                                                transaction count up
                                                                                                                                by
                                                                                                                                              35%
                                               Q1 2020                    Q1 2021

      Value of POS Acquiring Transactions
      (KShs Bn)

                                                                                900                                             POS
                                                                                                                                transaction value up
                                                                                                                                by
                                                  814                                                                                           11%

                                               Q1 2020                        Q1 2021

                        Macro Economic   DTB’s Response to                                                      Remodeling the Business   Financial
           Who We Are                                        DTB’s Strategy           Managing Risks                                                    33   Outlook
                        Highlights       COVID-19                                                                Pivoting to Digital      Performance
                                                                                      and Building Resilience
CHANNEL PERFORMANCE-
KENYA
  No. of ATM Transactions
  (Thousands)
                                           299
                                                                                                          Decline in number of
                                                                       234
                                                                                                          ATM transactions by

                                                                                                                         22%
                                                                                                                                               Increased
                                      Q1 2020                        Q1 2021                                                                     shift to
                                                                                                                                                cashless
  Value of ATM Transactions (KShs Bn)                                                                                                         transactions

                                           2.8
                                                                       2.3
                                                                                                         ATM
                                                                                                         transaction value
                                                                                                         down by
                                                                                                                           18%
                                       Q1 2020                       Q1 2021

                          Macro Economic         DTB’s Response to                                               Remodeling the Business   Financial
             Who We Are                                               DTB’s Strategy   Managing Risks                                                    34   Outlook
                          Highlights             COVID-19                                                         Pivoting to Digital      Performance
                                                                                       and Building Resilience
FINANCIAL
PERFORMANCE

              35
BALANCE SHEET
HIGHLIGHTS-
GROUP
                                                              Q1 2020                       Q1 2021

                                           Net
                                         Loans &              KShs 201 Bn                 KShs 206 Bn                                2%
                                        Advances

                                          Gov-                KShs 127 Bn                  KShs 152 Bn                               20%
          ASSETS                        Securities

                                          Total               KShs 385 Bn                  KShs 417 Bn                               8%
                                         Assets

                                        Customer              KShs 273 Bn                  KShs 302 Bn                               11%
        LIABILITIES                     Deposits

                       Macro Economic     DTB’s Response to                      Managing Risks            Remodeling the Business    Financial
          Who We Are                                            DTB’s Strategy                                                        Performance   Outlook
                       Highlights         COVID-19                               and Building Resilience    Pivoting to Digital                               36
BALANCE SHEET HIGHLIGHTS-
FUNDING, LIQUIDITY AND
CAPITAL
GROUP
                Funding                                                               Liquidity (%)                                                          Capital (%)
       5%                                4%

       17%                               17%

                                                                                                            59.5                                                                 21.1
                       2%                          2%                                                                                                20.2
       4%                                6%                                    56.3                                                                                  19.7    19.7
                                                                                                                                              18.4            18.0

                                                                                                                                                   14.5           14.5           14.5

       72%                                                                                                                                         10.5           10.5           10.5
                                         71%
                                                                               20.0                         20.0

    Q1 2021`                           Q1 2020                            Q1 2020                        Q1 2021                                Q1 2020         FY 2020         Q1 2021

   Customer Deposits          Deposits from Banks                          Min. Liquidity (Statutory)             Group                                     Core Capital /RWA
   Other Liabilities          Equity                                                                                                                        Total Capital /RWA
   Borrowings                                                                                                                                               Min Core Capital/RWA
                                                                                                                                                            Min Total Capital/RWA

                                          Macro Economic   DTB’s Response to                           Managing Risks            Remodeling the Business       Financial
                            Who We Are                                                DTB’s Strategy                                                           Performance       Outlook
                                          Highlights       COVID-19                                    and Building Resilience    Pivoting to Digital                                      37
BALANCE SHEET
HIGHLIGHTS-
KENYA
                                                               Q1 2020                       Q1 2021

                                           Net
                                         Loans &               KShs 152 Bn                 KShs 155 Bn                                2%
                                        Advances

                                          Gov-                 KShs 94 Bn                  KShs 114 Bn                                21%
          ASSETS                        Securities

                                          Total                KShs 286 Bn                 KShs 305 Bn                                7%
                                         Assets

                                        Customer               KShs 191 Bn                 KShs 212 Bn                                11%
        LIABILITIES                     Deposits

                       Macro Economic      DTB’s Response to                      Managing Risks            Remodeling the Business     Financial
          Who We Are                                             DTB’s Strategy                                                         Performance
                                                                                                                                                      2   Outlook
                       Highlights          COVID-19                               and Building Resilience    Pivoting to Digital
TOTAL ASSETS-
SUBSIDIARIES
CONTRIBUTION (%)
Q1 2021

                                                   15%

                                                                12%

                                                                                                           0.9%
                                                                                                              1%

                                                                                                           0.1%

                          72%
                                                                                                                0%

                       DTB Kenya        DTB Tanzania        DTB Uganda       DTB Burundi               DTBI

                       Macro Economic   DTB’s Response to                    Managing Risks               Remodeling the Business   Financial
          Who We Are                                        DTB’s Strategy                                                          Performance   Outlook   39
                       Highlights       COVID-19                             and Building Resilience       Pivoting to Digital
NET LOAN BOOK-
CONTRIBUTION
BY SUBSIDIARIES
          76%       75%

                                               16%           16%

                                                                                         7%            8%

                                                                                                                                      1%         1%

           DTB Kenya                            DTB Tanzania                              DTB Uganda                                  DTB Burundi
                                                                   Q1 2020      Q1 2021

                        Macro Economic   DTB’s Response to                        Managing Risks            Remodeling the Business        Financial
           Who We Are                                          DTB’s Strategy                                                              Performance   Outlook   40
                        Highlights       COVID-19                                 and Building Resilience    Pivoting to Digital
CUSTOMER DEPOSITS-
CONTRIBUTION BY
SUBSIDIARIES
Q1 2021

                                                                                                               17%

                                                                                                                     12%
                                   70%

                                                                                                                     1%

                                       DTB Kenya         DTB Tanzania           DTB Uganda        DTB Burundi

                      Macro Economic     DTB’s Response to                           Managing Risks             Remodeling the Business   Financial
         Who We Are                                            DTB’s Strategy                                                             Performance   Outlook
                      Highlights         COVID-19                                    and Building Resilience     Pivoting to Digital                              41
DEPOSIT MIX
GROUP
Q1 2021                    Kenya

                                                            29%
                                                                                                          60%

                                                                                                               61%
                                                   9%

                                                  1%

                                                              Fixed         Call   Savings        Current
                           Group

                                                  32%

                                                                                                              54%

                                                   13%

                                                                        1%
                       Macro Economic   DTB’s Response to                           Managing Risks              Remodeling the Business   Financial
          Who We Are                                              DTB’s Strategy                                                          Performance   Outlook
                       Highlights       COVID-19                                    and Building Resilience      Pivoting to Digital                              42
P&L HIGHLIGHTS
               Kenya                                       Q1 2021              Q1 2020
                                                                                                                              Group

   NIM        3.3 Bn            3.2 Bn                              Net Interest                  5.0 Bn             4.7 Bn
                                               5%                     Income                                                              6%                  NIM
 4.9% 5.0%
                                                                                                                                                          5.2% 5.4%
                                                                    Total Non-
              0.9 Bn            0.9 Bn                               Interest                     1.6 Bn             1.6 Bn
                                                1.1%                 Income                                                               -2%
   ROE
                                                                       Gross                                                                                  ROE
              4.2 Bn            4.1 Bn                               Operating                    6.5 Bn             6.3 Bn
12.3% 12.2%                                      1%                                                                                       4%
                                                                      Income                                                                           12.3% 12.8%

              1.5Bn             1.5 Bn                               Operating                    2.8 Bn             2.9Bn
                                                 -2%                 Expenses                                                             -3%
   CTI
                                                                                                                                                              CTI
35.2% 37.4%                                                       Operating Profit
              2.8 Bn             2.5Bn                                Before                      4.2 Bn             3.7 Bn                          43.5%      46.4%
                                                 10%                                                                                      13%
                                                                    Provisions

   COR        0.3 Bn            0.2 Bn                               Loan Loss                    0.7 Bn             0.4 Bn
                                                48%                  provision                                                            68%                 COR
0.7%   0.5%
                                                                                                                                                        1.3%    0.8%
                                                                  Profit before Tax
              2.5 Bn            2.4 Bn                                                            3.0 Bn             3.0 Bn                1%
                                                7%                      (PBT)
   NPL
                                                                   Profit after Tax                                                                           NPL
11.7% 6.9%    1.7 Bn            1.6 Bn           5%                     (PAT)                     2.1 Bn             2.0 Bn               0.5%          10.2% 6.7%

                             Macro Economic   DTB’s Response to                       Managing Risks            Remodeling the Business         Financial
                Who We Are                                          DTB’s Strategy                                                              Performance     Outlook
                             Highlights       COVID-19                                and Building Resilience    Pivoting to Digital                                      43
P&L
HIGHLIGHTS
GROUP
                Operating Expenses                                                                                          Credit Impairment
   3,500                                                                  47.0%                                             (KShs Mn)

                                                                          46.5%                              13,055
                         46.4%
   3,000
                                                                          46.0%

   2,500                                                                  45.5%                                                                           10,118

                                                                          45.0%
   2,000
                                                                          44.5%                                     7,448

                                                                          44.0%
   1,500

                                                       43.5%              43.5%                                                                                   4,510
   1,000                                                                  43.0%                                                  2,937     2,938
                                                                          42.5%
    500
                                                                          42.0%

      0                                                                   41.5%
                         Q1 2020                       Q1 2021                                          Credit Impairment General Provision Specific Provision

           Staff Costs      Other Operating Expenses      Cost to Income Ratio                                                Q1 2021           Q1 2020

                                   Macro Economic   DTB’s Response to                     Managing Risks              Remodeling the Business       Financial
                     Who We Are                                          DTB’s Strategy                                                             Performance           Outlook
                                   Highlights       COVID-19                              and Building Resilience      Pivoting to Digital                                          44
P&L
HIGHLIGHTS
                      Subsidiary PBT Contribution (KShs Mn)
                                         1%
                                                42
                                    BR
                                             1% 34

                                             2%

                                 DTBI
                                                      50
                                              2%      53

16%     of Group                   UG
                                         8%              228
                                                         153
                                         5%
PBT contributed
by subsidiaries
                                         5%           155
                                    TZ
                                         6%           354

                                         84%                                                                                                              2,516
                                    KE
                                         86%                                                                                                              2,360

                                                                                        Actual Mar 21         Actual Mar 20
   Better top line performance by
   Uganda has caused the subsidiary
   contribution to improve in 2021.

                            Macro Economic         DTB’s Response to                       Managing Risks             Remodeling the Business   Financial
               Who We Are                                              DTB’s Strategy                                                           Performance       Outlook
                            Highlights             COVID-19                                and Building Resilience     Pivoting to Digital
                                                                                                                                                                            45
KEY FINANCIAL
RATIOS                              Actual              Actual              Actual                Actual
                                    March               March               March                 March
           Kenya                    2021                2020                2021                  2020               Group

         Return on Equity           12.3%              12.2%                12.3%               12.8%

         Return on Asset             2.2%               2.2%                 2.0%                2.1%

               NPL Ratio            11.7%               6.9%                10.2%                6.7%

           NPL Coverage                                                     45.2%               32.0%
                                    44.5%              33.5%
                   Ratio

            Cost of Risk             0.7%               0.5%                 1.3%                0.8%

       Fee Income Ratio             21.8%              22.6%                23.9%               25.4%

      Net Interest Margin            4.6%               5.0%                 5.2%                5.4%

         Cost to Income             35.3%              37.4%                43.5%               46.4%

         Loan to Deposit            73.1%              76.7%                72.5%               76.5%

                           Macro Economic    DTB’s Response to                       Managing Risks            Remodeling the Business   Financial
             Who We Are                                          DTB’s Strategy                                                          Performance   Outlook   46
                           Highlights        COVID-19                                and Building Resilience    Pivoting to Digital
OUTLOOK

                                                                                                                                                   ➢        Cautious optimism on economic rebound.

                                                                                                                                                   ➢        Accelerated rate in balance sheet growth in 2021.

                                                                                                                                                   ➢        NIMS broadly similar to 2020.

                                                                                                                                                   ➢        Continued efforts to reduce DTB’s cost of funds.

                                                                                                                                                   ➢        Lower interest yield.

                                                                                                                                                   ➢        Continued focus on fee income driven by digital products and
                                                                                                                                                            services offerings.

                                                                                                                                                   ➢        Overheads to be tightly controlled with gradual decline in cost to
                                                                                                                                                            income ratio.

                                                                                                                                                   ➢        Cost of risk to remain at elevated levels.

     Forward-looking statements are not statements of fact, but statements made by the Group based on our current estimates, projections, expectations, beliefs and assumptions regarding the Group’s future performance. No assurance can be given that forward-looking statements will be
     correct and undue reliance should not be placed on such statements. These statements, by their nature, involve risk and uncertainty, as they relate to events and depend upon circumstances that may or may not occur in the future. Factors that could cause actual future results to differ
     materially from those in the forward-looking statements include, but are not limited to, changes in (a) global and national economic conditions, (b) our trading environment, (c) future strategies as contained in our strategic priorities and plans included in the strategic trends, (d) interest
     rates, (e) credit conditions and the associated risks of lending, (f) actual cash collections, (g) gross and operating margins, (h) capital management and (i) competitive and regulatory factors. The Group does not undertake to update or revise any of these forward-looking statements
     publicly, whether to reflect new information or future events or otherwise. The Group does not assume responsibility for any loss or damage arising as a result of the reliance by any party thereon, including, but not limited to, loss of earnings, profits, or consequential loss or damage.

                                                      Macro Economic                         DTB’s Response to                                                                   Managing Risks                                      Remodeling the Business                               Financial
                           Who We Are                                                                                                    DTB’s Strategy                                                                                                                                                      Outlook
                                                      Highlights                             COVID-19                                                                            and Building Resilience                              Pivoting to Digital                                  Performance                 47
DTB 2020 INTEGRATED REPORT &
FINANCIAL STATEMENTS

                                                                               Scan here to view the Bank’s 2020 Integrated
                                                                              Report on our website for financial performance
                                                                                     and other qualitative information.

                        Macro Economic   DTB’s Response to                    Managing Risks            Remodeling the Business   Financial
           Who We Are                                        DTB’s Strategy                                                                     Outlook
                        Highlights       COVID-19                             and Building Resilience    Pivoting to Digital      Performance             48
We welcome all feedback via email on
 dtbinvestorrelations@dtbafrica.com
You can also read