Performance assessment of conceptual bifacial solar PV system in varying albedo conditions
←
→
Page content transcription
If your browser does not render page correctly, please read the page content below
IOP Conference Series: Materials Science and Engineering

PAPER • OPEN ACCESS

Performance assessment of conceptual bifacial solar PV system in
varying albedo conditions
To cite this article: S Sreenath et al 2021 IOP Conf. Ser.: Mater. Sci. Eng. 1078 012033

View the article online for updates and enhancements.

 This content was downloaded from IP address 213.184.95.214 on 19/02/2021 at 12:57

IPCME 2021 IOP Publishing
IOP Conf. Series: Materials Science and Engineering 1078 (2021) 012033 doi:10.1088/1757-899X/1078/1/012033

Performance assessment of conceptual bifacial solar PV
system in varying albedo conditions

 S Sreenath1, K Sudhakar2, 3,* and Yusop A F2
 1
 Renewable Energy and Energy Efficiency Research Cluster, Universiti Malaysia
 Pahang, 26600 Malaysia
 2
 Faculty of Mechanical and Automotive Engineering Technology, Universiti
 Malaysia Pahang, 26600 Malaysia
 3
 Automotive Engineering Centre, Universiti Malaysia Pahang, 26600 Malaysia

 *Corresponding author’s email: sudhakar@ump.edu.my

 Abstract: There is a rapidly growing interest in bifacial module based solar PV. Unlike
 conventional solar PV modules, the energy output of the bifacial PV module is affected by the
 reflectance of the ground surface (albedo). This paper aims to assess the performance of
 conceptual bifacial solar PV systems in varying albedo conditions. Besides, the comparison of
 energy generation between monofacial and bifacial solar PV system is carried out. In this regard,
 four sites on an educational campus having different albedo factor is chosen. The annual energy
 output, specific yield, and performance ratio are estimated using PVSyst simulation software.
 The energy output of 164.5 MWh/year is predicted for the minimum albedo factor of 0.15. While
 175.8 MWh/year is expected for the maximum albedo factor of 0.85. The specific yield for Case
 5 (bifacial) is 10.58 % higher than that estimated for Case 1 (monofacial). Based on annual
 energy generation, the site of Case 4 is the best location for the solar PV system among the
 studied cases. It is concluded that setting up of bifacial solar PV module on the ground surface
 with a high value of albedo factor is suitable to maximize energy generation.

 Keywords: Albedo; Bifacial PV Module; Specific Yield; Performance Ratio; PVSyst.

1. Introduction
Solar PV systems are widely employed in renewable energy technology for the past decades. As per the
IRENA report, the installed capacity of the solar PV system crossed 580.159 GW in 2019, and the share
of solar PV system reached 22 % of the installed capacity of renewable energy systems [1]. The PV
modules are the main component of the solar PV system and it performs the function of converting the
sun's energy into electricity. The conventional PV modules can generate electricity from the surface
facing the sun only and those are called mono facial PV modules. A bi-facial solar PV module can
generate power from both sides i.e. the side facing the sun and the side facing away from the sun. The
bifacial solar PV modules are relatively new in the solar market [2]. The current solar market is
dominated by crystalline silicon (cSi) based monofacial PV modules. By 2023, it is expected that the
demand for bifacial modules will reach as high as 40 GW [3]. The absorption of light occurs on both
sides of bifacial solar PV modules. The solar irradiation reflected from the ground is also utilized for
energy generation. The incident solar energy on the bifacial PV module varies with the value of ground

 Content from this work may be used under the terms of the Creative Commons Attribution 3.0 licence. Any further distribution
 of this work must maintain attribution to the author(s) and the title of the work, journal citation and DOI.
Published under licence by IOP Publishing Ltd 1
IPCME 2021 IOP Publishing
IOP Conf. Series: Materials Science and Engineering 1078 (2021) 012033 doi:10.1088/1757-899X/1078/1/012033

reflectance (albedo). Hence, the value of albedo plays an important role in the amount of solar irradiation
reflected on the backside of the bifacial PV module.
 Albedo is defined as the ratio between solar irradiation reflected from the ground and the global solar
insolation incident on the location. The value of albedo for a black surface is 0 as it absorbs all light rays
falling on it. A perfect reflector (white surface) has an albedo value of 1. A bifacial solar PV system is
fixed on different ground surfaces such as grass, bare soil, tarred road, snow-cover. Usually, the albedo
varies between 0.2 (eg: urban locations, grasslands) and 0.8 for snow-covered ground [4]. The ground
surfaces and its albedo factor for common surfaces are Asphalt (0.15), Grass (0.25), Concrete (0.35),
and Aluminum (0.85). PVSyst software is capable to simulate a bifacial solar PV system for a selected
site. Two pyranometers are used for the measurement of Albedo ( one pointing to the sun and the other
facing the ground) [5]. The material selection and bifaciality are the two ways in which the energy output
from solar PV cells can be enhanced [6]. In simulation software such as PVsyst, bifacial PV modules
are characterized by a term called bifaciality factor. It is the ratio of the nominal efficiency at the rear
side and the nominal efficiency of the front side. The ratio of the nominal power output of the PV module
(kW) and the area of the PV module gives the nominal efficiency. So, the irradiance on the rear side can
be added to the front irradiance based on the bifaciality factor during the simulation procedure.
 Many literatures reported the performance of monofacial PV module based solar system using
operational or simulated values. Kumar et al. analyzed the performance of conceptual off-grid solar PV
system situated in educational institute using PVsyst modeling software and estimated that the
performance ratio varied between 86 % in December and 64 % in April (due to the variation in ambient
temperature) [7]. Sukumaran and Sudhakar assessed the performance of the 12 MW solar PV plant
located in Cochin, India using PVSyst software and reported that the average performance ratio (PR)
and final yield as 79.33 % and 4.31 kWh/kWp/day respectively [8]. Kumar and Sudhakar compared the
real performance of the 10 MW solar PV power plant in Ramagundam, India with the predicted
performance from PVsyst software. It was reported that the predicted energy generation (16.05 GWh/
year) matched closely with the monitored energy generation (15.61 GWh/year) [9]. Arora et al. assessed
the performance of 186 kW grid-connected solar PV system located in Haryana, India using PVsyst
software and estimated a PR value of 85.6 % which is in close agreement with the estimated PR using
operational values [10]. Boddapati and Daniel carried out the performance assessment of a single axis
tracked 50 MWp solar PV power plant in Kurnool, India using monitored values and reported that the
PR varied between 75.24 % (October) and 83.44 % (August) [11]. In the energy analysis carried out for
a 10 MWp grid-interactive canal-top solar PV plant by Kumar et al. using multi-year operational data,
it is reported that the monthly average values of final yield varied between 2.46 hours/day (Jul 2017)
and 5.56 hours/day (May 2015) [12]. Ahmad et al. evaluated the energy performance of 250 kW grid-
connected solar PV system (carport) using PVsyst software and disclosed that the performance ratio is
75 %, final yield is 3.80 kWh/kWp/day, and energy generation is 347 MWh/year [13]. Aryal and
Bhattarai assessed the performance of 115.2 kW solar PV power plant situated in Kathmandu, Nepal
using PVsyst simulation software and reported that the solar PV plant will inject 199 MWh of energy
with a performance ratio of 83.5 %, and a specific yield of 1728 kWh/kWp respectively [14]. Abotaleb
and Abdallah compared the performance of two bifacial-silicon solar PV modules, fixed at two different
mounting configurations located in the desert climate of Qatar and reported that the energy yield of a
typical latitude tilted bifacial PV module is about 14 % higher than the vertically tilted (east-west)
configuration [15]. Katsaounis et al. compared the daily energy yield of a set of monofacial and bifacial
PV module located on the western side of Saudi Arabia and reported that the gain of a bifacial PV
module is 10 % and 15 % for a tilt angle of 25° and 45° respectively when compared to the monofacial
PV module [16].
 From past literature, it is observed that many authors reported the performance of conceptual solar
PV systems using PVSyst software. However, only a handful of these literature studied the performance
of bifacial solar PV modules. As per the author’s knowledge, the performance of the bifacial solar PV
system in varying albedo conditions of educational institutions has not been reported yet. The objectives
of the present study are to evaluate the energy performance of monofacial solar PV system located in a

 2
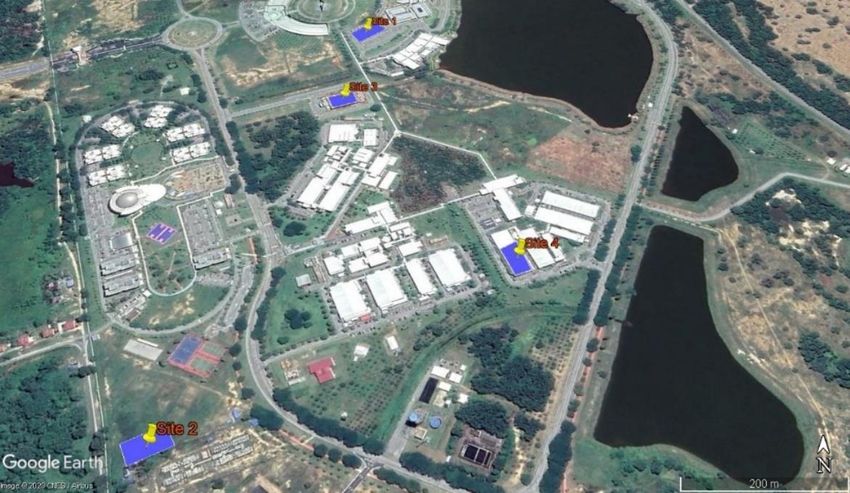
IPCME 2021 IOP Publishing
IOP Conf. Series: Materials Science and Engineering 1078 (2021) 012033 doi:10.1088/1757-899X/1078/1/012033

university campus, to estimate the energy performance of bifacial solar PV system situated in the
educational institution for different albedo conditions, to compare the energy generation between
monofacial and bifacial solar PV system. The best location for solar PV among the selected locations
based on annual electricity generation is also estimated.

2. Methodology

2.1 Site selection
A grid-connected solar PV system is proposed for the Pekan campus of Universiti Malaysia Pahang
(UMP) which is situated in Pahang state, Malaysia. The co-ordinates of UMP Pekan are 3.54°N latitude
and 103.43°E longitude respectively. It is located at about 12 meters from the sea level. The Pekan
campus of UMP covers nearly 642 acres and has vacant areas for the installation of solar PV systems.
The on-site solar energy generation supports reducing energy costs and green campus initiatives [17].
A 100 kW solar PV system is proposed for the educational institution. The sites for solar PV installation
are chosen using Google map. Different foreground surfaces such as concrete rooftops, aluminum roofs,
grasslands, and tarred surfaces (car parking) are selected (Table 2). Figure 1 shows the position of the
chosen sites in the educational institution.

 Figure 1. Position of selected sites for proposed solar PV in educational institution.

2.2 System Description
A 100 kW solar system is proposed in this study. The solar PV system mainly consists of PV modules,
inverters, and the balance of the system. Since the proposed solar PV is grid-connected, battery banks
are not included. This proposed solar PV system is assumed to be interconnected with the existing
electrical facility. The chosen monofacial and bifacial solar PV modules have a power rating of 520 Wp.
The conversion efficiency of the monofacial PV module is assumed as 20.39 % and the bifacial PV
module is assumed as 22.48 %. The PV array is fixed at a 10° tilt angle and oriented towards the south
direction [18]. An inverter with a nominal power of 100 kW is selected for the proposed system. The
typical meteorological year climate data is collected from the database of PVGIS ( cell 3° to 4° latitude
(111km) and 103° to 104° (111km) longitude). The selected location receives annual solar irradiation
of 1830.4 kWh/m2 and observes the average annual temperature of 26.15 °C (Table 1).

 3
IPCME 2021 IOP Publishing
IOP Conf. Series: Materials Science and Engineering 1078 (2021) 012033 doi:10.1088/1757-899X/1078/1/012033

 Table 1. Monthly variation of climate parameters in the selected educational institution.

 Months Global Horizontal Ambient temperature Wind Speed
 Irradiation (kWh/m2) (°C) (m/s)
 Jan 141.7 24.69 4.65
 Feb 149.7 25.32 4.10
 Mar 147.7 25.04 3.45
 April 186.0 26.70 3.66
 May 159.2 27.12 2.19
 June 149.5 27.27 2.13
 July 170.1 27.13 4.30
 Aug 171.1 26.49 2.97
 Sept 164.0 26.67 2.84
 Oct 160.8 26.36 2.28
 Nov 113.2 25.79 3.35
 Dec 117.5 25.17 4.41

2.3 PVsyst software
PVSyst software is one of the widely used PV simulation software among energy professionals and
academic researchers [8][10]. This software is capable of estimating the energy performance of solar
PV systems such as grid-connected, stand-alone, pumping, and DC-grid. The simulation results from
PVsyst are grouped in the form of a report which can be divided into three sections. All the main input
parameters given for the simulation are provided in the first section. The second part includes the main
results of the simulation, with a monthly table and graphs of normalized values. The third section
contains an arrow loss diagram that showcases the system's behavior, with all detailed losses. PVSyst
provides two different 2D models for estimating the energy performance of the bifacial solar PV system.
The ‘‘unlimited sheds’’ model is suitable for fixed-tilt systems and the ‘‘unlimited trackers’’ model is
appropriate for horizontal single-axis tracking systems. In the ‘‘unlimited sheds’’ 2D model, it is
assumed that the bifacial PV array has a single orientation, equal distance with adjacent PV arrays, and
a very large area (to exclude edge effect). To simplify the bifacial calculation, the mutual shading
between PV arrays from a single direction is only considered [19]. In the simulation, the users are
required to configure the bifacial PV module, inverter’s specifications, number of modules in series, and
number of strings. Also, there is an option to choose bifacial PV modules that are available in the
databases. In the “General Simulation Parameter “dialogue box, the parameters such as albedo value,
shading factor, mismatch loss, and other basic parameters for simulation can be configured. The shed
parameters such as tilt & azimuth angle shed width, height above ground can be configured inside the
dialogue box of ‘‘unlimited sheds’’.

2.4 Simulation procedure
At first, the geographical location of the proposed solar PV plant is specified and the corresponding
meteorological data is chosen from the built-in database. A basic solar PV system variant is defined by
the user. It includes the orientation of the PV modules, the proposed power capacity, and the model of
PV module & inverter [7]. Based on this, a basic configuration is proposed by PVsyst. In this study, this
basic PV array configuration consists of 198 numbers of solar PV modules, 11 strings of 18 modules in
series. Also, reasonable default values for all parameters that are required for the simulation are prefilled
by the software. These parameters include far shadings, near shadings, specific loss parameters. The
economic evaluation of the proposed solar PV system is not considered in the present analysis. The
albedo values are adjusted deliberately based on the foreground surface of the selected solar PV site and
its application. The simulation is carried out for 5 different cases as shown in Table 3. Except in case 1,
bifacial PV modules are considered in all other cases. For each simulation, the albedo value is entered

 4
IPCME 2021 IOP Publishing
IOP Conf. Series: Materials Science and Engineering 1078 (2021) 012033 doi:10.1088/1757-899X/1078/1/012033

depending on the type of ground surface on which the solar PV system is positioned. Ground reflectance
values for the chosen ground surface is obtained from the webpage of PVSyst software [20].
 Table 2. Different cases considered in the present study

 Studied Site Name PV Technology used Type of sites Site ground Albedo
 Case Surface factor
 Case 1* NA cSi-Monofacial NA NA NA
 Case 2 Site I cSi-Bifacial Car park area Asphalt 0.15
 Case 3 Site II cSi-Bifacial Open space Grass 0.25
 Case 4 Site III cSi-Bifacial Concrete roof Concrete 0.35
 Case 5 Site IV cSi-Bifacial Metal rooftop Aluminum 0.85
 *Case 1 is considered as the base case, NA- Not Applicable

2.5 Performance assessment
In this study, the energy performance of bifacial and monofacial solar PV systems is assessed based on
the values of energy generation, specific yield, performance ratio. These values are obtained through the
PVSyst software simulations which are carried out for the five cases considered in the study [21].
(a) Annual Energy generation (Egrid): It accounts for the energy output from the solar PV system in a
year (365 days). The total amount of electrical energy fed into the grid is the cumulative sum of daily
generated energy (Ed). The yearly energy generation is given by equation 1.

 365

 = ∑ (1)
 =1

(b) Specific yield (SYa): It is defined as the amount of electrical energy (kWh) that is generated for
every kW of installed capacity over a period. Annual specific yield is the ratio of energy output from
the solar PV system in a year (Egrid) and the installed capacity (Po) as given in equation 2.

 =
 (2)

(c) Performance ratio (PR): The ratio between the energy that is available for feeding to the grid and the
theoretically possible energy generation from the solar PV array is termed as performance ratio. The
theoretical energy generation is the product of solar irradiation (kWh/m2) on the PV array, area of PV
array (m2), and PV module efficiency. It is also defined as the ratio between the final yield and the
reference yield. PR is an important metric that is commonly used in the performance assessment of the
solar PV system. Higher values of PR correspond to a higher amount of solar irradiation being
transformed into electrical energy.

 =
 × × (3)

3. Results and discussions
The performance analysis of the proposed 100 kW solar PV system in five different cases is presented
in this section. These results are obtained through simulation using PVsyst software.

 5
IPCME 2021 IOP Publishing
IOP Conf. Series: Materials Science and Engineering 1078 (2021) 012033 doi:10.1088/1757-899X/1078/1/012033

3.1 Energy analysis
It is to be noted that the nameplate power of both the monofacial and bifacial PV module is intentionally
chosen to be identical as 520 Wp. The monthly variation of energy generation and PR for Case 1 is
depicted in Figure 2. The maximum energy generation is observed in April (15.62 MWh) and the
minimum energy output is found in November (10.36 MWh). The annual energy generation in this base
case is 159.01 MWh. The PR is almost constant with only a 2 % difference between maximum and
minimum values. The variation of energy output and performance ratio for Case 2 is given in Figure 3.
The energy generation varied between 16.14 MWh (April) and 10.7 MWh (November). The annual
energy generation is estimated to be 164.45 MWh which is 5.44 MWh more than the base case value.
This can be attributed to the enhanced solar energy input using bifacial solar PV modules. The average
value of PR is 0.88 with the slightest monthly variation. Figure 4 depicts the monthly variation of energy
generation and PR for Case 3. The maximum energy generation is observed in April (16.51MWh) and
the minimum energy output is found in November (10.93 MWh). The PR reached 0.90 for most of the
months with the least monthly variation. This value is higher than the base case PR value of 0.85. The
variation of energy output and performance ratio for Case 4 is given in Figure 5. The annual energy
generation is estimated to be 172.01 MWh which is 7.5 % more than the base case value. This can be
attributed to improved performance using bifacial PV modules and increased ground reflectance (0.35).
The value of PR varied between 0.91 (April) and 0.93 (June). Figure 6 depicts the monthly variation of
energy generation and PR for Case 5. The maximum energy generation is observed in April (17.23
MWh) and the minimum energy output is found in November (11.39 MWh). The annual energy
generation and average PR is 175.78 MWh and 0.94 respectively which is the highest value among the
studied cases. This increase in values can be attributed to bifacial PV technology employed in high
albedo conditions.

 20 Egrid PR 0.9
 20 E grid ( MWh) 0.90

 15 0.85
 15 0.85
 MWh

 ratio

 10 0.8
 MWh

 Ratio
 10 0.80

 5 0.75
 5 0.75

 0 0.7 0 0.70
 April

 July
 Jan
 Feb
 Mar

 May
 June

 Aug

 Nov
 Sept

 Dec
 Oct

 July

 Nov
 Feb

 May
 Jan

 Mar

 June

 Aug
 April

 Sept

 Dec
 Oct

 Month Months
 Figure 2. Monthly variation of energy Figure 3. Monthly variation of energy
 generation and PR for case 1 generation and PR for case 2

 6
IPCME 2021 IOP Publishing
IOP Conf. Series: Materials Science and Engineering 1078 (2021) 012033 doi:10.1088/1757-899X/1078/1/012033

 18 E grid ( MWh) 0.95
 E grid ( MWh)
 20 0.95 16
 14 0.9
 15 0.9 12
 10

 MWh

 ratio
 MWh

 ratio
 10 0.85 0.85
 8
 6
 5 0.8 4 0.8
 2
 0 0.75 0 0.75
 July
 Aug
 Jan

 June
 Feb
 Mar

 May

 Nov
 April

 Sept
 Oct

 Dec

 July
 Aug
 Jan

 June
 Feb
 Mar

 May

 Nov
 April

 Oct
 Sept

 Dec
 Month
 Month

 Figure 4. Monthly variation of energy Figure 5. Monthly variation of energy
 generation and PR for case 3 generation and PR for case 2
 20 E grid ( MWh) 1

 15 0.95
 MWh

 ratio

 10 0.9

 5 0.85

 0 0.8
 June
 July
 Jan
 Feb
 Mar

 May

 Aug

 Nov
 April

 Sept

 Dec
 Oct

 Month
 Figure 6. Monthly variation of energy
 generation and PR for case 5

3.2 Discussions
The comparison between 5 cases in terms of three technical parameters is provided in Figure 7. The
monofacial solar PV system in Case 1 has the lowest value of energy generation, specific yield, and PR.
Solar PV systems in all other sites have shown improvement in specific yield and PR which can be
attributed mainly to the use of bifacial PV modules. Among these sites, a relative increase in energy
generation is observed with the increasing value of albedo. Among the studied cases, it is observed that
monthly variation in PR is minimal. Also, the peak value of energy generation occurred in April. This
can be attributed to the least difference in the climatic condition and identical system design. Park et al.
reported the specific yield for 1.5 kW bifacial solar PV system as 1351 kWh/kWp for an albedo of 0.21
(grey concrete) based on outdoor experiment [22]. Since higher energy output is possible for the same
module area of bifacial PV modules, the cost needed for the balance of system (BOS) will be lesser than
the conventional system [2]. The design and widespread implementation of bifacial solar PV is also
influenced by the availability of an accurate reliable simulation model. Most of the PV simulation
software is capable of energy estimation of monofacial solar PV only. Apart from PVSyst, software
tools like SAM and Bifacial_Radiance can be used to design and predict the energy generation of bifacial
solar PV system [23].

 7
IPCME 2021 IOP Publishing
IOP Conf. Series: Materials Science and Engineering 1078 (2021) 012033 doi:10.1088/1757-899X/1078/1/012033

 200 1750
 Egrid PR Specific Yield

 Specific Yield (MWh/ annum )
 Egrid (MWh) & PR (% ) 1700
 150
 1650

 100 1600

 1550
 50
 1500

 0 1450
 Case 1 Case 2 Case 3 Case 4 Case 5
 Studied cases
 Figure 7. Comparison of performance of proposed solar PV system in the studied cases.

4. Conclusions
In this paper, the performance of bifacial solar PV systems in varying albedo is assessed using PVSyst
software. The albedo of four common ground surfaces in an educational institution is considered. The
energy generation and PR value for the monofacial solar PV system (Case 1) are 159 MWh/year and
0.85 respectively. The specific yield and PR at Case 5 (bifacial) is 10.58 % higher than that estimated
for Case 1 (monofacial). An improvement in energy generation is observed with the increasing value of
the albedo. The energy output for an albedo factor of 0.15 is 164.5 MWh/year. While 175.8 MWh/year
is obtained for an albedo factor of 0.85. Based on annual energy generation, site 4 is the best location
for the solar PV system among the studied cases. This can be attributed to two factors. Firstly, the bifacial
solar PV module is used in Case 4. Secondly, the albedo value is highest for the ground surface of Site
4. The limitations of the study include the absence of analysis on the economic and social impact of the
bifacial solar PV system in an educational institution. The selected sites receive an ample amount of
rain. However, the impact of moisture on the albedo of selected ground surfaces is not considered in the
present study. The share of the bifacial module in solar PV installation is expected to increase in near
future. So, the present study will be beneficial to energy professionals, solar project developers, and
investors. The future work is to carry out the economic analysis of such a solar PV system in Malaysian
condition and compare it with monofacial solar PV plants. The effectiveness of the application of highly-
reflective paints and/or building materials on foreground surfaces of the bifacial solar PV system can be
studied further.
Acknowledgments
The authors are grateful for the financial support provided by the Universiti Malaysia Pahang
(www.ump.edu.my) through the Doctoral Research Scheme (DRS) and PGRS1903172. The
assumptions and case studies reported in this article are only examples that are based on limited open-
source information. The opinion, facts, findings, insights, and discussions in the document are solely of
the authors and do not necessarily reflect the opinion of any organization involved directly or indirectly.
Hence the authors are not responsible for any consequences thereof with the use of information
presented in this work.
Data availability
The data in this research can be shared upon request only due to the inclusion of third-party information.

Conflict of interest statement
The authors declare that they have no known competing financial interests or personal relationships that
could influence the work reported in the submitted manuscript.

 8
IPCME 2021 IOP Publishing
IOP Conf. Series: Materials Science and Engineering 1078 (2021) 012033 doi:10.1088/1757-899X/1078/1/012033

References
[1] “Renewable Energy Technologies,” International Renewable Energy Agency (IRENA), 2019.
 www.irena.org/Statistics/View-Data-By-Topic/Capacity-and-Generation/Technologies
 (accessed Apr. 18, 2020).
[2] T. S. Liang et al. 2019 A review of crystalline silicon bifacial photovoltaic performance
 characterisation and simulation, Energy and Environmental Science, vol. 12, pp. 116–148
[3] M. Hutchins, “The long read: All about albedo,” pv magazine, 2020.
[4] C. W. Thurston, “NREL Builds First Solar Database For Bifacial Albedo,” CleanTechnica, 2019.
 https://cleantechnica.com/2019/02/18/nrel-builds-first-solar-database-for-bifacial-albedo/
 (accessed Nov. 10, 2020).
[5] B. Marion, “Albedo Data to Facilitate Bifacial PV System Planning,” 2019.
[6] A. Hasan and I. Dincer 2020 A new performance assessment methodology of bifacial photovoltaic
 solar panels for offshore applications, Energy Convers. Manag., vol. 220, p. 112972
[7] R. Kumar, C. S. Rajoria, A. Sharma, and S. Suhag 2020 Design and simulation of standalone
 solar PV system using PVsyst Software: A case study, Mater. Today Proc.
[8] S. Sukumaran and K. Sudhakar 2017 Fully solar powered airport: A case study of Cochin
 International airport, J. Air Transp. Manag., vol. 62, pp. 176–188
[9] B. Shiva Kumar and K. Sudhakar 2015 Performance evaluation of 10 MW grid connected solar
 photovoltaic power plant in India, Energy Reports, vol. 1, pp. 184–192
[10] R. Arora, R. Arora, and S. N. Sridhara 2019 Performance assessment of 186 kWp grid interactive
 solar photovoltaic plant in Northern India, Int. J. Ambient Energy
[11] V. Boddapati and S. A. Daniel 2020 Performance analysis and investigations of grid-connected
 Solar Power Park in Kurnool, South India, Energy Sustain. Dev., vol. 55, pp. 161–169
[12] M. Kumar, S. S. Chandel, and A. Kumar 2020 Performance analysis of a 10 MWp utility scale
 grid-connected canal-top photovoltaic power plant under Indian climatic conditions, Energy,
 p. 117903
[13] O. A. Ahmad, W. H. Habeeb, D. Y. Mahmood, K. A. Jalal, and H. Sayed 2019 Design and
 performance analysis of 250 kw grid-connected photovoltaic system in iraqi environment
 using pvsyst software, Indones. J. Electr. Eng. Informatics, vol. 7, pp. 415–421
[14] A. Aryal and N. Bhattarai 2018 Modeling and Simulation of 115.2 kWp Grid-Connected Solar
 PV System using PVSYST, Kathford J. Eng. Manag., vol. 1, pp. 31–34
[15] A. Abotaleb and A. Abdallah 2018 Performance of bifacial-silicon heterojunction modules under
 desert environment, Renew. Energy, vol. 127, pp. 94–101
[16] T. Katsaounis et al. 2019 Performance assessment of bifacial c-Si PV modules through device
 simulations and outdoor measurements, Renew. Energy, vol. 143, pp. 1285–1298
[17] C. Dondariya, D. Porwal, A. Awasthi, and A. Kumar 2018 Performance simulation of grid-
 connected rooftop solar PV system for small households: A case study of Ujjain , India, Energy
 Reports, vol. 4, pp. 546–553
[18] S. Sreenath, K. Sudhakar, and A. F. Yusop 2020 Technical assessment of captive solar power
 plant : A case study of Senai airport , Malaysia, Renew. Energy, vol. 152, pp. 849–866
[19] PVSyst, “PVsyst 7 Help,” PVSyst, 2019.
 https://www.pvsyst.com/help/index.html?bifacial_module.html (accessed Dec. 10, 2020).
[20] PVSyst, “Albedo coefficient,” PVSyst, 2020. https://www.pvsyst.com/help/albedo.htm%0A
 (accessed Nov. 10, 2020).
[21] K. A. Kumar, K. Sundareswaran, and P. R. Venkateswaran 2014 Performance study on a grid
 connected 20kWp solar photovoltaic installation in an industry in Tiruchirappalli (India),
 Energy Sustain. Dev., vol. 23, pp. 294–304
[22] H. Park, S. Chang, S. Park, and W. K. Kim 2019 Outdoor performance test of bifacial n-type
 silicon photovoltaic modules, Sustain., vol. 11
[23] C. Deline, S. A. Peláez, B. Marion, B. Sekulic, M. Woodhouse, and J. Stein 2019 Bifacial PV
 System Performance: Separating Fact from Fiction

 9
You can also read