Lower South Island Distributed Generation Impact Study
←
→
Page content transcription
If your browser does not render page correctly, please read the page content below
Lower South Island
Distributed Generation Impact Study
                                           Document: MEL-R3058, Rev 04

                                                 Project Reference: TP3377

                                                                        April 2017

 Prepared for:                            Prepared by:
 Transpower NZ Ltd                        Mitton ElectroNet Ltd
 Address : 96 The Terrace, Wellington     PO Box 6138, CHCH, 8442, NZ
 P +64 9590 6046                          P +64 3 335 1100
 Web: transpower.co.nz                    Web: mittonelectronet.com
Quality Assurance Record

Project Description: Investigation into the impact of Distributed Generation on the Lower
South Island transmission system

Document Number:           MEL-R3058, Rev 04

Project Reference:         TP3377

File name:                 MEL-3058 Lower South Island Distributed Generation Impact Study
                           Rev 04.docx

                                              Revision Log

Rev         Date                Description                       Signed            Name
                                                       Prepared                B. Henderson
                        Draft issue to Client for
 00       24/02/2017                                   Reviewed
                        initial feedback
                                                       Approved

                                                       Prepared                B. Henderson
                        Revised supply TX numbers
                        after correcting model         Reviewed                N. Adam
 01       14/03/2017
                        error. Added grid backbone
                        studies.
                                                       Approved                P. Armstrong

                                                       Prepared                B. Henderson
                        Revised report and analysis
                                                       Reviewed                N. Adam
 02       27/03/2017    after feedback from
                        Transpower
                                                       Approved                P. Armstrong

                                                       Prepared                B. Henderson
                        Minor amendments
 03       03/04/2017    following further              Reviewed                N. Adam
                        Transpower comments.
                                                       Approved                B. Rooney

                                                       Prepared                B. Henderson

                        Analysis updates, following
 04                                                    Reviewed                N. Adam
          18/04/2017    updated load forecast.
(draft)
                        (Draft for TP Grid Planning)
                                                       Approved                P. Armstrong

                                                       Prepared                B. Henderson

                        Analysis updates, following
 04       19/04/2017                                   Reviewed                N. Adam
                        updated load forecast.

                                                       Approved                A. Beddard

© Mitton ElectroNet Ltd                                                             Page 2 of 29
MEL-R3058, Rev 04, April 2017
Executive Summary
Transpower engaged Mitton ElectroNet (MEL), to undertake network analysis studies, to assist
Transpower in meeting their obligations under Part 6 Schedule 6.4 of the Code, specifically
with regard to the Lower South Island (LSI) region.
Methodology
As agreed with Transpower, MEL has undertaken this analysis using previous analysis
methodologies, developed as part of the published 2015 Transmission Planning Report [1]
(TPR). The latest load forecast data for 2017 was included within the load-flow model, used for
the analysis.
The analysis focuses on determining the Distributed Generation (DG) “required”, to maintain
N-1 security until 2025. Three grid areas were considered sequentially:
1. Supply transformer and spur line capacity for Grid Exit Points (GXPs).
2. Regional interconnected grid capacity (110 kV transmission lines and interconnecting
transformers).
3. Grid backbone; principally, 220 kV lines utilised for inter-area transfer. For example, for
transferring power from the Lower South Island (LSI) to the Waitaki Valley and HVDC
link, or vice versa, when regional generation is low.
In all three grid areas, analysis was completed by comparing the differences between:
a “DG ON” scenario, with DG contributing to the network, according to their measured
recent contribution at times of network peak demand; and
a “DG OFF” scenario, with all DG switched off.
DG found to be required in the GXP and spur lines’ analysis, was considered ON in the regional
grid studies. Similarly, DG found to be required in the GXP and spur line’ analysis, or regional
grid studies, were considered ON in the grid backbone DG OFF studies.
Analysis Results
For the supply transformer and spur line analysis, five GXPs were identified as requiring DG, to
meet N-1 security:
Cromwell (Winter from 2019 and Summer from 2021);
Naseby (Winter and Summer, from 2017);
Halfway Bush (Winter only, from 2017);
Frankton (Winter only, from 2019); and
North Makarewa (Summer only, from 2025).
The availability of DG at these substations, means that Transpower can delay potential grid
investment, required to resolve N-1 security issues. These DGs were subsequently assumed to
be in service for the DG OFF scenarios, where required, in the regional grid and grid backbone
studies.
For the regional grid analysis, one N-1 security issue was identified, which was affected by LSI
DG. A thermal overload of the Edendale – Invercargill line will occur, following an outage of the
Gore – Roxburgh line, in Summer 2017. The issue is resolved following the commissioning of
the Gore interconnector, in 2018. DG at Balclutha, Gore, Berwick and Halfway Bush all reduce
the line loading, but only Berwick DG is of sufficient size to completely mitigate the overload.
Based on this result, all of these DG contributions were assumed ON, for the subsequent 2017
Summer grid backbone analysis.
For the grid backbone analysis, which assessed transmission line thermal capacity, for power
transfer to the North and voltage stability, for power transfer to the South, the following was
found:
© Mitton ElectroNet Ltd Page 3 of 29
MEL-R3058, Rev 04, April 2017
DG increases the likelihood of a thermal constraint, for northwards power transfer. The
effect is relatively small and is only apparent in Summer.
DG improves Southland voltage stability, for southwards power transfer and hence the
maximum regional load which can be supplied, when DG is ON, is slightly higher than
when DG is OFF.
Overall, the impact of DG on the grid backbone is complex and depends on whether the LSI is
exporting or importing power. The DG can increase or decrease transmission limits and on
balance, it is not possible to say that DG is required for grid backbone security. However, it
does change the system power flows and its influence should be considered, as part of future
planning work.
Conclusions
The results of analysis completed as part of this study, show that DG is required at eight LSI
GXPs. These are:
Cromwell (Winter from 2019 and Summer from 2021);
Naseby (Winter and Summer, from 2017);
Halfway Bush (Winter from 2017 and Summer in 2017 only);
Frankton (Winter only, from 2019);
North Makarewa (Summer only, from 2025);
Balclutha (Summer 2017 only);
Gore (Summer 2017 only); and
Berwick (Summer 2017 only).
Determining the effect of the DG is a case-by-case assessment and the requirement depends
on the relative magnitude of the GXP load and the size of the DG and supply transformers.
Assessing the impact of DG on regional and grid backbone security is more complex, where the
effects can be both positive and negative on transmission constraints.
We note that DG impacts on the transmission system are dependent on the regional grid
configuration, the capacity of the grid and the distributed generation contribution, at times of
peak load.
We also note that this study has a narrow focus and that there are factors which have not
been accounted for within this analysis, including, but not limited to:
A potential reduction in transmission system losses. DG generally supplies load close to
the point of supply and can reduce loading on the transmission system, which generally
reduces system losses.
Potential displacement of more expensive marginal generation. By reducing the amount
of dispatched market generation, overall generation prices could be lower. Detailed
analysis on this has not been undertaken and it is possible that the DG could be
inflationary on energy prices also. Note that this only applies to those DGs which are
not market based; that is, they don’t offer into the electricity market.
Operational flexibility. Transpower can benefit from DG, if it can be contracted “ON”,
during times of grid maintenance, when the security criteria effectively becomes N-1-1,
where not having the DG available might otherwise introduce system constraints.
No analysis was completed on time periods other than peak Winter and peak Summer,
due to the time constraints of this study. Consideration of additional scenarios, such as
the shoulder period, would improve the robustness of the analysis.
© Mitton ElectroNet Ltd Page 4 of 29
MEL-R3058, Rev 04, April 2017Contents
1 Introduction .............................................................................................................. 6
2 Background ............................................................................................................... 6
3 Methodology and Assumptions .................................................................................. 9
3.1 Network Overview .................................................................................................. 10
3.2 Model Adjustments and Assumptions ........................................................................ 10
3.2.1 Committed Upgrade Projects ............................................................................ 10
3.2.2 TPR Model Modifications .................................................................................. 11
3.2.3 Line and Transformer Ratings ........................................................................... 11
3.3 Distributed Generation Network Contribution ............................................................. 11
3.3.1 Representation of DG for System Planning Studies .............................................. 11
3.3.2 Average DG GXP Contribution During Network Peak ............................................ 11
3.3.3 Contribution of Wind Generation ....................................................................... 12
3.3.4 Combined DG Contribution by GXP .................................................................... 12
3.4 Load Forecasts ...................................................................................................... 12
3.5 Methodology for Identifying Required DG .................................................................. 15
4 Analysis of DG Effect on the Transmission System ................................................... 17
4.1 Local Supply Issues ................................................................................................ 17
4.2 Regional Grid Issues ............................................................................................... 19
4.2.1 Oamaru – Studholme - Bells Pond Tee – Waitaki Thermal Overloading ................... 19
4.2.2 Oamaru – Black Point - Waitaki Thermal Overloading ........................................... 19
4.2.3 Waitaki Interconnector Capacity ....................................................................... 19
4.2.4 Edendale – Invercargill Thermal Overloading ...................................................... 19
4.2.5 Naseby – Roxburgh Thermal Overloading ........................................................... 20
4.3 Regional Contingency Analysis Discussion .................................................................. 20
Grid Backbone Issues ...................................................................................................... 21
4.3.1 Livingstone – Naseby – Roxburgh Transmission Constraint (Regional Export Limit) .. 21
4.3.2 South Transfer Voltage Stability Limit (Regional Import Limit) .............................. 22
4.3.3 Summary of Grid Backbone Assessment ............................................................ 22
5 Conclusions ............................................................................................................. 23
6 Bibliography ............................................................................................................ 24
Appendix A GIP and GXP List ......................................................................................... 25
Appendix B Load Power Factor ...................................................................................... 27
Abbreviations
CUWLP Clutha Upper Waitaki Lines Project
DG Distributed Generation
DGPP Distributed Generation Pricing Principles
EA Electricity Authority
GIP Grid Injection Point
GXP Grid Exit Point
LSI Lower South Island
SLD Single Line Diagram
TPR Transmission Planning Report
© Mitton ElectroNet Ltd Page 5 of 29
MEL-R3058, Rev 04, April 20171 Introduction
Transpower engaged Mitton ElectroNet (MEL) to undertake network analysis studies, to assist
Transpower in meeting their obligations under Part 6 Schedule 6.4 of the Code [2]. This report
focuses on those obligations, with regard to the Lower South Island (LSI) region.
2 Background
Under Transpower’s obligations for Part 6 Schedule 6.4 of the Code, it must provide a report
which identifies which Distributed Generation (DG), located in each of the four defined grid
pricing regions, is required by Transpower, to meet the grid reliability standards (GRS).
The four pricing areas are:
Lower South Island (LSI)
Upper South Island (USI)
Lower North Island (LNI)
Upper North Island (UNI)
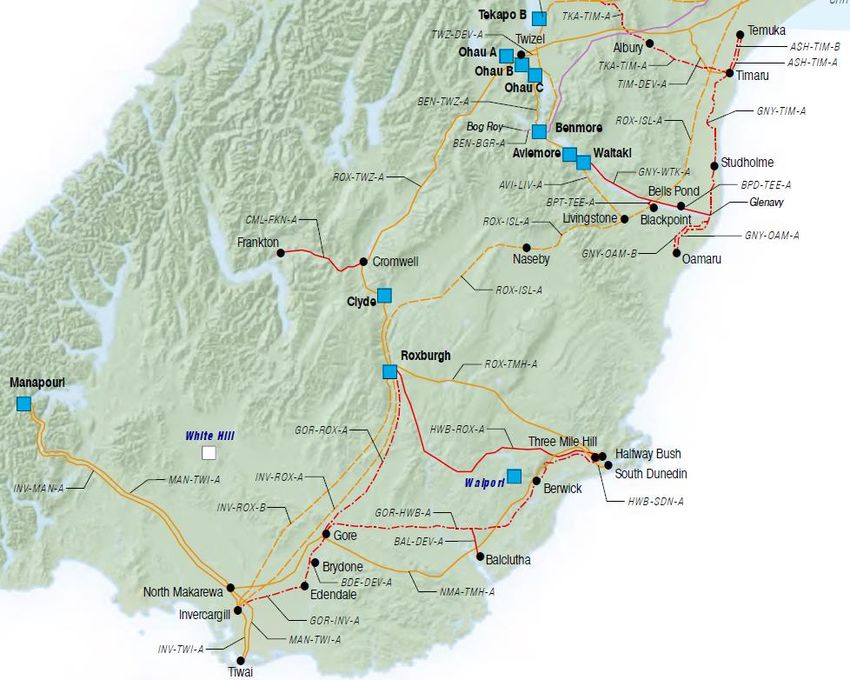
Each of these areas shall be investigated separately, with the first area being the LSI. The LSI
region is defined, according to the Code [2], as that part of the South Island situated to the
South of a line passing through 43°30'S and 169°30'E and 44°40'S and 171°12'E. Figure 1
shows the location of this line, relative to Transpower’s major assets in this region. Effectively,
this includes all substations and assets South of Tekapo B and Studholme inclusive.
We note that the definition of the LSI is based on a pricing region and does not necessarily
fully align with the electrical network. Nonetheless, a demarcation between Tekapo B and
Studholme allows for a simple separation of the upper and lower South Island regions, for the
purpose of network studies.
USI
LSI
Figure 1 - Lower South Island (LSI) Region
To identify DG required by the grid, the analysis presented in this report undertakes an N-1
contingency analysis, to identify situations where Transpower may not be able to maintain N-1
security to its Grid Exit Points (GXPs), if the DG were not available.
© Mitton ElectroNet Ltd Page 6 of 29
MEL-R3058, Rev 04, April 2017N-1 is a common network planning criteria, used throughout the world. It is defined as the
ability of the network to be able to supply all load, in the event of a contingency (fault or
equipment outage) of a single network component. Usually, the single network component is a
supply transformer or transmission line, but it can also be a substation bus section, or
secondary item, such as a Current Transformer (CT) or a Voltage Transformer (VT), an outage
of which might cause a primary component outage.
Consider a typical 110 kV Transpower GXP, shown in Figure 2. The N-1 capacity of the
substation is 30 MVA, which is determined following an outage of one of the two supply
transformers. If there is a 10 MVA DG at the GXP, which provides an average 10 MVA of
capacity at network peak times, then this would increase the N-1 supply capacity of the GXP to
40 MVA. Hence, in this example, the substation can supply 40 MVA of load. Without the DG,
the capacity would be 30 MVA.
If the DG was not available to meet the load, then Transpower would have to invest in the
substation, by upgrading the transformer capacity, or engaging in load shedding (or ask the
distribution utility to shift load, if possible) during a transformer outage, at peak times. It
follows, in this example, that there is a measurable requirement of the DG to maintain N-1
security.
Figure 2 - Typical 110 kV GXP
The example above also applies to so-called “spur lines”, which are the only connection to a
non-meshed area of the transmission system. The spur line and supply transformer N-1
capacity, is considered in the first stage of the analysis, presented within this report.
In the second stage of the analysis, the study is extended to consider the larger area regional
security. In this case, it is possible that DG could prevent lines and interconnector
transformers from overloading post contingency and also prevent network voltage excursions
outside of the acceptable bands, defined in the Code.
Finally, in the third stage of the analysis, two of the limiting grid backbone issues are
examined, to see if DG is required to maintain grid security.
It is worth emphasising that the focus of this analysis is narrow: that is, it looks at how DG
affects transmission system N-1 security of supply only. There are other possible factors which
DG influences in the transmission system, including, but not limited to:
© Mitton ElectroNet Ltd Page 7 of 29
MEL-R3058, Rev 04, April 2017 Transmission system losses. DG generally supplies load close to the point of supply and
can reduce loading on the transmission system, which generally reduces system losses.
Displacement of more expensive marginal generation. By reducing the amount of
dispatched market generation, overall generation prices could be lower. Detailed
analysis on this has not been undertaken and it is possible that the DG could be
inflationary on energy prices also. Note that this only applies to those DGs which are
not market-based; that is, they don’t offer into the electricity market.
Operational flexibility. Transpower can benefit from DG, if it can be contracted “ON”,
during times of grid maintenance, when the security criteria effectively become N-1-1,
where not having the DG available might otherwise introduce system constraints.
No analysis was completed on time periods other than peak Winter and peak Summer,
due to the time constraints of this study. Consideration of additional scenarios, such as
the shoulder period, would improve the robustness of the analysis.
© Mitton ElectroNet Ltd Page 8 of 29
MEL-R3058, Rev 04, April 20173 Methodology and Assumptions Transpower has an existing transmission planning process, which indicates to the industry the grid investment required to maintain the grid reliability. The outcome of this process is the biennial production of the Transmission Planning Report (TPR), of which 2015 is the most recent edition [1]. The document considers proposals for possible grid investment, to manage N-1 security issues and uses a forward planning horizon of 15 years, based on the latest regional load forecasts. For this analysis, the methodology used within the TPR process has been adapted, to undertake a comparison over a shortened planning horizon of eight years, until 2025. This analysis contrasts grid capability, between a “DG ON” scenario, with DG connected to the grid and contributing, according to its recent measured output at peak demand times, with a “DG OFF” scenario, where all DG is removed from the grid. Load-flow analysis has been completed within Transpower’s standard grid planning software, DIgSILENT PowerFactory 2016 SP3, using a load-flow model developed by Transpower, for undertaking the 2017 TPR studies. This model has been updated to include the latest 2017 load forecast. © Mitton ElectroNet Ltd Page 9 of 29 MEL-R3058, Rev 04, April 2017
3.1 Network Overview
An overview SLD of the Lower South Island (LSI), which includes the Otago, Southland and
South Canterbury networks considered by this analysis, is shown in Figure 3. Note that this
diagram shows all 220 kV and 110 kV Transpower assets in the region, including all GXPs, Grid
Injection Points (GIPs) and switching stations. A list of all locations and their status as GIP,
GXP, or switching station, is included within Appendix A.
Is lin g to n
2 2 0 kV T im a ru /
Tekapo B A s h b u rto n
T w ize l H a y w a rd s
3 3 kV 2 2 0 kV
Is lin g to n
2 2 0 kV
O hau A T im a ru
O hau B 1 1 0 kV
W a ita k i 1 1 kV
O hau C
B la c k P o in t S tu d h o lm e
2 2 0 kV 1 1 0 kV * N o te : S tu d h o lm e sp lit is
33 kV
2 2 0 kV
1 1 kV B e lls P o n d a s su m e d p e rm a n e n tly in
1 1 0 kV p la c e (a n d s o u th o f
2 2 0 kV
S tu d h o lm e ) fo r th is s tu d y
B e n m o re G le n a v y
2 2 0 kV
2 2 0 kV
A v ie m o re
L iv in g s to n e 2 2 0 kV
110 kV
3 3 kV
C ro m w e ll 3 3 kV
N aseby
O a m a ru
2 2 0 kV
L iv in g sto n e
3 3 kV 2 2 0 kV
F ra n k to n
3 3 kV 1 1 0 kV 2 2 0 kV
3 3 kV
C ly d e
R o x b u rg h
2 2 0 kV
M a n a p o u ri 1 1 0 kV
33 kV
1 1 0 kV
T h re e 2 2 0 kV
2 2 0 kV
M ile H ill H a lfw a y B u s h
2 2 0 kV
220 kV 3 3 kV
S o u th D u n e d in
110 kV 1 1 0 kV
G o re
33 kV 3 3 kV
B e rw ic k
B ry d o n e KEY
1 1 0 kV
1 1 0 kV 1 1 kV
N o rth M a k a re w a 3 3 kV
H V D C Lin k
1 1 0 kV 2 2 0kV C IR CU IT
2 2 0 kV 3 3 kV B a lc lu th a 1 1 0kV C IR CU IT
3 3 kV C IR CU IT
E d e n d a le
SU B STA T IO N B U S
220 kV T RA N SFO R M ER
3 3 kV 3 W D G T RA N SFO R M ER
In v e rc a rg ill T EE P O IN T
LO A D
2 2 0 kV C A P A CITO R
T iw a i G EN ERA T O R
Figure 3 – Lower South Island Study Region showing GIPs and GXPs
3.2 Model Adjustments and Assumptions
As mentioned at the start of this section, the PowerFactory model has been adapted from the
2017 TPR model, used by Transpower. There are several modifications to the base model,
which affect the studies completed. These are covered in the following sections.
3.2.1 Committed Upgrade Projects
The analysis model includes the following committed upgrade projects:
New 220/110 kV interconnection at Gore, in 20181.
Replacement supply transformers at Halfway Bush, in 2018.
1
Refer to TPR 2015 [1], chapter 19, section 19.2.2, page 285.
© Mitton ElectroNet Ltd Page 10 of 29
MEL-R3058, Rev 04, April 20173.2.2 TPR Model Modifications
The following additional modifications were made to the TPR model:
The base case has been prepared with GXP load and DG separated at the supply bus,
rather than being “lumped” together in the GXP load. This allows for easily switching ON
or OFF the DG, to determine its impact.
Shoulder load scenarios were not considered, only Summer and Winter peak scenarios.
All load forecasts are P90 “prudent” forecasts.
The 110 kV Studholme “system split” has been moved South of Studholme and
engaged permanently, for this study. Currently, the split is located North of Studholme
and only operates in Winter. Future regional load growth indicates that this operational
change is required, to maintain grid security.
3.2.3 Line and Transformer Ratings
Throughout this analysis, the following thermal ratings were assumed:
For transformers, the 24 hr post contingency branch rating.
For lines, the continuous branch rating.
3.3 Distributed Generation Network Contribution
3.3.1 Representation of DG for System Planning Studies
Historically, Transpower has not directly modelled DG within its transmission planning model,
because it is built into the load forecast; it manifests as a reduction to GXP load. There are
several exceptions for DG which was formerly grid connected, or which, because of its size and
network location, has been modelled explicitly. These are listed in Table 1.
Table 1 - Explicitly Modelled DG
Explicitly Modelled DG GXP/GIP
Waipori 110 kV Berwick 110 kV
Waipori 33 kV Halfway Bush 33 kV
Mahinerangi wind-farm Halfway Bush 33 kV
White Hill wind-farm North Makarewa
Naseby Naseby
These stations have been left modelled “as is”, but their contribution to the power flow has
been adjusted, according to the methodology described in this report.
“Other” DG which includes smaller hydro schemes, diesel units, wind-farms and solar
installations, was separated from the load at each GXP. In other words, it was disaggregated.
This provides two benefits for modelling:
1. It allows simple inspection and manipulation of DG contribution, to construct DG OFF
and DG ON models.
2. It allows for the application of separate load and generation profiles to each.
3.3.2 Average DG GXP Contribution During Network Peak
The DG contribution for the Summer and Winter peaks assumed in this study, is the average
representative DG contribution during the network peak demand. Specifically, the average
contribution of the DG during the 20 highest Summer peaks in 2015, determines the DG
contribution in Summer and the average contribution of the DG during the 20 highest Winter
peaks in 2015, determines the DG contribution in Winter2. The GXP peaks were determined on
an island peak basis and also a regional peak basis, hence there is an island peak DG
2
2016 data was used to consider the contribution of the Flat Hill wind-farm at Invercargill.
© Mitton ElectroNet Ltd Page 11 of 29
MEL-R3058, Rev 04, April 2017contribution and regional peak DG contribution, which are slightly different. This information
was provided to Mitton ElectroNet by Transpower.
For this analysis, it was also assumed that the DG was dispatched at unity power factor. That
is, it provides no additional voltage support to the network. As the distribution network was
not modelled3 in detail, and hence reactive power losses in the distribution system were not
considered, then this is a reasonable assumption, which reflects a typical operating mode of
smaller generation units.
3.3.3 Contribution of Wind Generation
For stand-alone wind generation, which is classified as DG, but is typically modelled as part of
the base TPR model, for example, White Hill and Mahinerangi, the assumed contribution at
peak load was 20 % of nominal capacity. This is consistent with the TPR methodology.
3.3.4 Combined DG Contribution by GXP
Table 2 shows the DG contributions which have been assumed, as part of this analysis, for
each GXP. Note that the DG includes major stations, but also any smaller DG, such as grid
connected solar, mini hydro and wind.
Table 2 - Considered Distributed Generation by GXP
GXP Assumed Contribution Regional Peak Assumed Contribution Island Peak
Load Load
Winter (MW) Summer (MW) Winter (MW) Summer (MW)
Balclutha 4.3 5.6 3.3 4.5
Bell’s Pond 0 0 0 0
Black Point 0 0 0 0
Brydone 0 0 0 0
Clyde 18.7 9.5 18.5 8.8
Cromwell 3.6 3.5 3.7 3.7
Edendale 0 0 0 0
Frankton 1.6 2.0 1.6 1.8
Gore 0.5 0.1 0.5 0.3
Berwick 110 kV 32 32 32 32
Halfway Bush 33 kV 42.3 43.6 39.1 39.7
Invercargill 3.8 3.3 2.6 2.5
Naseby 13.1 5.5 13.2 5.5
North Makarewa 17.4 15.6 17.2 16.8
Oamaru 0 0 0 0
South Dunedin 0 0 0 0
Studholme 0 0 0 0
Tiwai 0 0 0 0
Twizel 0 0 0 0
Waitaki 0 0 0 0
3.4 Load Forecasts
The Transpower planning process considers three different load forecasts, each with a different
purpose and applicability. The GXP peak forecast is based on the maximum load at each
individual GXP and is a P90 prudent forecast. This forecast is applicable for studies looking at
supply transformer capacity and future needs, at GXP level.
3
With the exception of the 33 kV interconnection from Halfway Bush to Waipori.
© Mitton ElectroNet Ltd Page 12 of 29
MEL-R3058, Rev 04, April 2017The regional peak forecast is the GXP peak load, adjusted for coincidence within the region 5. It
is the maximum load which occurs in the region, but it is not necessarily the peak load at each
individual GXP. This forecast is also a P90 prudent forecast. This forecast is used for assessing
the capacity of regional interconnections, such as 220 kV and 110 kV transmission lines and
interconnecting transformers.
The island peak is similar to the regional peak forecast, but applied to the entire island. At the
individual GXP level, it is usually lower than the regional and GXP peak. This forecast, also a
P90 forecast, is applicable for grid backbone studies, assessing the capacity of the grid for
transfer between regions.
Table 3 - Table 5 show the load values assumed for each forecast.
Table 3- Forecast Demand (Single GXP Peak Prudent Growth P90)6
GXP 2017 2019 2021 2025
Winter Summer Winter Summer Winter Summer Winter Summer
Balclutha 29.7 29.8 30.0 30.1 30.3 30.4 30.9 31.1
Bell’s Pond 10.7 17.6 11.1 18.1 11.5 20.1 13.0 23.6
Black Point 12.6 15.1 12.8 17.8 12.9 17.9 13.2 18.2
Brydone 10.9 10.7 10.9 10.8 11.0 10.9 11.2 11.1
Clyde 20.3 17.2 20.7 17.4 21.0 17.7 21.7 18.3
Cromwell 38.5 36.4 40.5 38.6 42.5 40.9 46.5 45.5
Edendale 31.5 31.1 32.7 32.3 34.0 33.5 36.4 36.0
Frankton 67.8 39.9 70.6 41.5 73.4 43.2 79.1 46.5
Gore 32.6 30.0 33.2 30.6 33.9 31.2 35.2 32.5
Halfway Bush
110 kV 8.6 7.5 0 0 0 0 0 0
Halfway Bush
33-1 91.0 64.1 86.3 57.8 88.2 59.2 92.0 61.9
Halfway Bush
33-2 53.5 29.0 54.6 29.6 55.7 30.2 57.9 31.4
Invercargill 97.7 75.5 99.6 77.1 101.6 78.6 105.7 81.8
Naseby 34.2 34.2 35.3 35.3 36.3 36.3 38.5 38.5
North
Makarewa 55.6 56.7 56.2 58.5 56.8 60.4 57.9 64.2
Oamaru 44.3 47.7 45.7 49.1 47.0 50.6 49.8 53.6
South Dunedin 80.3 54.7 96.6 70.6 97.9 71.5 100.6 73.3
Studholme 13.1 13.9 13.6 20.5 11.2 18.1 12.3 19.2
Tiwai 582.0 582.0 582.0 582.0 582.0 582.0 582.0 582.0
Twizel 6.3 6.8 6.5 8.5 6.8 8.8 7.3 9.3
Waitaki 5.0 4.9 5.1 5.3 5.3 5.9 5.6 6.2
5
The regional peak forecast is adjusted for Transpower’s TPR regions, rather than the pricing regions
used within this document. That is, there is a separate regional peak for Otago/Southland and South
Canterbury. However, this is not expected to make a significant difference to the results.
6
The assumed load power factor is shown in Appendix B.
© Mitton ElectroNet Ltd Page 13 of 29
MEL-R3058, Rev 04, April 2017Table 4 - Forecast Demand (Regional Peak Prudent Growth P90)
GXP 2017 2019 2021 2025
Winter Summer Winter Summer Winter Summer Winter Summer
Balclutha 22.1 28.2 23.2 30.1 24.1 30.4 25.4 31.1
Bells Pond 6.8 14.7 7.5 15.2 8.1 17.4 9.5 20.7
Black Point 5.9 12.8 6.3 15.2 6.7 15.7 7 16.2
Brydone 7.3 8.4 7.4 0.5 7.4 0.5 7.6 0.5
Clyde 15 13.7 15.8 14.8 16.6 15.3 17.6 16.3
Cromwell 27.8 30.5 30.5 34.3 32.9 37.1 37.2 42.5
Edendale 8.8 22.4 9.5 24.6 10.1 26.1 11.2 28.8
Frankton 50.5 36.7 54.8 40.4 58.6 42.9 65.1 46.5
Gore 25.4 26.9 27 29.1 28.4 30.3 30.5 32.4
Halfway Bush
110 7.1 6.9 0 0 0 0 0 0
Halfway Bush 69.5 58.9 68.7 56.3 72.2 58.8 77.8 61.9
33-1
Halfway Bush 35 20.9 37.1 22.6 39 23.5 41.9 25.2
33-2
Invercargill 78.8 69.3 83.8 74.8 87.9 77.9 94.4 81.8
Naseby 24.4 30 26.2 32.8 27.8 34.4 30.3 37.5
North 39.2 46.9 41.2 51.3 42.9 54 45.1 59.1
Makarewa
Oamaru 36.6 44 40.2 45.8 43.3 48.5 47.2 52.2
South Dunedin 61.1 48.6 76.6 66.3 79.9 68.6 84.7 72.4
Studholme 10.2 12.4 11.4 18.4 9.7 16.7 11 18
Tiwai 573.7 574.4 573.7 574.4 573.7 574.4 573.7 574.4
Twizel 3.2 4.2 3.5 5.3 3.9 5.6 4.3 6
Waitaki 2.3 2 2.6 2.3 2.8 2.6 3 2.7
Table 5 – Forecast Demand (Island Peak Prudent Growth P90)
GXP 2017 2019 2021 2025
Winter Summer Winter Summer Winter Summer Winter Summer
Balclutha 22.1 27.3 23.1 28.9 23.9 30 25.1 31.1
Bells Pond 6 14.4 6.3 14.8 6.6 16.8 7.5 20
Black Point 5.2 12.6 5.3 14.7 5.4 15.2 5.5 15.6
Brydone 7.3 8.1 7.4 8.2 7.4 8.3 7.6 8.4
Clyde 15 13.3 15.8 14.2 16.4 14.8 17.4 15.6
Cromwell 27.9 29.6 30.4 32.9 32.7 35.8 36.8 40.8
Edendale 8.8 21.7 9.5 23.6 10.1 25.2 11.1 27.7
Frankton 50.6 35.5 54.6 38.7 58.2 41.4 64.4 45.6
Gore 25.5 26.1 26.9 27.9 28.1 29.2 30.1 31.1
Halfway Bush
110 7.1 6.7 0 0 0 0 0 0
Halfway Bush 69.5 57.1 68.4 53.9 71.6 56.7 76.9 60.7
33-1
Halfway Bush 35 20.3 37 21.6 38.7 22.7 41.4 24.2
33-2
Invercargill 78.9 67.1 83.4 71.7 87.2 75.1 93.4 80.1
Naseby 24.4 29.1 26.1 31.4 27.5 33.2 30 36
North 39.2 45.5 41.1 49.1 42.5 52.1 44.6 56.7
Makarewa
Oamaru 32.3 43.1 33.8 44.4 35.3 46.8 37.4 50.3
South Dunedin 61.2 47.1 76.3 63.6 79.2 66.1 83.8 69.4
Studholme 9 12.1 9.5 17.9 7.9 16.1 8.7 17.4
Tiwai 573.7 574.4 573.7 574.4 573.7 574.4 573.7 574.4
Twizel 2.8 4.1 3 5.1 3.1 5.4 3.4 5.8
Waitaki 2.1 2 2.2 2.2 2.3 2.5 2.4 2.6
© Mitton ElectroNet Ltd Page 14 of 29
MEL-R3058, Rev 04, April 20173.5 Methodology for Identifying Required DG The methodology used for determining the required DG, is described in Figure 4. The process considers each of the grid areas sequentially. The analysis and results conducted in each area of analysis, influence the assumptions of what DG is assumed to be in service in the DG OFF scenarios, in the remaining grid area studies. For the local supply analysis, each GXP is assessed in 20177, for whether it is able to maintain N-1 supply with DG available and with DG unavailable. DG at a GXP is determined to be required by the grid, if a line or transformer overloads, following a single contingency, when there is no contribution from the DG, but does not overload when the DG is available. In addition to thermal overloads, if a single contingency results in low voltage in the network, outside of the permitted operating band and this occurs when DG is not available, but does not occur when it is available, then such DG is also considered as being required. The regional grid analysis builds on the local supply analysis, by undertaking an N-1 contingency analysis for all interconnecting transformers and lines within the region and determining if any thermal overloads, or voltage problems, could be avoided, with DG available. DG, which was identified in the local supply analysis as required, is assumed as ON in the DG OFF scenarios, for this analysis. As for the local supply analysis, any additional DG which is required to meet the security criteria in this analysis, is assumed to be required by the grid. Finally, the grid backbone is studied to see if the DG is required for any issues involving transfer capacity, into or out of the region. In this case, any DG identified as required by the local supply transformer and spur line analysis, or regional grid analysis, is assumed as ON for the DG OFF scenario. 7 With the exception of Halfway Bush which was assessed in 2019 because of the 2018 supply transformer upgrades. © Mitton ElectroNet Ltd Page 15 of 29 MEL-R3058, Rev 04, April 2017
2017   w in te r   +   su m m er
                         In itial D G O FF       2019   w in te r   +   su m m er   In itial D G O N
                             scen ario           2021   w in te r   +   su m m er       scen ario
                                                 2025   w in te r   +   su m m er

                                                    Lo cal Sup p ly an d
                                                   Sp u r Lin e A n alysis

                                                        D e term in e
                                                    R e q u ired D G fo r
                                                       N -1 se cu rity

                        M o d ify D G O FF
                      scen ario to in clu d e
                         req u ired D G

                                                     R e gio n al G rid
                                                         A n alysis

                                                        D e term in e
                                                    R e q u ired D G fo r
                                                       N -1 se cu rity

                        M o d ify D G O FF
                      scen ario to in clu d e
                         req u ired D G

                                                     G rid B ackb o n e
                                                         A n alysis

                                                        D e term in e
                                                    R e q u ired D G fo r
                                                       N -1 se cu rity

                                             Figure 4 - Analysis Flowchart

© Mitton ElectroNet Ltd                                                                                Page 16 of 29
MEL-R3058, Rev 04, April 2017
4 Analysis of DG Effect on the Transmission System
This section details the analysis which has been completed, to determine what DG would be
required in the Lower South Island (LSI), to maintain grid security until 2025. The analysis has
been separated into three sections:
1. Local supply analysis;
2. Regional grid analysis; and
3. Grid backbone analysis.
4.1 Local Supply Issues
To determine the GXP capacity, the GXP load was increased during a single N-1 transformer or
spur line contingency, until the remaining transformer or spur line reaches 100 % of its 24 hr
post contingency rating for transformers, or 100 % of the branch rating for lines. Table 6
shows the maximum value of load which can be supplied in a DG ON and a DG OFF scenario,
for each GXP.
Note that capacity differences exist between Summer and Winter scenarios, due to the
difference in assumed load power factors and the difference between Summer and Winter
ratings for equipment.
To determine if the supply is adequate, the N-1 limits, identified in Table 6, are compared with
the single GXP forecast load, shown in Table 3.
The analysis presented in Table 6, shows that there are five GXPs where DG is required to
meet N-1 security, in the eight year planning horizon investigated:
Cromwell (in Winter from 2021 and Summer from 2021)
Naseby (in Winter and Summer, from 2017);
Halfway Bush (in Winter, from 2017);
Frankton (in Winter, from 2019); and
North Makarewa (in Summer, from 2025)
The Cromwell – Frankton lines are predicted to reach their thermal limit in Winter by 2019. A
DG contribution of 1.6 MW will delay the need for mitigation until 2021, based on the current
load forecast. Consequently, the Frankton DG is also “required”.
© Mitton ElectroNet Ltd Page 17 of 29
MEL-R3058, Rev 04, April 2017Table 6: Impact of DG on the N-1 security of supply for lower South Island GXPs*
N-1 Capacity Limit (MW)
Grid Exit Point
Winter Summer
(Limitation)
DG OFF DG ON DG OFF DG ON
Balclutha 35.7 40.1 32.8 38.0
(Supply TX)
Balclutha8 38.9 40.9 31.5 35.5
(Voltage / Balclutha – Berwick outage)
Brydone9 20.6 20.6 20.2 20.2
(Supply TX)
Clyde10 25.9 43.9 23.8 31.6
(Supply TX)
Cromwell11 38.6 43.5 39.2 42.6
(Supply TX) (2019) (2025) (2021) (2025)
Edendale 33.9 33.9 31.8 31.8
(Supply TX) (2021) (2021) (2019) (2019)
Frankton 72.2 73.8 72.1 74.0
(Supply TX)12 (2021) (2025)
Frankton 69.3 70.9 59.0 61.0
(Cromwell – Frankton Lines) (2019) (2021)
Gore13 37.4 37.9 34.2 34.3
(Supply TX)
Halfway Bush 33 kV14 110.6 147.4 110.4 147.8
(Supply TX) (2017)
Invercargill 131.9 135.7 131.9 135.2
(Supply TX)
Naseby 32.0 45.3 32.0 36.8
(Supply TX) (2017) (2017)
North Makarewa15 62.3 78.4 61.1 74.6
(Supply TX) (2025)
Oamaru16 ~75 ~75 ~72 ~72
(Supply TX)
8 48.4 48.4 45.2 45.2
Oamaru
(110 kV bus voltage) (2025) (2025) (2017) (2017)
Oamaru 49.4 49.4 42.1 42.1
(Waitaki – Oamaru Lines) (2025) (2025) (2017) (2017)
South Dunedin 102.4 102.4 106.0 106.0
(Supply TX)
Studholme 11.1 11.1 10.1 10.1
(Supply TX)
Twizel ~27 ~27 ~27 ~27
(Supply TX)
*Note that the year in parentheses following the MW limi,t indicates what forecast year the load will exceed the GXP
capacity. Some GXPs appear in the table twice, as there are multiple issues to consider, such as spur line capacity and
voltage constraints. The issue applicable to the specific row of the table is indicated in parentheses.
8
Balclutha and Oamaru have a wider voltage agreement (WVA,) which allows the 110 kV bus voltage to
reach a minimum of 0.875 pu. The calculated limits in the table are based on this.
9
The Brydone transformers have a protection branch limit of 20.8 MVA; the transformer limit is
32.8/31.4 MVA.
10
The Clyde transformers have a metering limit of 27 MVA; the transformer limit is 70.9/68 MVA.
11
The Cromwell supply transformers have a protection/line trap branch limit of 40.9 MVA. The
transformer limit is 67.5/64.6 MVA.
12
The supply transformer post-contingency capacity for the T2A/T2B combined unit is 80 MVA. The limit
is lower in this analysis, due to low voltage on the Frankton Transformer HV side.
13
Gore was assessed following the planned new 220/110 kV interconnector connection in 2018.
14
Halfway Bush 33 kV is currently run split (until the 2018 supply TX replacement). The split can be
closed under contingency. The capacity was assessed using the new supply transformer arrangement;
the existing (2017) limit is lower.
15
The North Makarewa supply transformers have a 33 kV cable branch limit of 67.5 MVA; the
transformer limit is 79.4/76.1 MVA.
16
The network reaches a voltage stability limit before the transformer capacity is reached.
© Mitton ElectroNet Ltd Page 18 of 29
MEL-R3058, Rev 04, April 20174.2 Regional Grid Issues An N-1 contingency analysis was completed on the regional interconnected grid, to determine the influence of distributed generation on any regional transmission issues. The following discussion explains each identified regional transmission issue and provides some explanation on the influence of DG for each one. For this analysis, the DG at Cromwell, Halfway Bush, North Makarewa, Naseby and Frankton was assumed in service for the DG OFF scenarios, where required, based on the local supply analysis. 4.2.1 Oamaru – Studholme - Bells Pond Tee – Waitaki Thermal Overloading This circuit is subject to thermal overloading in the last year (2025) of the examined planning period in Winter and from 2017 in Summer. The overload is caused by an outage of Waitaki TF24, or the Oamaru – Black Point – Waitaki circuit. This issue is a known issue and is proposed to be addressed in consultation with the GXP customers. This issue is not affected by the availability of DG. 4.2.2 Oamaru – Black Point - Waitaki Thermal Overloading This circuit is subject to thermal overloading in Summer 2017 for an Oamaru – Black Point - Waitaki -1, or Waitaki TF-24 outage. This issue is not affected by the availability of DG. 4.2.3 Waitaki Interconnector Capacity Waitaki T23 is expected to exceed its thermal capability from 2021 in Summer and Waitaki T24 from 2025. This issue is not affected by the availability of DG. 4.2.4 Edendale – Invercargill Thermal Overloading An outage of the Gore – Roxburgh circuit causes an overload of the Edendale – Invercargill circuit, in Summer 2017. This issue is resolved by the commissioning of the Gore interconnector in 2018 and the subsequent operational split of the 110 kV regional network. The impact of DG on this issue is complex, because DG at Balclutha, Gore, Berwick and Halfway Bush all reduces the circuit loading. However, only the Berwick DG can fully alleviate the overload by itself. Table 7 shows the effect of each DG on the Summer 2017 Edendale – Invercargill overload. Because the DG is of different sizes, the overall effect (second column) can be misleading. It is also instructive to view the generator “effectiveness” on a per MW basis. This is shown in column three. This is a way of comparing like for like DG contributions. Essentially, this answers the question: how does a 1 MW change in DG output, at each of these GXP’s, affect the loading on the circuit? Table 7 shows that, as expected, the closer the generation is to the circuit, the greater is its’ influence on the circuit loading. Consequently, it follows that Gore DG is the most effective, followed by Balcutha, then Berwick and finally Halfway Bush 33 kV. © Mitton ElectroNet Ltd Page 19 of 29 MEL-R3058, Rev 04, April 2017
Table 7 - DG effect on Edendale – Invercargill thermal overloading
               Scenario                              Edendale –     Effectiveness (% loading reduction per
                                                     Invercargill   MW)
                                                     Loading
                                                     for Gore
                                                     Roxburgh
                                                     Outage (%)
               Summer 2017                           105.9          -
               Summer 2017 + Balclutha DG            101.0          0.9
               Summer 2017 + Gore DG                 105.8          1.5
               Summer 2017 + Berwick DG              95.2           0.4
               Summer 2017 + Halfway Bush 33 kV DG   105.1          0.1

Based on these results, without putting any subjective value judgement on what DG is
preferred, we have included all of the above DG in the Summer 2017 grid backbone analysis
and have determined that this DG is required.

 4.2.5 Naseby – Roxburgh Thermal Overloading

This circuit is subject to thermal overloading, from 2019, for an Aviemore – Waitaki
contingency and from 2021 for a Livingstone – Waitaki contingency. This is considered a grid
backbone issue and is discussed in further detail, in Section 4.3.1

4.3   Regional Contingency Analysis Discussion

Based on the results of the regional analysis, Balclutha, Gore and Berwick DG was identified as
required, in Summer 2017, in addition to the DG required by the local supply analysis, based
on the overload of the Edendale – Invercargill circuit, for a Gore – Roxburgh outage.

We note that this particular thermal overload is also affected by other generation dispatch in
the region, such as Manapouri, Roxburgh and Clyde. We did not explore this in further detail in
this study, but it would be worth considering in a more detailed analysis of this particular
issue.

© Mitton ElectroNet Ltd                                                                                      Page 20 of 29
MEL-R3058, Rev 04, April 2017
Grid Backbone Issues
Transpower’s grid planning process under the TPR, identified several issues which affect the
long term power transfer import and export limits into the LSI. In this report, we examine the
following two grid backbone issues and whether either of these are significantly influenced by
DG in the region:
1. Livingstone – Naseby – Roxburgh thermal constraint, during high northwards transfer
from the lower South Island.
2. Voltage stability limit for South transfer, during low generation at Manapouri, Roxburgh
and Clyde.
It is noted that these two limits are not the only constraints in this area; however, they are the
ones which are likely to be binding going into the future, based on the expected development
path of the network; refer to System Condition 2 and 3 in the TPR 2015 [1].
DG at Balclutha, Berwick, Cromwell, Gore, Halfway Bush, Naseby, Frankton and North
Makarewa was assumed in service, when required, in the DG OFF scenarios.
4.3.1 Livingstone – Naseby – Roxburgh Transmission Constraint (Regional Export
Limit)
During times of high northwards power transfer out of the LSI, a contingency on one of the
Clyde – Cromwell – Twizel circuits will cause an overload on the Livingstone – Naseby –
Roxburgh circuit, if North transfer exceeds 640 MW in Summer and 800 MW in Winter; refer
[1].
In this analysis, it was determined that there was no material difference in the transfer limit of
Livingstone – Naseby – Roxburgh, between the DG OFF or DG ON scenarios. Consequently, it
was decided to investigate how the two scenarios affect the maximum possible generation
dispatch, from the three large hydro stations in the region. The Clyde, Roxburgh and
Manapouri generators were scaled proportionately, with one Clyde – Cromwell – Twizel circuit
out of service, until the other circuit reached its transfer capacity, hence defining the maximum
allowable dispatch for these three stations and the pre-contingency limit at which they would
become constrained.
Peak capacity of the stations is assumed as 1602.5 MW, apportioned as follows:
Manapouri 7 x 121.5 MW (850.5 MW)
Clyde 4 x 10⁸ MW (432 MW)
Roxburgh 8 x 40 MW (320 MW)
There is a two stage Roxburgh Export Overload Protection (REOLP) scheme, which splits the
220 kV bus at Roxburgh, to force more power up the higher capacity Clyde - Roxburgh circuits,
instead of the Naseby - Roxburgh circuit. Stage one is currently operational, with the second
stage, which also opens the Roxburgh – Three Mile Hill – 2 circuit, operational following
commissioning of the new 220/110 kV Gore interconnection. In this study, stage two is
assumed operational from 2019.
Table 8 shows results for various years of the study, in terms of the maximum possible
dispatch of the Manapouri, Roxburgh and Clyde stations.
Table 8 - Maximum Manapouri, Roxburgh and Clyde Generation
Year Summer Winter
Transfer limit LSI Max Generation Transfer limit LSI Max Generation
(MW)18 DG ON (MW) DG OFF (MW) (MW) DG ON (MW) DG OFF (MW)
2017 563 1417 1444 >650 1602.5+ 1602.5+
2019 617 1500 1602.5+ >650 1602.5+ 1602.5+
2021 623 1525 1602.5+ >650 1602.5+ 1602.5+
2025 655 1598 1602.5+ >650 1602.5+ 1602.5+
18
This is the sum of the power-flow on Clyde – Cromwell – Twizel (from Clyde) and Livingstone –
Naseby- Roxburgh (from Roxburgh).
© Mitton ElectroNet Ltd Page 21 of 29
MEL-R3058, Rev 04, April 2017The results in Table 8 show that the DG has no impact on the possible LSI generation dispatch
in Winter, when the circuit thermal limit is higher; in this case, the maximum generation
dispatch exceeds the combined peak output from all three stations. In Summer, when the DG
is ON, there is a slightly lower dispatch limit, because the DG decreases the effective regional
load and therefore increases the power transfer North from Roxburgh. In other words, the DG
makes a constraint on northwards power transfer from the LSI more likely in Summer, but
does not affect the constraint likelihood in Winter.
4.3.2 South Transfer Voltage Stability Limit (Regional Import Limit)
During times of low generation in the LSI, power transfer is from the upper Waitaki Valley to
the South, with HVDC transfer from the North Island to the South Island. To test this
condition, the following modifications were made to the reference power flow:
1. One Clyde unit only is operating.
2. Two Roxburgh units only are operating, one connected to the 220 kV bus and the other
connected to the 110 kV bus.
To find the voltage stability limit, the Manapouri station dispatch is progressively lowered, with
one Invercargill – Roxburgh circuit out of service, until the power flow no longer converges
(voltage collapse). Power balance in the South Island is maintained by increasing HVDC
southwards transfer progressively.
Table 9 shows the minimum required dispatch at Manapouri, to maintain voltage stability for
each year. Higher minimum dispatch indicates worse voltage stability; in other words, lower
numbers are better.
Table 9 - Minimum Manapouri Generation (Constant Voltage)19
Year Winter Summer
Minimum Manapouri Generation Minimum Manapouri Generation
DG ON (MW) DG OFF (MW) DG ON (MW) DG OFF (MW)
2017 111.4 (3 units) 178.5 (3 units) 155.0 (3 units) 187.5 (3 units)
2019 161.6 (3 units) 223.7 (3 units) 217.2 (3 units) 296.3 (3 units)
2021 185.5 (3 units) 251.7 (3 units) 255.4 (3 units) 325.5 (3 units)
2025 223.7 (3 units) 291.6 (3 units) 335.2 (3 units) 359.1 (3 units)
There are several factors which influence the numbers in the above table, such as the position
of interconnecting transformer taps and power factor assumptions for the loads. Nevertheless,
the general trend is that the network is slightly more voltage stable with the DG operating
(providing about 60 MW more capacity), in both Summer and Winter. In other words, the
Southland region load can be higher when DG is operating. However, because the limit is
regional and not localised to a particular LSI area, it is difficult to pinpoint the exact effect of
individual DGs.
4.3.3 Summary of Grid Backbone Assessment
In this report, two LSI grid backbone issues were investigated and the impact of distributed
generation on transfer limits was determined. The following were the primary conclusions:
1. For the Livingston – Naseby – Roxburgh thermal limit, the DG was found to increase
the likelihood of constraint on northwards power transfer. This was only observed in
Summer and the effect was relatively small.
2. For the LSI voltage stability transfer import limit, the DG was observed to provide a
small increase to the maximum power import into the region. The effect was
19
Although the limits in this table are instructive from a voltage stability perspective, the voltage stability
limit for the Invercargill – Roxburgh outage is currently not the binding import limit in the region. The
thermal capacity of the Livingstone – Naseby circuit is the primary limit, until the capacity of this circuit is
increased in the proposed second stage of the CUWLP project.
© Mitton ElectroNet Ltd Page 22 of 29
MEL-R3058, Rev 04, April 2017approximately 60 MW of additional LSI load and was apparent in both Summer and
Winter cases.
The above two scenarios show that the impact of DG on the grid backbone is complex and
depends on whether the LSI is exporting or importing power. The DG can increase or decrease
transmission limits and on balance it is not possible to say that DG is required for grid
backbone security. However, it does change the system power flows and its influence should
be considered, as part of future planning work.
5 Conclusions
Mitton ElectroNet has completed an analysis on behalf of Transpower, to determine required
DG in the LSI. This analysis was undertaken to fulfil Transpower’s requirements, under Part 6,
Schedule 6.4 of the Code.
The analysis involved three components, assessing the impact of the DG on:
1. Local supply transformer and spur line asset capacity.
2. Regional transmission capacity.
3. Grid backbone transfer limits.
Results show that DG contribution is required at the following GXPs:
Cromwell (Winter, from 2019 and Summer, from 2021);
Naseby (Winter and Summer, from 2017);
Halfway Bush (Winter, from 2017 and Summer, in 2017 only);
Frankton (Winter only, from 2019);
North Makarewa (Summer only, from 2025);
Balclutha (Summer 2017 only);
Gore (Summer 2017 only); and
Berwick (Summer 2017 only).
© Mitton ElectroNet Ltd Page 23 of 29
MEL-R3058, Rev 04, April 20176 Bibliography
[1] Transpower NZ Ltd, “Transmission Planning Report,” 2015.
[2] Electricity Authority, “Electricity Industry Participation Code 2010 (Revision 19 Jan 2017),”
2017.
[3] Electricity Authority, “Review of Distributed Generation Pricing Principles - Decisions and
Reasons Paper,” 2016.
© Mitton ElectroNet Ltd Page 24 of 29
MEL-R3058, Rev 04, April 2017Appendix A
GIP and GXP List
© Mitton ElectroNet Ltd Page 25 of 29
MEL-R3058, Rev 04, April 2017Appendix A: GIP and GXP List
Substation GIP GXP Switching
Station
Aviemore
Balclutha
Bell’s Pond
Benmore
Berwick
Black Point
Brydone
Clyde
Cromwell
Edendale
Frankton
Glenavy
Gore
Halfway Bush
Invercargill
Livingstone
Manapouri
Naseby
North Makarewa
Oamaru
Ohau A
Ohau B
Ohau C
Roxburgh
South Dunedin
Three Mile Hill
Tiwai
Twizel
Waitaki
Tekapo B
Studholme
© Mitton ElectroNet Ltd Page 26 of 29
MEL-R3058, Rev 04, April 2017Appendix B
Load Power Factor
© Mitton ElectroNet Ltd Page 27 of 29
MEL-R3058, Rev 04, April 2017Appendix B: Load Power Factor
Table 10 - Single GXP Peak Assumed Power Factor
GXP Single GXP Peak
Winter Summer
Balclutha 0.97 0.94
Bell’s Pond N/A N/A
Black Point N/A N/A
Brydone 0.78 0.77
Clyde 0.99 0.92
Cromwell 1.00 0.99
Edendale 0.95 0.95
Frankton 1.00 1.00
Gore 0.97 0.95
Halfway Bush 33 kV 1.0 1.0
Invercargill 0.99 0.99
Naseby 0.99 0.97
North Makarewa 0.98 0.97
Oamaru 0.98 0.98
South Dunedin 0.99 1.00
Studholme 0.98 0.95
Tiwai N/A N/A
Twizel 1.00 1.00
Waitaki 0.96 0.95
Table 11 - Regional Peak Assumed Power Factor by GXP
GXP 2017 2019 2021 2025
Winter Summer Winter Summer Winter Summer Winter Summer
Balclutha 0.977 0.952 0.977 0.952 0.977 0.952 0.977 0.952
Bell’s Pond 0.966 0.963 0.966 0.963 0.966 0.963 0.966 0.963
Black Point 0.929 0.895 0.929 0.895 0.929 0.895 0.929 0.895
Brydone 0.781 0.768 0.781 0.768 0.781 0.768 0.781 0.768
Clyde 0.944 0.9 0.944 0.9 0.944 0.9 0.944 0.9
Cromwell 0.999 0.989 0.999 0.989 0.999 0.989 0.999 0.989
Edendale 0.956 0.953 0.956 0.953 0.956 0.953 0.956 0.953
Frankton 0.998 1 0.998 1 0.998 1 0.998 1
Gore 0.981 0.949 0.981 0.949 0.981 0.949 0.981 0.949
Halfway 0.982 0.966 0.982 0.966 0.982 0.966 0.982 0.966
Bush - 1
Halfway 0.994 0.992 0.994 0.992 0.994 0.992 0.994 0.992
Bush - 2
Invercargill 0.994 0.988 0.994 0.988 0.994 0.988 0.994 0.988
Naseby 0.972 0.972 0.972 0.972 0.972 0.972 0.972 0.972
North 0.991 0.975 0.991 0.975 0.991 0.975 0.991 0.975
Makarewa
Oamaru 0.979 0.972 0.979 0.972 0.979 0.972 0.979 0.972
South 0.996 0.996 0.996 0.996 0.996 0.996 0.996 0.996
Dunedin
Studholme 0.992 0.979 0.992 0.979 0.992 0.979 0.992 0.979
Tiwai 0.968 0.969 0.968 0.969 0.968 0.969 0.968 0.969
Twizel 0.997 0.999 0.997 0.999 0.997 0.999 0.997 0.999
Waitaki 0.996 0.945 0.996 0.945 0.996 0.945 0.996 0.945
© Mitton ElectroNet Ltd Page 28 of 29
MEL-R3058, Rev 04, April 2017Table 12 - Island Peak Assumed Power Factor by GXP
GXP 2017 2019 2021 2025
Winter Summer Winter Summer Winter Summer Winter Summer
Balclutha 0.977 0.952 0.977 0.952 0.977 0.952 0.977 0.952
Bell’s Pond 0.966 0.963 0.966 0.963 0.966 0.963 0.966 0.963
Black Point 0.929 0.895 0.929 0.895 0.929 0.895 0.929 0.895
Brydone 0.781 0.768 0.781 0.768 0.781 0.768 0.781 0.768
Clyde 0.944 0.9 0.944 0.9 0.944 0.9 0.944 0.9
Cromwell 0.999 0.989 0.999 0.989 0.999 0.989 0.999 0.989
Edendale 0.956 0.953 0.956 0.953 0.956 0.953 0.956 0.953
Frankton 0.998 1 0.998 1 0.998 1 0.998 1
Gore 0.981 0.949 0.981 0.949 0.981 0.949 0.981 0.949
Halfway
Bush - 1 0.982 0.966 0.982 0.966 0.982 0.966 0.982 0.966
Halfway
Bush – 2 0.994 0.992 0.994 0.992 0.994 0.992 0.994 0.992
Invercargill 0.994 0.988 0.994 0.988 0.994 0.988 0.994 0.988
Naseby 0.972 0.972 0.972 0.972 0.972 0.972 0.972 0.972
North
Makarewa 0.991 0.975 0.991 0.975 0.991 0.975 0.991 0.975
Oamaru 0.979 0.972 0.979 0.972 0.979 0.972 0.979 0.972
South
Dunedin 0.996 0.996 0.996 0.996 0.996 0.996 0.996 0.996
Studholme 0.992 0.979 0.992 0.979 0.992 0.979 0.992 0.979
Tiwai 0.968 0.969 0.968 0.969 0.968 0.969 0.968 0.969
Twizel 0.997 0.999 0.997 0.999 0.997 0.999 0.997 0.999
Waitaki 0.996 0.945 0.996 0.945 0.996 0.945 0.996 0.945
© Mitton ElectroNet Ltd Page 29 of 29
MEL-R3058, Rev 04, April 2017You can also read