Formulation Technical Operation-3 - CII ...
←
→
Page content transcription
If your browser does not render page correctly, please read the page content below
21-09-2019

         Formulation Technical Operation-3

          TV Ravindra Babu               I Srinivas Raju              Amalin Ugin A
          Lead-Power & Fuel, Power   Section Head - Engineering,   Team Member-Power & Fuel,
                 Generation             Engineering Services           Engineering Services

  Dr.Reddy’s Laboratories Limited                                             Good Health Can’t Wait

                     Company - Profile

FTO3 Plant : INR 28.27
      billions

  Dr.Reddy’s Laboratories Limited                                             Good Health Can’t Wait

                                                                                                       1
21-09-2019

                   Company - Profile

                                                                 Our Products:
                                                              Generic Formulations, including Tablets,
                                                              Capsules,         Injectables,     and       Topical
                                                              creams, is the largest part of our business
                                                              portfolio.
                                                              making            products       across             the
                                                              major therapeutic areas of gastrointestinal
                                                              ailments, cardiovascular disease, pain
                                                              management,          oncology,     anti-infective,
                                                              pediatrics and dermatology.

   Dr.Reddy’s Laboratories Limited                                                     Good Health Can’t Wait

We have presence in all major regions of the world
Commercial
presence in

  30
 countries

  10    API Manufacturing
        Facilities          14   Formulations Manufacturing
                                 Facilities                   09   Global R&D
                                                                   Centres          01     Integrated Biologics
                                                                                           Centers

                                                                                                                        2
21-09-2019

                             20th National Award for
                   “EXCELLENCE IN ENERGY MANAGEMENT 2019”
                           16th to 18th September 2019

                                                                Environment
                                                                     &
                                                                 Community

                      Quality                    Availability

                                     Safety

                                                                               Engineering
                      People
                                                                                Excellence

                                                                                               Continuous
                                  Productivity
                                                                                              Improvement

Dr.Reddy’s Laboratories Limited                                                                  Good Health Can’t Wait

                             20th National Award for
                   “EXCELLENCE IN ENERGY MANAGEMENT 2019”
                           16th to 18th September 2019

                                                                Environment
                                                                     &
                                                                 Community

                      Quality                    Availability

                                     Safety

                                                                              Engineering
                       People
                                                                               Excellence

                                                                                              Continuous
                                  Productivity
                                                                                             Improvement

Dr.Reddy’s Laboratories Limited                                                                  Good Health Can’t Wait

                                                                                                                          3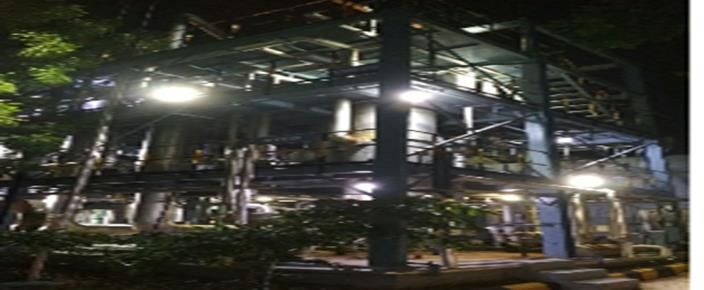
21-09-2019

                 Electrical Energy Metrics-2019

Total Specific Energy consumption:                                        Total Energy consumption:

Electrical (KWH/Million)              7772                                Electrical (KWH)                4,16,05,395

Thermal (kcal/Million units )         6548375                                                                  35,060
                                                                          Thermal (Million kcal)

               Equivalent KWH                                                          Equivalent KWH
                                                                                41605395
         7772                       7616                                                                   40774780

              Thermal          Electrical                                             Thermal          Electrical
*Thermal to Electrical conversion factor is 1 Kcal = 0.001163 KWH

    Dr.Reddy’s Laboratories Limited                                                                Good Health Can’t Wait

Energy consumption yearly trend

   Electrical Energy consumption (KWH)                              Specific consumption (KWH/Million units)
                                                                        10697          10087
    51558334
                                                                                                                         6%

                     43500000                                                                                           30%
                                      41605395                                                          7772

      FY-17            FY-18            FY-19                           FY-17          FY-18           FY-19                 %
                                                                                                                        Improvement

    Dr.Reddy’s Laboratories Limited                                                                Good Health Can’t Wait

                                                                                                                                      4
21-09-2019

   Energy consumption yearly trend

  Thermal Energy consumption (Million Kcal)                    Specific consumption (Million kcal/Million units)

          46756

                                                                           9.7

                           35064            35060
                                                                                           8.1                                  19%

                                                                                                                6.5             24%

          FY-17            FY-18            FY-19                         FY-17           FY-18                FY-19                 %
                                                                                                                                Improvement

       Dr.Reddy’s Laboratories Limited                                                                 Good Health Can’t Wait

Benchmarking with other industries

                                               Dr.
                                                       Jubilant
                                            Reddy’s                                       Infosys
                                                       Baseline
                                            Baseline                        Sun                               Tata
               Parameters                              -2012-13   Lupin                                                        ITC
                                            -2009-10                       pharma       Targets for          Motors
                                                        Target
                                             Target                                        FY19
                                                       for 2020
                                            for 2020
                                                                                      Reduce Per capita
Reduction in Specific Water
                                              40%        12%       NA            NA   consumption by 2%         NA         Water Neutral
Consumption                                                                           over FY18
                                                                                      Reduce Per capita
Reduction in Specific Energy
                                              40%        12%       NA            NA   consumption by 2%         NA         Carbon neutral
Consumption                                                                           over FY18
                                                                                                             Committed
                                                                                      55% electricity
                                                                                                              for 100%
Increase in renewable energy share            25%         -        NA            NA   requirement shall be
                                                                                                             RE without
                                                                                                                           Green Energy
                                                                                      met through RE
                                                                                                             target date

Strive to become water neutral by 2020       100%         -        NA            NA           NA                NA              NA
Reduce in specific generation of
                                              40%         -        NA            NA           NA                NA              NA
hazardous waste
Reduce the quantum of hazardous
                                              40%         -        NA            NA           NA                NA              NA
waste sent by us to landfill/incineration

       Dr.Reddy’s Laboratories Limited                                                                 Good Health Can’t Wait

                                                                                                                                              5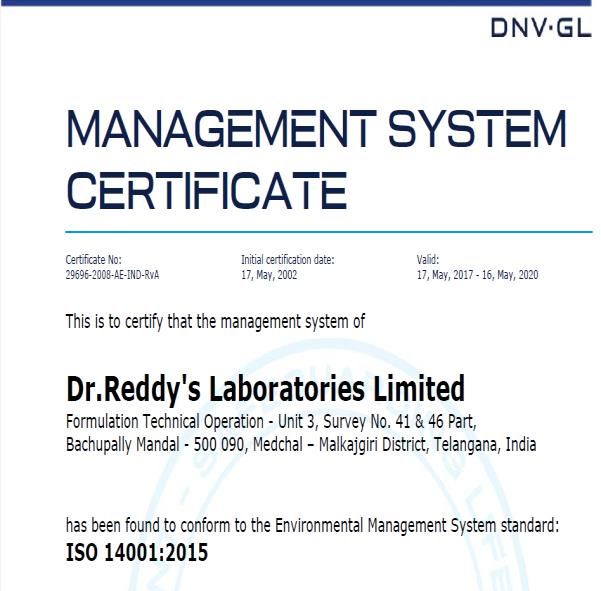
21-09-2019

Environment Commitment Statement - Update

            ECS Commitment                   Target (Baseline     FY17    FY18            FY19
                                                FY’09-10)

Reduction in Specific Water Consumption            40%            58%     58%             59%

Reduction in Specific Energy Consumption           40%            39%     16%             21%

Increase in renewable energy share                 25%            12%     8%              7.7%

Strive to become water neutral                     100%           44%     46%             53%

Reduce in specific generation of
                                                   40%            53%     47%             51%
hazardous waste

Zero Landfill and 40% coprocessing            Interim Target      81%     91%             87.3%

     Dr.Reddy’s Laboratories Limited                                             Good Health Can’t Wait

Road map to be best in class

Specific consumption (KWH/Million units)

                                                                          Major lever identified are:
    10697
                  10087
                                                                          1. Increase volume by cycle
                                                                             time reduction of top four
                                   7772
                                                                             products
                                                                          2. Upgrade Air Handling Unit
                                                                             Existing Conventional
                                           6083
                                                          5627               blower by EC Blowers
                                                                   5064
                                                                          3. AHU reduced frequency
                                                                             mode operation
                                                                          4. IOT solution for HVAC and
                                                                             utility chillers operation
                                                                          5. Utility cooling tower fan
                                                                             motor replace with EC axil
                                                                             fan and other energy
    FY-17         FY-18            FY-19   FY-20          FY'21   FY'22      efficiency projects

     Dr.Reddy’s Laboratories Limited                                             Good Health Can’t Wait

                                                                                                          6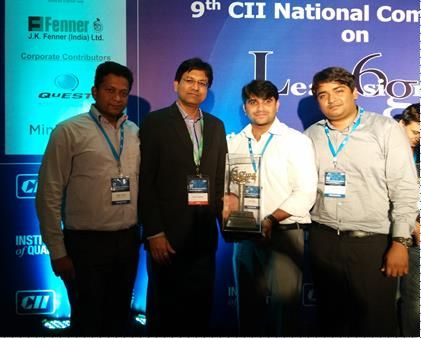
21-09-2019

 Road map to be best in class

 Specific consumption (million kcal/Million units)

                                                                                    Major lever identified are:

       9.70                                                                         1. Increase volume by cycle
                                                                                       time reduction of top four
                     8.13                                                              products

                                   6.55                                             2.Improve hot condensate
                                                  5.83                              recovery & optimization of
                                                                5.36
                                                                            5.14    steam utilization

                                                                                    3. Improve the boiler
                                                                                    efficiency by boiler tuning
                                                                                    technique's

                                                                                    4.Multiple effect evaporator
                                                                                    steam usage optimization
     FY-17          FY-18         FY-19          FY-20          FY'21       FY'22
        Dr.Reddy’s Laboratories Limited                                                       Good Health Can’t Wait

Key Projects Implemented in 2016-2017

                                                                                                Savings / Annum
S.No                                      Project Description
                                                                                                 (RS - Millions)
 1     Upgraded Air Handling Unit Existing Conventional blower by EC Blowers                           12.91

 2     Improved the burning efficiency of FO by emulsification technology                              3.23
       Eliminated chillers off-line descaling activity by automatic tube Cleaning system
 3                                                                                                     2.82
       installation
       Eliminated individual stand alone de-humidifiers and reduced power consumption
 4                                                                                                     5.93
       of HVAC (Catering to low RH area) by 20%

 5     Existing Aged chiller replaced with energy efficient chiller                                    5.20
       Upgraded Air Handling Unit Existing Dx coil based system with chilled water coil
 6                                                                                                     0.81
       system
 7     Upgraded lighting system by replacing existing fluorescent and CFL lights with LED              1.29

 8     Optimized utility pumps operation based on current duty point requirement                       3.28

        Dr.Reddy’s Laboratories Limited                                                       Good Health Can’t Wait

                                                                                                                           7
21-09-2019

Key Projects Implemented in 2017-2018 & 2018-2019

                                                                                      Savings / annum
S.No                                  Project Description
                                                                                       (RS - millions)
  1     Upgraded existing Compressed air distribution system to Ring Main System            1.00
        Effectively reduced the power consumption by installing centrifugal
  2     compressor                                                                          9.60
        in place of 8 no's screw compressors
        Upgraded existing Compressed air drying/de-humidification system by
  3                                                                                         6.40
        installing zero purge loss Dryer in place of purge loss desiccant dryer.
  4     Existing Aged chiller replaced with energy efficient chiller                        6.00
        Upgraded Air Handling Unit Existing Conventional blower by EC Blowers
  5                                                                                         4.50
        phase-II
  6     Introduced eco plugs in AC units to reduce power consumption by 15%                 1.00

        Introduced artic masters in AC units to reduce power consumption & improve
  7                                                                                         0.80
        the cooling efficiency
        Eliminated Heat pump off-line condenser descaling activity by automatic
  8                                                                                         1.40
        condenser tube cleaning system installation

       Dr.Reddy’s Laboratories Limited                                                Good Health Can’t Wait

 Energy saving projects summary

 Implemented             No of          Savings / Annum            Investment Made        Payback
     Year              Proposals         (Rs - Millions)              (Rs- million)       months

      2016-17               30                  51.40                    46.40               24

      2017-18               32                  63.10                    87.10               8.5

      2018-19               27                  21.17                    40.05              14.5

       Total                89                 135.67                   173.55              15.5

       Dr.Reddy’s Laboratories Limited                                                Good Health Can’t Wait

                                                                                                                 8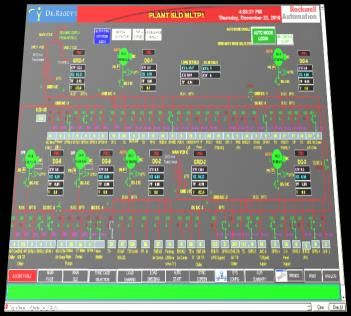
21-09-2019

     Energy conservation improvement Initiatives

Eliminated individual stand alone de-humidifiers & reduced power consumption of HVAC ( Catering to low RH area) by25%

                             The Brine chiller installation eliminated the individual standalone dehumidification
                             unit and reduced Maintenance activity.
                             The chosen proposal was tested by recording the required user and
                             engineering parameter through BMS & EMS system. After system validation &
                             qualification individual dehumidification units removed from respective AHU
                                                            Tangible Benefits
                                1. Reduction of electrical energy consumption in HVAC section
                                                          Brine Chiller Fy(2016-2017)
                                                                                         Carbon Emission
                                  Total power Saved(KWH)         Total Saving in INR
                                                                                         Reduction(Tons)
                                           9,12,960                   59,34,240               740
                                                                                      Intangible Benefits
                               1.Eliminated individual standalone
                               dehumidification unit                              1.Carbon Emission Reduction
                               2.Spare procurement nil                            2.Increase in Fire Safety Ratings
                               3.Safety risk eliminated
                               4.Auto mode operation
       Dr.Reddy’s Laboratories Limited                                                          Good Health Can’t Wait

      Energy conservation improvement initiatives
2. Reduced FO Consumption by 5% using Emulsification technique

                            Emulsification is blending of furnace oil and         FO Emulsification system Fy (2016-2017)
                            about 5 to10 % of water with emulsifying
                            agent.                                                Sl                         Total Saving in
                                                                                     Total FO Saved(KL)
                                                                                  No                               INR
                            The solution needs to be hated up to 50 Deg.C         1            134.5            3230000
                            & mixed properly with circulation pump for 3 to
                            4 hrs. For proper blending.
                                                                                  FO Emulsification system Fy (2016-2017)
                            This Emulsified furnace oil can be used
                            directly to burner without any changes in                            Total
                                                                                  Sl Total FO            Carbon Emission
                                                                                               Saving in
                            existing system, to increase the combustion           No Saved(KL)           Reduction(Tons)
                                                                                                 INR
                            efficiency of the fuel, resulting in reduction of
                            F.O. Consumption by approximately 5 to 7%,            1      135      3230000         397
                            reducing the fuel cost.
                                                                                  Benefits :
                                                                                  improves combustion efficiency of fuel
                                                                                  5% Fuel reduction

       Dr.Reddy’s Laboratories Limited                                                          Good Health Can’t Wait

                                                                                                                               9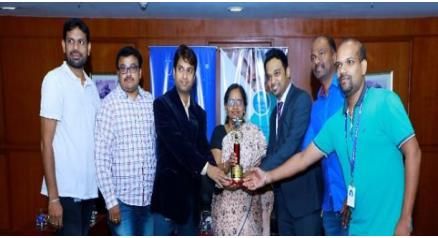
21-09-2019

   Innovative energy conservation initiatives

   1, HVAC cooling efficiency improved by installing Artic Master And achieved 20% saving on energy consumption

 Artic Master has a very innovative solution in
 increasing the condensing area by adding
 volume and creating vertex motion to the
 refrigerant.
 The increased condensing area makes the
 discharge pressure to drop. The drop in
 discharge pressure reduces the current drawn
 by the compressor.

 This allows refrigerant to expand and sub cool
 and the temperature of the refrigerant leading
 to better condensing (P ∝ T).
                                                      Tangible & intangible benefits
 As a sample study, the Artic Master was                                                               Artic Master Savings
                                                      1. Reduction of electrical energy
 installed at FTO 3 on a 11 ton AC on a trial basis                                            Total power     Total       Carbon
                                                      consumption                           Sl
 wherein:
                                                      2. Air conditioning system efficiency No Saved(KW Saving in         Emission
 1. Two days of power consumption data before                                                       H)         INR    Reduction(Tons)
                                                      improved
     and installation were compared.                                                                                         99.7
                                                      3. Better compliance to cooling                         800000
 2. Savings due to reduced electricity                                                       1 123076.9                  (Conversion
                                                      requirement.                                              Mn
     consumption was calculated to be 25.6%.                                                                            factor of 0.81)
                                                      4. Carbon Emission Reduction

        Dr.Reddy’s Laboratories Limited                                                                      Good Health Can’t Wait

               Innovative energy conservation initiatives

2,Condenser Tube cleaning system installation in Heat Pump to maintain condenser approach temperature and achieved
5% energy saving
                                                           This project involves innovative technology, excellent potential of energy
                                                           savings without effecting the chilling plant normal operation, eliminating
                                                           chiller down time due to off line descaling activity and the system helps to
                                                           maintained chilling plant efficiency at higher side. (1 o C rise in condenser
                                                           approach increases the chiller power consumption by 2 -4%. As chillers run
                                                           the energy wasted due to the rise in condenser approach was high
                                                                                   Tangible Benefits
                                                                 1. Reduction of electrical energy consumption in plant
                                                                           Condenser Tube cleaning system FY-2019
                                                                           Total power     Total Saving in     Carbon Emission
                                                                  Sl No
                                                                          Saved(KWH)             INR           Reduction(Tons)
                                                                     1       215384.6        1.4 Million             174
                                                                 2. Eliminated Heat Pump de-scaling activity
                                                                 3. Eliminated use of de-scaling chemicals
                                                                 4. Heat Pump efficiency improved
                                                                 5. Auto mode operation
                                                                           Intangible Benefits
                                                                 1. Carbon Emission Reduction

        Dr.Reddy’s Laboratories Limited                                                                      Good Health Can’t Wait

                                                                                                                                           10
21-09-2019
Innovative energy conservation initiatives
3, Upgraded air handling unit existing Conventional blower by EC blowers and achieved 35 to 40% energy saving
In Pharma company constant power load irrespective of
production or no production is because of Utilities in which
HVAC has Major contribution in power consumption units.
Tangible benefits
1. Reduction of electrical energy consumption in plant
EC Motor Blower FY (2018-2019) implementation in progress
Total power Total Saving in Carbon Emission
Sl No
Saved(KWH) INR Reduction(Tons)
1 21,52,317 1.4 Mn. 1743
2. Power Factor improved Closed to Unity
3. Better control on CFM Ramp up and Ramp down
Intangible benefits
1. Carbon Emission Reduction
2. Noise level maintaining less than 65db which is 23%
less than existing belt driven system.
3. Reduction in Cooling requirements helps improve
efficiency.
Dr.Reddy’s Laboratories Limited Good Health Can’t Wait
Utilisation of renewable energy sources at Dr Reddy’s
Solar power details Solar power consumption
Type of Installed Generation % of Overall 2018-19 (FTO-3)
Technology Onsite/Offsite
Energy Capacity(MW) (Million KWH) electrical energy
Solar PV Electrical Onsite 0.15 193290.00 0.50
Solar PV Electrical Offsite 5.0 Utilization started from April-2019
Renewable Energy consumption Across GMO
Type of Installed Generation % of Overall
Onsite/Offsite
Energy Capacity(MW) (Million KWH) electrical energy 1,93,290
Solar PV Electrical Offsite 47.8 GMO Installed capacity
Solar PV Electrical Offsite 56.0 Project finalization in progress
49.4 Million KWH solar power been utilised across GMO in FY 19 we have avoided carbon
emission by 46,473 tons of CO2e.We have also generated 179.26 TJ of energy using 5,15,58,334
biomass/rice huskbriquettes, thus eliminating GHG emission by 18,323 tons of CO2
Solar Power Plant Installation in FY-19
We added 15 MW solar power plant in FY 19 and the renewable solar power component
shall reach to 15% of overall consumption. Total PowerConsumption
(KWh)
Dr.Reddy’s Laboratories Limited Good Health Can’t Wait
1121-09-2019
Renewable Energy Trend & Roadmap for GMO
% OF RENEWABLE ENERGY
ENERGY IN TERA JOULES(TJ)
Year wise Energy (TJ)
5000 100%
4500 90%
4000 80%
3500 70%
3000 60%
2500 50%
2000 38% 40% 40%
1500 14% 30%
1000 12% 12% 14% 12% 20%
8% 8%
500 10%
0 0%
FY-14 FY-15 FY-16 FY-17 FY-18 FY- FY- FY- FY-
19(Est) 20(Est) 21(Est) 22(Est)
Renewable energy in TJ Non-Renewable energy in TJ % of Renewable energy
Dr.Reddy’s Laboratories Limited Good Health Can’t Wait
Utilisation of waste material as fuel
Hazardous waste disposal
FY 17 Hazardous waste disposal
Total Hazardous Waste Disposal – 1271 Tons 1271
Total Hazardous Waste Recycled – 564 Tons
Total Hazardous Waste Sent for incineration/ Landfilling –
707 Tons
Percentage Recycle – 44 % 825 825
FY 18 707
Total Hazardous Waste Disposal – 331 Tons 564
Total Hazardous Waste Recycled – 254 Tons
Total Hazardous Waste Sent for incineration/ Landfilling – 331
76 Tons 254
Percentage Recycle – 77 % 76
FY 19 0
Total Hazardous Waste Disposal – 825 Tons Waste Recycled Waste Sent for
Total Hazardous Waste Recycled – 825 Tons Waste Disposal and to cement incineration/
Percentage Recycle – 100 % industries Landfilling
2016-17 1271 564 707
100% waste material recycled and sending 2017-18 331 254 76
to cement industries as fuel 2018-19 825 825 0
2016-17 2017-18 2018-19 Linear (2016-17)
Dr.Reddy’s Laboratories Limited Good Health Can’t Wait
1221-09-2019
GHG Inventorisation
Scope 1 Emission Scope 2 emission KgCO2/Millions
12000 50,000 of product
10160 48,298 14000
12503
10000 48,000 12075 11838
12000
8330 8280 10262
8000 46,000 10000
44,000 8000
6000
41,853 6000
42,000 41,493
4000
4000
40,000 2000
2000
38,000 0
0 2015- 2016- 2017- 2018-
Scope 2 Scope 2 Scope 2
Scope 1 Scope 1 Scope 1 16 17 18 19
emission in emission in emission in
emission in MT emission in MT emission in MT MT CO2 MT CO2 MT CO2 KgCO2/Millions
12503 12075 11838 10262
CO2( FY17) CO2 (FY18) CO2 (FY19) (FY17) (FY18) (FY19) of product
YOY target to reduce CO2 emission by 5%
49.4 Million KWH solar power been utilised across GMO in FY 19 we have avoided carbon emission by 46,473 tons of
CO2e.We have also generated 179.26 TJ of energy using biomass/rice huskbriquettes, thus eliminating GHG emission by
18,323 tons of CO2
Dr.Reddy’s Laboratories Limited Good Health Can’t Wait
GHG Inventorisation reduction project
1 stage Wet Scrubber Replace with 2 Stage Hybrid Wet Scrubber in Coating Machine
Hybrid wet scrubber installed to reduce the emission level(100mg/m3 to 30
mg/m3) at the outlet of Coating Machine/Fluid Bed Equipment
Comparisons between 1 stage & 2 Stage Hybrid Scrubber:
Parameters Single Stage Scrubber Hybrid Scrubber
Use for Handling Only Can Handle particulate Matter and
Material Handling
Particulate Matter in Gas. solvents
Emission at the outlet of duct Emission at the outlet of duct is
Emission Control
is Approx. 100mg/m3 Approx. 30 mg/m3
Solvent Scrubbing is Solvent scrubbing is Approximately
Solvent Scrubbing
Approximately 10%. 60%.
Low Operational & High Operational & Maintenance
O & M Cost Maintenance cost compared Cost compared to single stage
to Hybrid Scrubber. scrubber
Less effluent generated than More effluent generated than single
Effluent generation
hybrid scrubber. stage scrubber
Less Hazardous Waste
More Hazardous Waste generated
Hazardous Waste generated compared to Hybrid
( Slurry + damaged Packing
generation Scrubber.
Material)
( Bottom Slurry)
Dr.Reddy’s Laboratories Limited Good Health Can’t Wait
1321-09-2019
Green supply chain/Fly ash utilisation
Green Purchase Policy
Dr.Reddy’s Laboratories Limited Good Health Can’t Wait
Fly ash utilization & boiler soot utilisation
Fly ash utilisation Boiler Soot utilisation
17000 17000 17000
11537125 11537125 11537125
10267610 10267610 10267610
5400 5400
5400
2016-17 5000 5000 5000
2017-18
2018-19
Waste Sent to
Waste Sent to
Fly ash cement/Brick Boiler Soot
Waste Recycled Waste Recycled cement/Brick
Generated (KG) industries Generated (KG)
industries industry
industry
2016-17 17000 17000 17000
2016-17 0 0 0
2017-18 5000 5000 5000
2017-18 11537125 11537125 11537125
2018-19 5400 5400 5400
2018-19 10267610 10267610 10267610 2016-17 2017-18 2018-19
Fly ash sending to brick industries utilisation Boiler soot sending to cement industries
utilisation
Dr.Reddy’s Laboratories Limited Good Health Can’t Wait
1421-09-2019
Energy Measurement and Monitoring
Daily Monitoring Report of Power Management System
Dr.Reddy’s Laboratories Limited Good Health Can’t Wait
Energy Measurement and Monitoring
POWER MANAGEMENT SYSTEM
Substantial Reduction of
• Production loss due to frequent Stoppages
of Manufacturing Equipment
• Stack Losses through Boiler Chimney
Due to Frequent Power Failures & Start Ups
• Water Consumption Due to Frequent
Stoppages of Equipment & Boilers
UTILITY MANAGEMENT SYSTEM
• Start/stop of Pumps, Cooling tower fans with feedback.
• Controlling & optimum utilization of pumps & cooling
tower fans.
• A Single Window Automation System for Centralized
Monitoring , Controlling of Utility equipment's to Improve
➢ Qualified and trained competent engineers to Operate & control real time
utility operations round the clock.
the Plant Performance.
( In compliance to 21 CFR Part 11). • Removal of manual log books.
• Alarm & Trend management for proactive actions.
➢ PMS, UMS, BMS, EMS & Effimax for measuring, monitoring and control of
Power, Utilities, HVAC and Steam boilers.
• RS Energy Matrix for Equipment OEE on web ctrl
Dr.Reddy’s Laboratories Limited Good Health Can’t Wait
1521-09-2019
Team work in Encon Projects
Different work level
team members &
cross function team
has worked for idea
generation
,implementation and
idea validation.
Identified Encon
Projects are
Implemented by
Qualified and trained
Executive through
Change
control note with Risk
assessment and
mitigation plan In
compliance to 21 CFR
Part 11.
Dr.Reddy’s Laboratories Limited Good Health Can’t Wait
Energy Management System
Energy Manager
Lead all top-down initiatives
Institutionalize ECMs across units
Track & Report energy performance
Top Management
Engineering Head
Guide for implementation & review all Top-down
Guide & review all bottom-up initiatives
initiatives Lean & Six Sigma Projects
Energy PACE Projects
Manager Engineering
Lead all bottom-up initiatives
Implementation of ECMs
Track and report energy performance
Dr.Reddy’s Laboratories Limited Good Health Can’t Wait
1621-09-2019
Power & Fuel cost reduction – Approach at Dr.Reddy’s
Every idea will pass through 5 stages
Dr.Reddy’s Laboratories Limited Good Health Can’t Wait
Projects implemented through kaizens
Kaizen No: 01
Generation Created By
22-09-2018
Date Of Completion Team Name riders
Kaizen no:
Title :optimization lighting at MME plant
Before :Earlier in WWRF MEE plant 17 numbers of lights After :Only 4 no’s of lights will be in on condition at the time
were used switch on even in non operational schedule to of non operation of MEE plant.
maintain minimum illumination . Each light capacity is 45 :4*45*10=1.8 kw/day
watts , : 17*45*10=7.650kw/day Savings =175.5kw/month
Dr.Reddy’s Laboratories Limited Good Health Can’t Wait
1721-09-2019
Environmental Recognition Received
Dr.Reddy’s Laboratories Limited Good Health Can’t Wait
% Investment on Turnover
Encon Projects Investment /
Company Turnover (Mn INR) 2018- Energy saving projects summary
2019
40.05 Savings / Investment
implemented No of Payback
annum Made (Rs
Year Proposals months
(Rs - millions) million)
2016-17 30 51.40 46.40 24
28270 2017-18 32 63.10 87.10 8.5
2018-19 27 21.17 40.05 14.5
Investment Turnover(Mn) Total 89 135.67 173.55 15.35
Dr.Reddy’s Laboratories Limited Good Health Can’t Wait
1821-09-2019
Innovative technologies implemented at Dr.Reddy’s
World Class warehouse Facility
Built World Class WH Facility
1. Streamline/ Linear Material flow from Receipt to Dispensing
2. Speed of Operation with reduction in headcounts
Incorporating Automation solution such as
1. Conveyor Automation
2. Air Tube Transfer for Sample & Document Transfer
3. Robots for Drums / Container Cleaning
Benefits
4. Manipulator & lifting devices for Handling Drums/ Containers
• Mistake Proof Packing & Muscle Power Reduction)
5. Compliance by incorporating of World Class Solutions
• Serialization & Non Serialization packing formats can be handled (300+ SKUs)
End of Line automation and AGV implementation • Prevent the Risk of product Mix up
A complete automation solution at the end-of-line packing has• Automatic Air, Sea Shipment & slip sheet pallet programmed in palletizers -
been commissioned at our manufacturing facility. • Can handle all bottle and blister packing formats and sizes. Flexibility is built in to handle future packing
The packing solution includes requirements
1. an automated case packer, • Regulatory and Competitive advantages. Online digitized labels - generation and application
2. robotic palletizer and • Prevented installation of ~250 Meters of Mechanical conveyors with implementation of AGVs.
3. auto-guided vehicles. • Highly innovative technologies implemented for safe operations
This facility provides a seamless integration for the material • 90% of the packing & ware house operations will be simplified and automated without any changes in
transfer of the finished goods and the warehouse the Business Process.
Dr.Reddy’s Laboratories Limited Good Health Can’t Wait
OUTCOME BASED SERVICE – OBS/IOT
Idea Description
▪ High Energy Consumption in HVAC Systems. 50 to 55% of the total power Consumption. Annual Spend ~ 90 Crores.
▪ Ageing Assets. Periodic Maintenance Efforts are more. Monthly and Quarterly Schedule. Example for 250 AHUs means
1000 PMs are scheduled annually excluding Breakdown Maintenance. Plant 1 - EB1-
▪ High Man Power – SLA for Operations and Maintenance. Annual Spend ~6 Crores is the total cost of SLAs. Server 01
▪ Inadequacies in maintaining environmental conditions. Example - Temp NMT25 Degrees , Rh21-09-2019
Certifications, Awards and Accolades
IInd best in Lean Six Sigma National level
Global Serialization Implementation Program Won GMEA challenger award competition by CII
Awards and Benchmarking - FTO3
1,Global Serialization Implementation Program award
received from Emerging Technologies, ITE&C
Department, Government of Telangana, India.
2, GMEA award-2013 & 2015 (Challengers award-
Mega Large Business)
3, QC Forum of India – Gold Certificate.
4, 1st Runner Up at the Lean Six Sigma National
Level Competition conducted by CII
5, Benchmarking POBOS pharmaceutical operations
benchmarking End Line Automation (Case packing,
Shipper Conveying & Auto Palletization E- pedigree Go live in FTO-3
and ASRS)
Dr.Reddy’s Laboratories Limited Good Health Can’t Wait
Dr.Reddy’s Laboratories Limited Good Health Can’t Wait
20You can also read