SWIS Coal Retirement by 2021 Modelling - 7th November 2016
←
→
Page content transcription
If your browser does not render page correctly, please read the page content below
SWIS Coal Retirement by 2021
         Modelling

       7th November 2016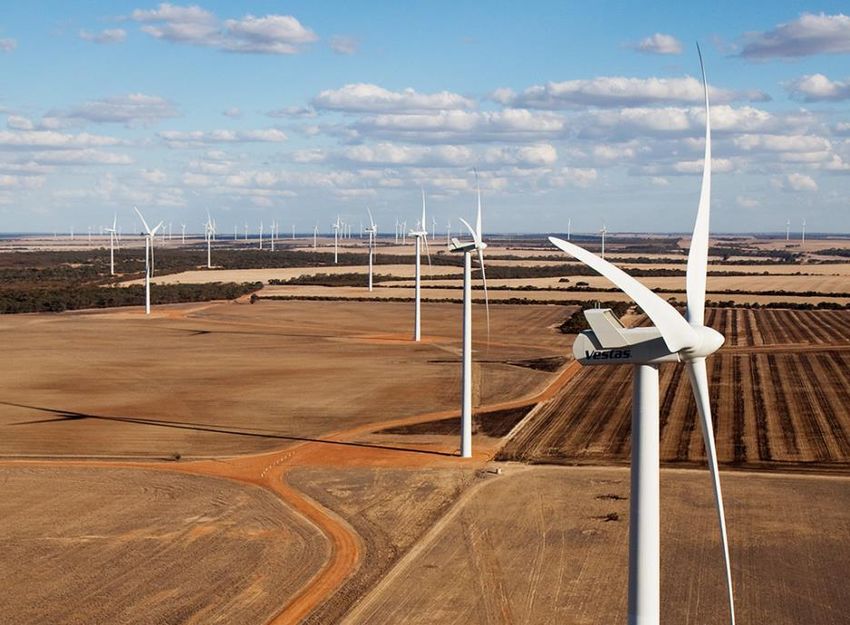
The Key Message
• The SWIS can close all coal and replace it with
  wind and solar PV with no increase in cost of
  electricity, resulting in 63% reduction in
  current electricity emissions.
• It would be feasible to close Muja ABCD and
  Collie power stations by 2021 (this term of
  government), resulting in 50% reduction in
  current electricity emissions for no increase is
  cost of electricity
• 85% reduction in emissions is feasible by 2030
SWIS 5-year transition scenario to 60% Renewable Energy with
38%of existing carbon emissions
• Introduction
• Climate imperatives; summary of 5 year transition
• How did SEN model it? – outline SIREN; outline Powerbalance
• Coal phase-out – details – LCOE’s graphs
• What would it mean for Collie:
   • Short term 5 year
   • Package for coal workers – options for redundancy,
     retraining in wind installation, mine rehabilitation, tourism
   • Installation hub – construction base for > 1000 MW of wind
   • Tower fabrication and construction
   • Possible in the longer term (10 years)
   • Biomass power generation and pellet industry; rail to Wagin
     / Katanning for biomass produced in the 400- 600 mm
     southern agricultural region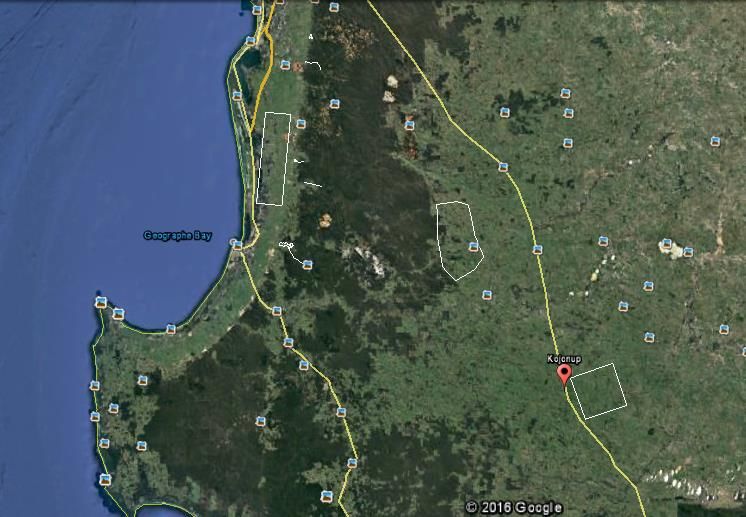
12 reasons to modernize and clean up SWIS now.
1.  REDUCE CARBON EMISSIONS. Calls for action since 1988 but still carbon
    emissions rise > 400 ppm; 2016 hottest year on record above average.
2. Increasing climate disasters in a world heated by man’s carbon emissions.
    (Examples in past 2 years - Yarloop, Northcliffe fires, Forbes floods)
3. Paris accord, 155 nations – legally binding reduction targets - Australia 28%
    reduction by 2030.
4. Labor’s target of 50% renewable energy by 2030.
5. RET target for WA means much cheaper to install RE than pay for LGC’s.
6. Wind and PV cheaper than coal and price still falling.
7. Interest rates for investors have never been lower.
8. 20 billion investment over 15 years means ‘jobs and growth’!
9. SEN technical and economic modelling indicates all coal can be replaced
    with wind and solar in 5 years REDUCING CARBON EMISSIONS BY 60%.
10. Wholesale price of electricity price will be no higher than with existing coal
11. Wind PV –zero pollution zero water use
12. Stand-alone remote and edge of grid PV-wind installations will reduce
    distribution and TAP costs

90% C emissions reduction by 2030 – cost effective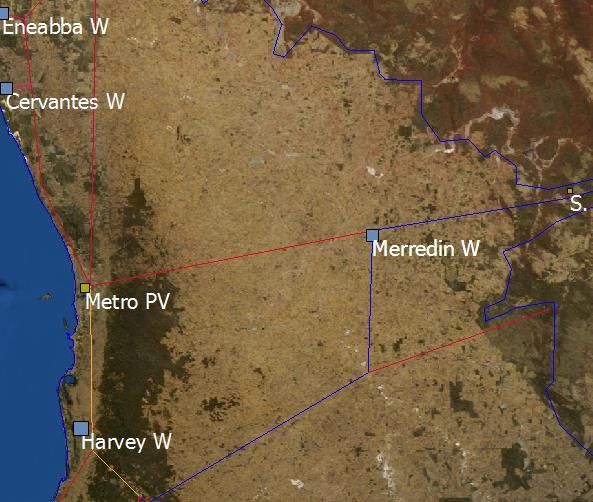
Transition from coal to renewable electricity
SEN’s modelling shows that all coal generation can
be replaced with wind and of solar PV with no
increase in electricity prices.
• No new gas generation capacity.
• Assumes RET LGC price $55/MWh and zero
   carbon price.

A vision for Collie in the next 5 years
• Muja ABCD and Collie closed
• 1000 – 1400 MW of Wind east and west of
  Collie (up to 7 Collgar windfarms)
• Up to 200 MW of utility scale PV
• CO2 emissions down by 50%, a reduction of 6.2
  million tonnes per year
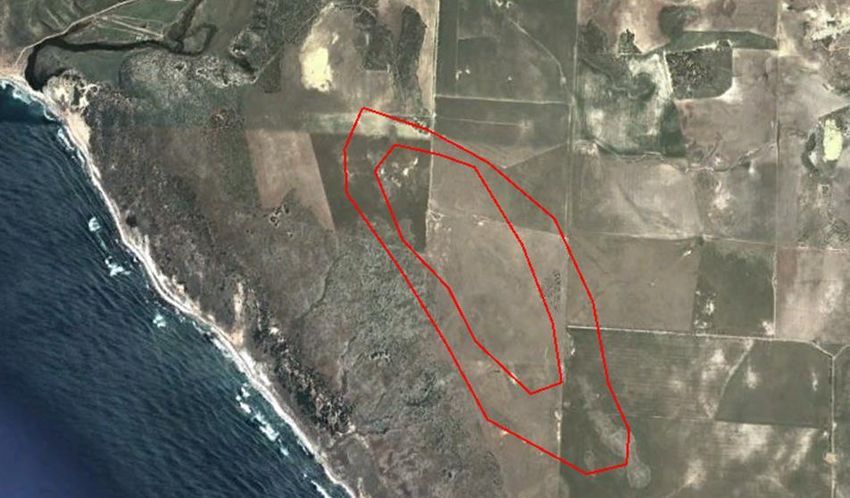
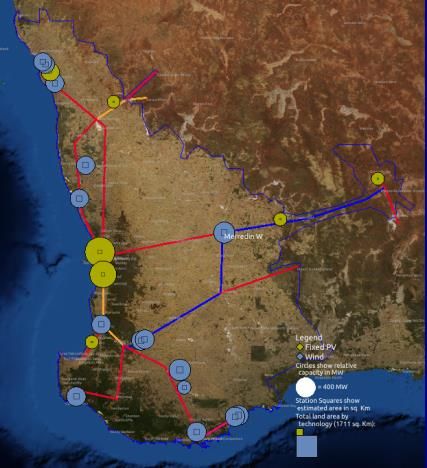
SIREN modelled map of wind and PV installation
to replace coal (Wind 2500 MW, PV 1700 MW

Higher agricultural land east of Collie and Kojonup and coastal plain
west of Harvey; 1500 MW of wind would easily fit in these 3 areas
Collgar Wind Farm (Collgar) is a $750 million
renewable energy project consisting of 111 wind
turbines located approximately 25km south east
of Merredin in Western Australia, with a
generation capacity of 206 Megawatts.
During the construction phase, Collgar employed
up to 150 people over a period of two years…….
ongoing employment for a team of 10-20 locally
based staff. http://www.collgarwindfarm.com.au/
Landholder are paid $4,000 to $8,000 per
turbine, $3,000 to $4,000 per megawatt of
capacity, or 2-4% of gross revenues.
http://www.windustry.org/how_much_do_farmers_get_paid_to_host_wind_turbines
SEN’s costing assumptions
                                                                            Recent Power
                                                                            Purchase
                                   Conservative                             Agreement
                                   LCOE's                 Reference         prices, Australia
                                                           BREE 2014 est.
Wind                                        $85                                     $77
                                                              for 2025
                                                            Solar Choice,
PV, rooftop                                 $65
                                                                2016
                                                           BREE 2014 est.
PV, fixed, utility                         $110                                    $100
                                                              for 2025
                                                           BREE 2014 est.
CST with 6 hrs storage                     $165
                                                              for 2025
                                                          nominal subsidy
‘Behind meter’ Battery                      $40
                                                               = SRET
                                                           BREE 2014 est.
Coal                                       $100
                                                              for 2025
                                                           BREE 2014 est.
Nuclear (SMR)                              $159
                                                              for 2025
* 20 year fixed PPA for Hornsdale stage 2 (Renew Economy, 23-8-2016)

** http://reneweconomy.com.au/2016/12-large-scale-solar-projects-to-get-arena-funding-and-
the-winners-are-23169
LCOE of Wind generation is falling
The 100MW Hornsdale wind project…… has achieved Australia’s lowest
known contract price for renewables at $77/MWh.
See http://reneweconomy.com.au/2015/sa-wind-farm-delivers-cheapest-wind-energy-ever-procured-in-australia-68843
Ref: Wiser et all,
2016, Berkeley Lab,
NREL, IEAPV now less than AU$35/MWh • In September 2016 Marubeni and Jinko Solar won a reverse auction to build a 350 MW solar plant in Abu Dhabi with a price of $US24.20/MWh ($A32.11/MWh) • The Marubeni-Jinko Solar bid is now the world’s lowest, the previous low being $US29.10/MWh for a solar plant in Chile • The other bids for the Abu Dhabi project were: • $US 25.90/MWh from Tenaga and Phelan Energy • $US 29.10/MWh from RWE/Belectric • $US 30.80/MWh from JGC, First Solar and Sojitz • $US 36.30/MWh from Kepco, Q Cells and GSE • The cost of solar PV in the UAE is currently around one third of the price of gas generation • Deploying solar enables the UAE to export higher volumes of natural gas • Ref:http://reneweconomy.com.au/2016/how-the-jaw-dropping-fall-in-solar-prices- will-change-energy-markets-55160
SEN’s modelled LCOE’s for scenarios for reducing carbon
              emissions on the SWIS electricity grid
  With a RET LGC price of $55, closing all coal and replacing with
  wind and PV generation would not increase the wholesale
  electricity price, while deceasing CO2 emissions by 50%
                                 Close      Close Muja   Close MujaNo coal, no       Wind, PV max.
                        Close    Muja       AB; CCS      AB; New storage,           economic
              BAU       Muja     ABCD       retrofit     coal      incr.Wind, PV;   without
              existing; ABCD;    Collie;    coal;        retrofit  Eq to CCS;       storage
              C=100% C=69%       C=50.3%    C=38.3%      C=38.3%; C=37.2%           C=24.4%
  Zero C price
                 $91       $99     $109        $106        $132         $109            $117
 and zero RET
                  $109   $112      $119        $113        $140         $116            $122
   $30 C price
$55 LGC price,
      20% RET     $98     $96      $100        $113        $140         $98              $90
 target; excess
     LGC's sold
 RET as above;
  Recent PPA's
                  $98     $94         $97      $113        $140         $94              $84
for wind, PV in
      Australia
        Note: $100 / MWh = 10c /kWh
50% reduction in C >90% reduction in C Existing emissions emissions 2016 achievable by 2021 achievable by 2030
Summary of modelled scenarios: coal phase-out to
                  100% renewable energy for the SWIS
         Percentage of total electricity generation by technology

                                                                                               Overbuild
                                                                                   Overbuild Wind, PV;
                                  Close                   Overbuild   Overbuild    Wind, PV; biomass
                        Close     Muja       No coal      Wind, PV    Wind, PV;    CST and     with molten
                        Muja      ABCD and power, no      Max.        behind the   biomass     salt storage
                        ABCD      Collie     storage,     economic    meter        with        and pumped
              BAU       power     power      increase     without     battery      molten salt hydro
              existing  stations stations (C Wind, PV     storage     storage,     storage,    storage,
              (C=100% ) (C=71.6%) = 56.4%) (C=38.7%)      (C=23.9%)   (C=16.9%)    (C=9%)      (C=9%)

Coal              41.8%     26.3%     15.3%        0.0%        0.0%         0.0%         0.0%        0.0%
CCGT              40.1%     36.4%     39.4%       34.9%        0.0%         0.0%         0.0%        0.0%
OCGT               5.9%      4.9%      5.5%       17.1%       27.3%        11.4%         9.0%        9.0%
PV                 5.6%     10.6%     15.2%       17.2%       21.1%        22.5%        17.6%       20.2%
Wind               6.8%     21.8%     24.7%       30.8%       51.6%        62.3%        59.3%       58.3%
Biomass/ MS        0.0%      0.0%      0.0%        0.0%        0.0%         0.0%         7.4%        7.5%
CST/MS             0.0%      0.0%      0.0%        0.0%        0.0%         0.0%         5.4%        0.0%
PHS                0.0%      0.0%      0.0%        0.0%        0.0%         0.0%         0.0%        3.3%
BM Battery         0.0%      0.0%      0.0%        0.0%        0.0%         3.7%         1.4%        1.7%
total            100.2%    100.0%    100.0%      100.0%      100.0%       100.0%       100.0%      100.0%
Power capacity for SWIS transition scenarios
Power Capacity MW
Renewable
Renewable Energy -
2021 Close Energy - maximum
all Muja equivalent C economic
Close Muja ABCD & emissions to without
Technology Existing ABCD Collie CCS storage
CCGT 1475 1475 1475 1000 0
Coal 1778 752 435 0 0
OCGT 1659 1486 1486 2600 3000
Rooftop PV 500 800 1400 1200 2300
Fixed PV 10 200 500 500 400
Wind 500 1700 2300 2600 4800
TOTAL 5922 6413 7596 7900 10500Overbuild
Wind, PV;
biomass
Overbuild with
Close Overbuild Overbuild Wind, PV; molten salt
Muja Close No coal Wind, PV Wind, PV; CST and storage
ABCD Muja power, no Maximum behind the biomass and
BAU power ABCD and storage, economic meter with pumped
existing stations Collie increase without battery molten salt hydro
(C=100% (C power Wind, PV storage storage, storage, storage,
) =71.6%) stations - (C=38.7%) (C=23.9%) (C=16.9%) (C=9%) (C=9%)
Weighted average LCOE of scenarios
LCOE with Zero C $91 $99 $109 $109 $117 $124 $137 $136
price and zero RET
LCOE with $30 C
$109 $112 $119 $116 $122 n/a n/a n/a
price
LCOE with 20% RET
target; $55 LGC
$98 $96 $100 $98 n/a n/a n/a n/a
price, excess LGC's
sold
LCOE with RET as
above; current
$98 $94 $97 $94 n/a n/a n/a n/a
PPA's for wind, PV
in AustraliaAnnualized cost of transmission is < $3 / MWh (for 3200
MW of dispersed utility scale wind and PV)
Main line Connector
Peak Max. line distance to distance to LINE + END
(MW) for MW = be costed be costed STATION
Name station 5*MW/8 Line type Cost per km end station (km) (km) COSTS
Kojonup Wind 400 500 330s $1,000,000 $8,000,000 111 10 $129,000,000
Collie E Wind 400 330s $1,000,000 $8,000,000 0 20 $28,000,000
Harvey Wind 500 330s $1,000,000 $8,000,000 0 10 $18,000,000
Three Springs 1000 330d $1,500,000 $0 275 0 $412,500,000
Karara PV 350 330s $1,000,000 $8,000,000 0 10 $18,000,000
Cervantes Wind 400 330s $1,000,000 $8,000,000 0 20 $28,000,000
Eneabba Wind 400 330s $1,000,000 $8,000,000 0 40 $48,000,000
Merredin Wind 400 500 330s $1,000,000 $8,000,000 228 20 $256,000,000
Southern Cross PV 350 330s $1,000,000 $8,000,000 0 10 $18,000,000
MW of
dispersed Total cost of
utility scale new lines
wind and plus sub-
PV 3,200 stations $955,500,000
Total
transmissio
n line
kilometres 754
Annualize
Note: 1000 MW of PV in metro area not included as no transmission needed
d cost per $Modelled scenarios for reducing carbon emissions on the SWIS
Weighted average LCOE* of Modelled scenarios for
    reducing carbon emissions on the SWIS
                                             Close               No coal, no    Wind, PV
                               Close Muja    Muja AB;   Close    storage,      max.
                       Close   ABCD Collie   CCS        Muja AB; incr.Wind,    economic
             BAU       Muja    (BW 1&2       retrofit   New coal PV; Eq to     without
             existing; ABCD;   remain);      coal;      retrofit CCS;          storage
             C=100% C=69%      C=50.3%       C=38.3%    C=38.3%; C=37.2%       C=24.4%
 Zero C price    $91     $99         $109      $106       $132       $109          $117
and zero RET

                 $109   $112         $119      $113       $140       $116          $122
  $30 C price
     $55 LGC
   price, 20%
  RET target;    $98     $96         $100      $113       $140       $98            $90
 excess LGC's
          sold
RET as above;
current PPA's
                 $98     $94         $97       $113       $140       $94            $84
 for wind, PV
  in Australia

         *close to wholesale price
Transitioning
WA needs a
RENEWABLE ENERGY
TRANSITION Planning
Agency.
$85 MWh
Generates at nightSynergy plan for Carbon Capture and Storage
(CCS) for Collie coal plant
SEN’s modelling shows:
• CCS retrofit of old plants will cost about the same as the Wind –
PV option. (LCOE $106/MWh compared to $109)
• With current RET the LCOE of CCS option is higher than Wind-PV
($113 compared to $94)
• Increased maintenance of old plants would inevitably push the
LCOE higher.
• New coal – CCS plants are not cost effective – LCOE $133/MWh
or $136 with RET.
• Coal CCS is not yet ‘stand alone commercial’ on power stations;
high technical and social risks and the energy is not renewable.
• Less popular politically and foregoes the employment
opportunities of wind and PV.Summary of modelled carbon capture and storage (CCS) scenarios for
the SWIS, compared with renewable energy scenario
Percentage of total electricity generation
No coal, no storage,
Close Muja AB; CCS Close Muja AB; New increase Wind, PV
retrofit (C=40.9%)) coal CCS (C=40%) (C=38.7%)
Coal 41.9% 40.3% 0.0%
CCGT 40.3% 41.9% 34.9%
OCGT 5.6% 5.6% 17.1%
PV 5.6% 5.6% 17.2%
Wind 6.8% 6.8% 30.8%
Biomass/ MS 0.0% 0.0% 0.0%
CST/MS 0.0% 0.0% 0.0%
PHS 0.0% 0.0% 0.0%
BM Battery 0.0% 0.0% 0.0%
total 100.3% 100.2% 100.0%
Weighted average LCOE of scenarios
LCOE with Zero C price and zero RET $106 $132 $109
LCOE with $30 C price $113 $140 $116
LCOE with 20% RET target; $55 LGC
$113 $140 $98
price, excess LGC's sold
LCOE with RET as above; current PPA's
$113 $140 $94
for wind, PV in AustraliaCarbon Capture and Storage (CCS) $140 billion 140 megawatt (MW) power station in Canada “When the coal-fired 140 megawatt (MW) Boundary Dam power station with a CCS plant was officially opened in early October 2014 ……it was touted as the world’s first “commercial scale” CCS plant……..” In the last two weeks, SaskPower’s carefully-crafted illusion of the CCS plant as a success story has been shattered by revelations in a series of leaked internal documents. Instead of capturing 90 per cent of the carbon dioxide from the power station, the plant has captured about half that amount or less. Problems with the plant have meant that it has often been shut down.” http://reneweconomy.com.au/2015/the-fallout-from-saskpowers-boundary- dam-ccs-debacle-54803
Jobs- comparing technologies
       • Permanent O&M jobs per MW in biomass, wind and PV
         outnumber those for coal by 2 to seven-fold.
       • Construction, installation and manufacturing jobs for
         wind plus PV are greater than new coal as wind capacity
         (MW) to be constructed = 3.5*coal; PV = 1*coal
                                                                              operations &
                   construction/                                              maintenance
                   installation                 manufacturing                 Jobs/MW               Fuel
                   Job years/MW                 Job years/MW                  Jobs/ MW              jobs/GWh
Coal                                    11.2                            5.4                  0.14
Gas                                       1.3                         0.93                   0.14
Biomass                                    14                           2.9                   1.5          0.108
Wind                                      3.2                           4.7                   0.3
PV                                         13                           6.7                   0.7
 Ref: Energy Revolution: A Sustainable World Energy Outlook 2015. Greenpeace International
Jobs for a 100 % RE scenario for the SWIS grid:
>8000 permanent jobs, > 150,000 job years in
construction and manufacturing
Jobs for WA
C&I O&M Manf. Manufact
Cap. C&I O&M
Technology (Job (Jobs/ (Job Yrs. -uring
(MW) Job years Jobs
Yrs../MW) MW) / MW) Job years
Roof-top PV 13.0 0.7 6.7 2,000 26,000 1,400 13,400
Fixed Solar PV
13.0 0.7 6.7 1,000 13,000 700 6,700
Farm
Wind Farm 3.2 0.3 4.7 6,000 19,200 1,800 28,200
Biomass Facility 14.0 1.5 2.9 3,000 42,000 4,500 8,700
TOTAL S 12,000 100,200 8,400 57,000
• Based on 85% scenario, but substituting biofuel for gas in order to
achieve 100% RE. This scenario includes the following mix of generation
technologies and their associated capacities:
• 6,000 MW of wind; 3,000 MW of solar PV;
• 3,000 MW of gas fuelled turbines fuelled with bio-fuels.Jobs in Biomass industries for Collie
1. 2017 - 25
• Establish and expand mallee woodchip production on farms in the
Great Southern region.
• Hundreds of jobs growing harvesting and transporting woodchips
• 120 km railway to Wagin / Narrogin – $360 m project.
• construction and maintenance jobs based in Collie.
2. 2020-22
• Construct 400 MW biomass with molten salt storage (MS) at Collie :
• 150 permanent jobs* and 8000 job years in construction and manufacturing
*(50 MW biomass plant in Vermont employs 40)
3. 2021-25
• Establish wood pellet manufacturing plant in Collie and export from
Bunbury port.
• 85,000 tpa plant in NY State employs 16; another 100 in wood supply
and support industries. $10 million in payroll, wood purchase and other
expenditures annually.
• http://biomassmagazine.com/articles/5579/production-begins-at-largest-wood-pellet-plant-
in-northeast-u-sSIREN Toolbox
How did SEN model it?
SIREN
Sophisticated computer
model with simple user
interface
Users explore potential
location and scale of
renewable energy
sources (stations,
storage, transmission)
to meet electricity
demand
Can be based upon
existing networkWeather affects generation
• Weather data that
reflects actual weather
conditions of the past
enables any model to
better map actual load
demand
• For example, hot
weather increases air
conditioning load
• NASA MERRA data
• NASA reanalysed
satellite data
• Worldwide solar and
wind dataPlace and size Stations
• Click to add Station
• Simple interface to
specify Station details
• Save & reload ScenariosModel Power generation • System Advisor Model (SAM) models from US DoE National Renewable Energy Laboratory (NREL) • Model for each station and produce combined result • Match generation to Load • Strong correlation (0.77) between SAM calculated generation and actual generation validates use of SAM models and MERRA data
SIREN TOOLKIT
  Process
   Flow
How does it compare?
●   Validated SAM calculated generation with actual generation
     –   Average correlation is 0.77, (0.70-0.83 for wind, 0.95 for the one utility scale PV farm)
     –   Validates use of US DoE ‘SAM’ modules and NASA ‘MERRA’ data
     –   Correlation of actual generation with calculated gives confidence to use this approach
What is POWERBALANCE?
Programmed Excel spreadsheet templates for
scenario types.
What does it do?
• Quantifies and costs dispatchable energy
generation, storage and CO2 emissions.
• Balances power with load for 8760 hours of a
year.
• Enables you to complete a costed RE scenario.1 Siren
2 PB
data
8760 hr
3 Powerbalance39
Deep, prolonged shortfalls in RE generation.

• To provide enough energy for all shortfall periods during winter, storage
  would have to be increased 100-fold, increasing LCOE to >$500/ MWh.
• OCGT’s are the most cost effective generation capacity to cover periods of
  low wind and sun.
                                                                               40
Replacement of coal with wind and solar
PV generation can be achieved by 2021
SEN’s modelling shows that all coal generation can be
replaced with:
• 2500 MW of wind
• 1700 MW of solar PV
Competitive with current grid generation LCOE
$114/MWh; $96/MWh with RET
A vision for Collie in the next 5 years
• 1000 – 1400 MW of Wind east and west of Collie
(5 - 7 Collgar windfarms)
• Up to 200 MW of utility scale PV
• CO2 emissions reduced to 38% of current
CO2 emissions down by >60% from 11.7 to 4.5 million
tonnes (reduction of 7.2 million tonnes)Coal is on the way out, too polluting; too carbon
intensive. The aging power stations are due for
replacement:
COAL-FUELLED Owner Yr built Retire Retmt age, MW
GENERATORS yrs capacity
MUJA AB (G1, G2, G3, G4) Synergy 1965 2016 51 220
Muja C (G5, G6) Synergy 1981 2017 36 385
Muja D G7, G8) Synergy 1985 2019 34 422
Collie Synergy 1990 2019 29 317
Bluewaters 1 Sumitomo 2009 2029 20 217
Bluewaters 2 Sumitomo 2009 2030 21 217
On economic grounds , even if pollution is ignored, the
old coal power plants should be closed at 30 years of
age (design life) or before and replaced with new wind
& PV generation.STORAGE
Economic to store 5 – 15% of the cheap
renewable energy for use at night
‘Behind the Meter’
Batteries
Concentrating Solar
Thermal with Molten Salt
Storage
Pumped Ocean
Hydro‘Roadmap’ to the Future SWIS?
RETIRE COAL - REPLACE WITH RENEWABLES
Electricity Generation & Demand, MWh
25000
20000
Coal Subtot
Gas, Diesel or Biofuel Subtot
15000
RE Subtot incl rooftop PV
DEMAND
10000
5000
0
2015 2017 2019 2021 2023 2025 2027 2029What might a modern renewable electricity generation
system for WA look like? One scenario achievable by 2030:
Percent renewable energy 91.0%
CO2e million tonnes; 1.32
CO2 % of BAU 9.88%
% of total annual LCOE $/MWh
LCOE $/MWh MW power MWh storage
Energy source grid energy (BREE AETA
(likely 2020) capacity capacity
demand 2025)
Wind 59.3% $85 $77 5800 n/a
PV 17.6% $80 $75 2400 n/a
(Surplus Wind and PV) 17.1%
CST 5.4% $165 $140 500 7000
BM Battery 1.4% $40 $40 n/a 2000
PHS 0.0% $0 $0 0 0
Biomass / MS (at Collie) 7.4% $249 $249 400 6400
OCGT 9.0% $219 $219
2200 n/a
Weighted average LCoE ($/MWh)
$137 $128 Plus
with zero C price, zero RET
transmission
$6-7/ MWhKey policies for renewable electricity
1. Keep Western Power government owned.
2. Enable WP to provide grid storage to manage and facilitate RE.
3. Balancing generators (OCGT, biomass and grid storage) should all be
owned by Govt. (Synergy) to prevent price gouging during shortfall
periods by corporate power oligopoly.
4. Secure gas supply agreements and pipeline capacity to cover peak
gas demand for electricity generation.
5. An Office and Renewable Energy answering directly to Dept. of
Premier and Cabinet to plan RE transition, with WP and Synergy.
6. Supply tariff and feed-in tariff incentives for behind the meter
battery storage and rooftop solar.
7. Reform electricity market - power purchase agreements with
‘contracts for difference’ enabling private industry to supply all
wind, solar PV and solar CST generation at stable prices.
8. Incentives and assistance for biomass production and renewable
fuel industries.
9. Legislation to ensure biomass for energy is not harvested from
native forest.Biomass generation and wood pellet industry for Collie in 10 years?
A future for Collie
• Short term 5 year
• Package for coal workers – options for redundancy,
  retraining in wind installation, mine rehabilitation,
  tourism
• Installation hub – construction base for > 1000 MW of
  wind generation within 100 km of Collie
• Possible tower fabrication and construction
• Possible in the longer term (10 years)
• Biomass power generation and pellet industry; rail to
  Wagin / Katanning for biomass produced in the 400-
  600 mm southern agricultural region
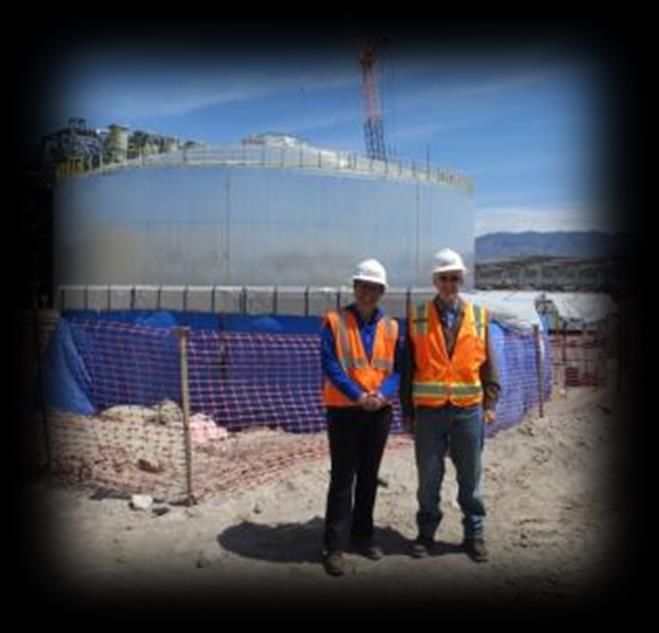
Biomass thermal power generation with Molten Salt storage. Up to
400 MW could be located at Collie (using plantation and waste biomass only)

 50 MW McNeil Biomass
 Power station Vermont, US

                                                                  Molten salt tank
                                                                  at 110 MW
                                                                  Concentrating
                                                                  Solar Thermal
                                                                  power station in
                                                                  Nevada
WA Biomass resources (Mt = million dry tonnes)
Biomass from Oil Mallee “Alleys”
on 10 % of dryland farms 3.6 Mt
10% of the Gt Southern Region
alone would produce enough (1.2
Mt) to generate 10% of projected
2029 electricity demand.
Note: need to legislate no biomass harvest
from state forests
Wood waste - pine and blue gum
plantations, and municipal
combustible waste – >1 Mt
Cereal straw – up to 1
Mt (wheat belt )Oil mallee - a coppicing crop for biomass energy:
electricity generation and wood pellets for export
120 -140 km of new rail
Collie to Wagin or
Katanning. Cost $360 –
400 million. To transport
1.2 million tonnes* of
woodchips for a 400 MW
power station plus 0.2
million tonnes for wood
pellet exports. (*seven
5,000 tonne trains per day)
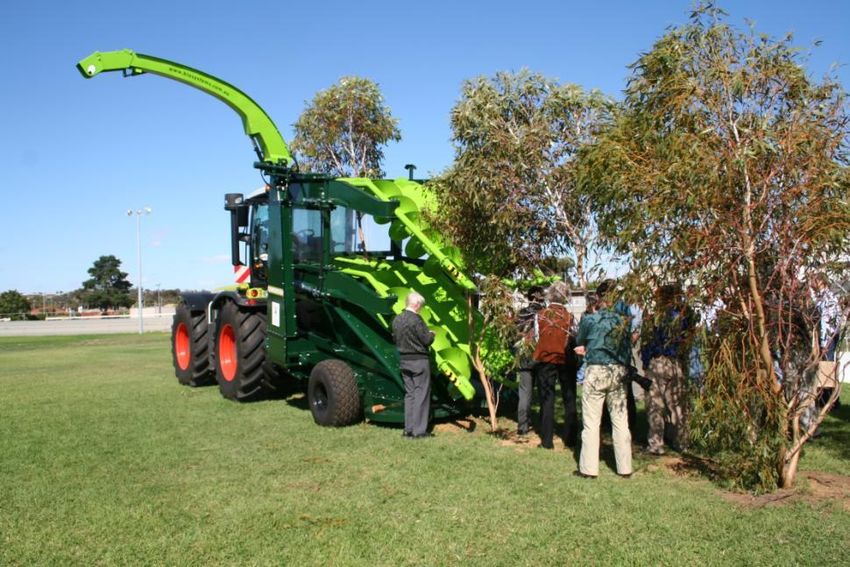
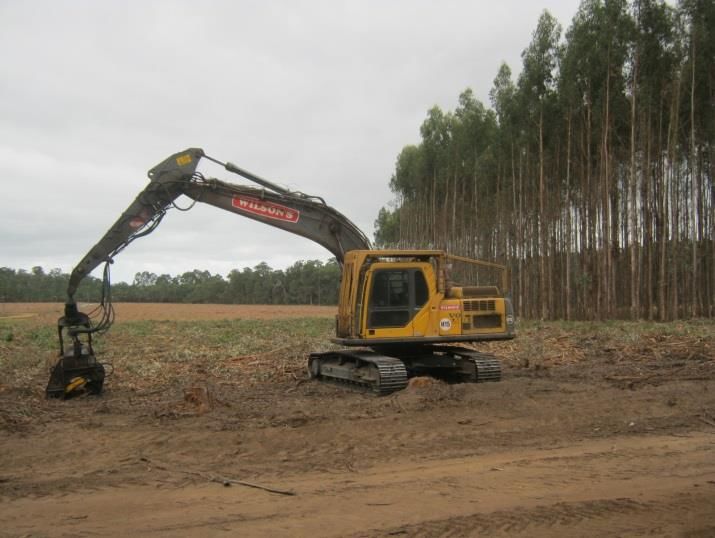
Harvester cuts coppiced trees
at ground level, chops
biomass to size, and chutes it
into a mobile hopper, which
conveys it to road trucks.
(Photo: courtesy John Bartle)Additional slides
(to illustrate FAQ’s)
52We can do hands-on SIREN Toolkit training workshops
53Table 8. Variation in renewable energy generation and weighted average
LCOE over 7 years (Scenario Wind 6000 PV 3000 with 8000 MWh of storage)
% Behind % Weighted
% Direct Wind % Gas OCGT
Year Meter Battery Renewable average
and PV Fuelled
Storage Energy LCOE
2007 86.5% 3.8% 9.7% 90.3% $122
2008 84.5% 3.9% 11.7% 88.3% $125
2009 85.5% 3.7% 10.8% 89.2% $127
2010 83.1% 3.7% 13.1% 86.9% $127
2011 83.6% 3.7% 12.7% 87.3% $124
2013 81.4% 4.1% 14.5% 85.5% $129
2014 81.9% 4.4% 13.7% 86.3% $128
110.0%
100.0%
90.0%
80.0% % Gas
70.0% OCGT
Fuelled
60.0%
50.0% % Behind
Meter
40.0% Battery
30.0% Storage
% Direct
20.0% Wind and
10.0% PV
0.0%
2007 2008 2009 2010 2011 2013 2014DISPATCHABLE
POWER AND
STORAGE
COSTING
‘Disp. Power Costs’ ‘RE LCOE;
tab EF's tables’
tabDispatch order – most to least capital intensive
1. Wind and solar PV
2. BM battery will be used first by consumers regardless of grid
dispatch orders.
3. Thermal biomass generation ($750,000/MW/yr.
4. Solar CST with MS (500,000/MW/yr.)
5. Additional MS storage ($7,000/MWh/yr.)
6. Co-firing of MS storage ($350,000 – $400,000 per MW/yr.)
7. PHS ($241,000/MW/yr.)
8. Additional PHS ($5,000/MWh/yr.)
9. OCGT generation is always dispatched last ( $90,000 per MW
capacity) Highest fuel cost ($128/MWh for gas and $371/MWh for
bio-oil
10. Load reduction by demand side management (DSM)
56Potential Biomass Resources in WA
Dry biomass (oil mallee) from 10% of WA grain belt 3,640,000
(0.1*14 million ha * 2.6t / ha/ yr.)* tons/yr.
2,000,000
Straw and wood (plantation) waste**
tons/yr.
Annual BIOMASS FUELED ELECTRICITY that could be
9600 GWh
generated @ (1.7 MWh/dry ton)
Total annual generation WA South West Grid 2029 23,000 GWh
Potential TOTAL BIOMASS FUELED ELECTRICITY % of total
42%
energy sent out in 2029Thermal generation – fuel cost comparison
Energy Energy Fuel cost $ /
delivered content content MWh electricity
cost / dry GJ/dry MWh/ dry generated at
Resource tonne tonne* tonne 33% efficiency
Oil mallee
$98 19.5 5.4 6.0
Straw
$104 15.1 4.2 8.3
Plantation wood
waste $30 16 4.4 2.3
(Coal - Collie)
$45 21 5.8 2.5
(Gas - WA
domestic) ** $223 53.6 14.9 5.0
(Gas - LNG export
price 2011) $523 54.6 15.2 11.5
* Dry tonne is 10% moisture
** BREE, 2012. Gas Market ReportOpen Cycle Gas
Turbines
5- 15% of energy
• OCGT ‘Fleet’ of
30 – 60
• In Metro and
industrial areas.
• Energy cost $200 - $550 / • 1 in 6 equipped to
MWh. run as synchronous
• Dual fuel – gas cheaper than compensators.
diesel or bio-oil. (Industry for Collie?)KEY FINDINGS 1. A modernized SWIS renewable electricity generation system would cost no more than renewing the existing coal & gas system. 85-90% renewable energy • 55-65% wind 20-30% PV • Storage – 5 - 10%; surplus wind, PV. • Molten Salt or Pumped hydro; some BM battery • 10 - 15% gas OCGT • CO2 emissions 10-15% of BAU
2. 100% Renewable Electricity is achievable
 • 3 scenarios (3-5 in Study) presented as
   examples.
 • About 50-65% wind, 15-25% PV for
    primary energy source.
 • CO2 Emissions – 7 – 8 % of BAU.
 • Cost $155 – 165 / MWh; 3-4c/kWh more than
   renewing the existing coal – gas system.
 • Have large scale grid storage – CST MS or PHS
   – 5- 8% of energy goes through storage.
 • Bio – fuelled OCGTs for dispatchable
   generation.
Scenarios – Cost and Emissions
ComparisonTable 10. Summary of scenario costs and carbon emissions.
Scenario Average Emissions Total Cost of % Annual LC of new
LCoE (% of BAU Emissions emissions surplus energy trans-
($/MWh) Scenario 6) (ktCO2e) reduction generat- cost ($m) mission
from BAU ion lines
($/tCO2e) ($/MWh)
Scenario 1:
$128 16.9% 2,266 -$6 21.8% $2,977 $7 – 9
85% RE
Scenario 2:
$138 11.9% 1,595 $17 14.0% $3,248 $7 – 9
91% RE
Scenario 3:
$159 8.2% 1,095 $57 14.0% $3,749 $7 – 9
100% RE
Scenario 4:
$160 8.6% 1,158 $59 20.7% $3,763 $7 – 9
100% RE
Scenario 5:
$165 9.4% 1,256 $70 23.6% $3,902 $7 – 9
100% RE
Scenario6:
$129 100.0% 13,391 $30 0.0% $3,056 $0
BAU
63Scenario Comparisons
Other costs and benefits
Renewable options
– Transmission costs $7 - 9/MWh (< 1c/kWh).
– If surplus energy from high wind scenarios
were sold at $30/MWh it would reduce cost
by $6/MWh.
Coal
– Carbon cost risk. Scenario was modelled with
carbon price of $30/tCO2. If increased to real
cost (about $60/ t CO2e) would increase LCOE
by $25/ MWh (2.5c/unit).
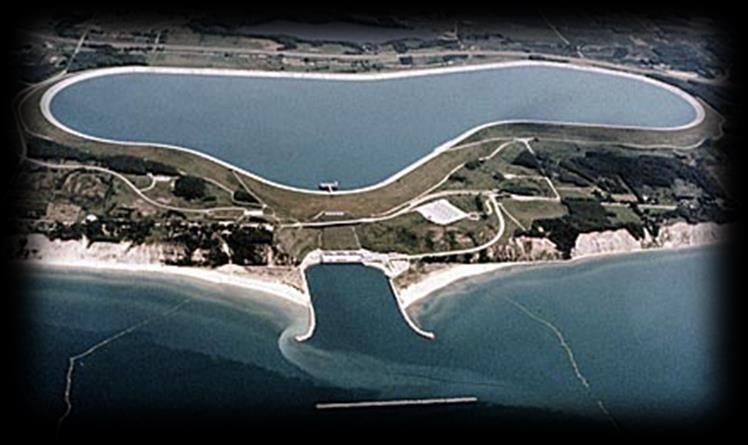
– CCS not economic; not currently commercial.Pumped hydro ocean storage sites in WA - 1 of 4 potential sites 40 – 70 km north of Geraldton: 230 ha, 110 – 120 m elevation, on farm land 1.2 km from ocean - More potential sites 100 – 120 km east of Albany
Pumped-Hydro examples

• Ludington reservoir, Lake Michigan
• 34 m deep with 110 M head, 4 km long (350 ha)
• 6 turbines, can generate 1872 MW for over 13 hours
170 m CST tower at Solar
Reserve’s 110 MW plant in
Nevada
Carbon emissions by sector:
                         WA and Australia
2013 CARBON EMISSIONS BY SECTOR                   WA emissions           Australia emissions
                                                  Mt CO2e %              Mt CO2e %
Agriculture forestry and fishing                          24     39.6%       100.7      18.3%
Mining                                                   5.3       8.7%       63.8      11.6%
Manufacturing                                             10     16.5%        70.7      12.9%
Electricity gas and water                              10.8      17.8%       191.8      34.9%
Services construction and Transport                      6.5     10.7%        65.4      11.9%
Residential                                                4       6.6%       57.1      10.4%
TOTAL                                                  60.6 100.0%           549.4 100.0%
Source: National Inventory by Economic Sector 2013 Australia’s National Greenhouse Accounts
Commercial services and construction
You can also read