VEHICLE EMISSIONS - WIDENING THE LENS - 6th July 2020 - The Advanced ...
←
→
Page content transcription
If your browser does not render page correctly, please read the page content below

VEHICLE EMISSIONS –
 WIDENING THE LENS
             6th July 2020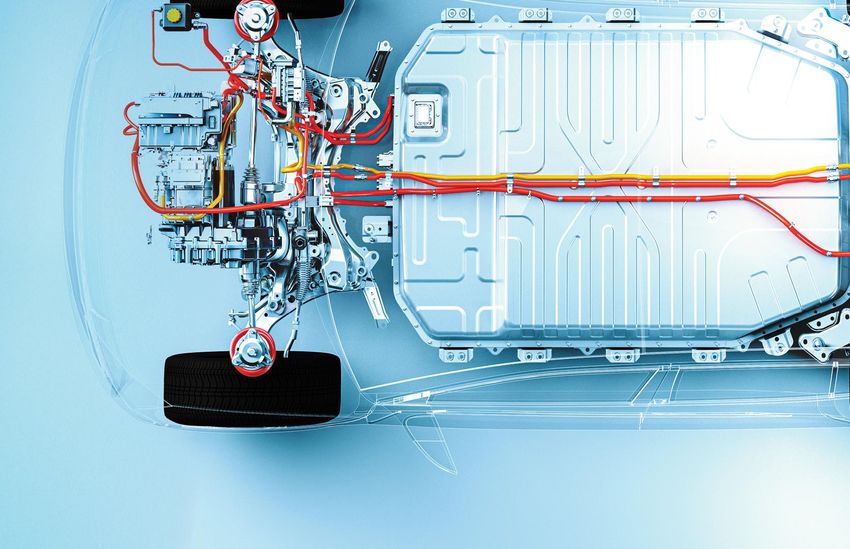
LIFE CYCLE CO2e
       EMISSIONS FROM
     ELECTRIC VEHICLE
PRODUCTION AND WIDER
SUSTAINABILITY IMPACTS
   Jane Patterson, Ricardo Strategic Consulting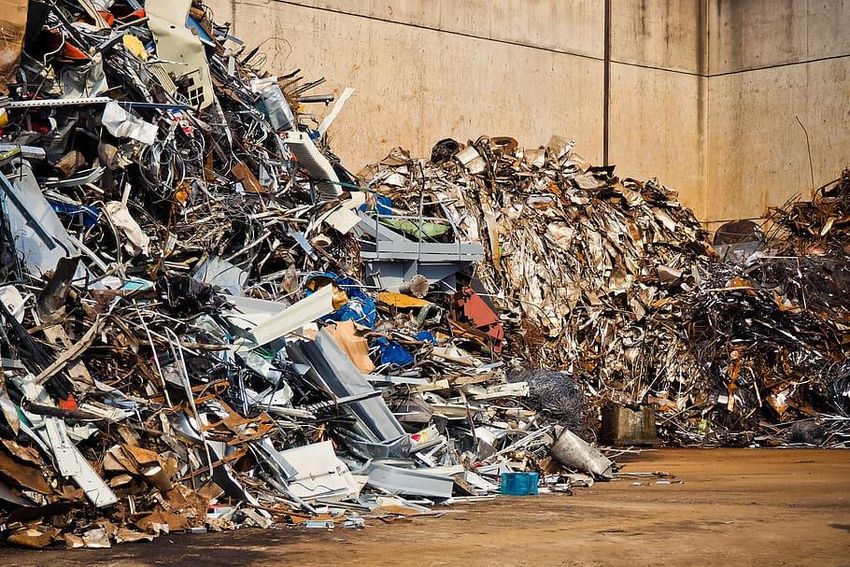
About Ricardo

Brief overview of Ricardo – over 100 year history of delivering excellence – we work
with our clients to create a world fit for the future

     We are a global, multi-industry, multi-
     discipline consultancy and niche
     manufacturer of high performance
     products
                                                             Hybrid and Electrical Vehicles        Engines          Niche Manufacturing

     The objective throughout our history
     has been to maximise efficiency and
     eliminate waste in everything we do
                                                                      Drivelines              Vehicle Engineering   Strategic Consulting

     3,000+ staff                                                      Software                     Testing         Knowledge & Training

     88 nationalities
     51 sites in 20 countries
                                                              Environmental Consulting        Energy Consulting       Assurance & Cert

© Ricardo plc 2020            Unclassified - Public Domain                                                                  6 July 2020    3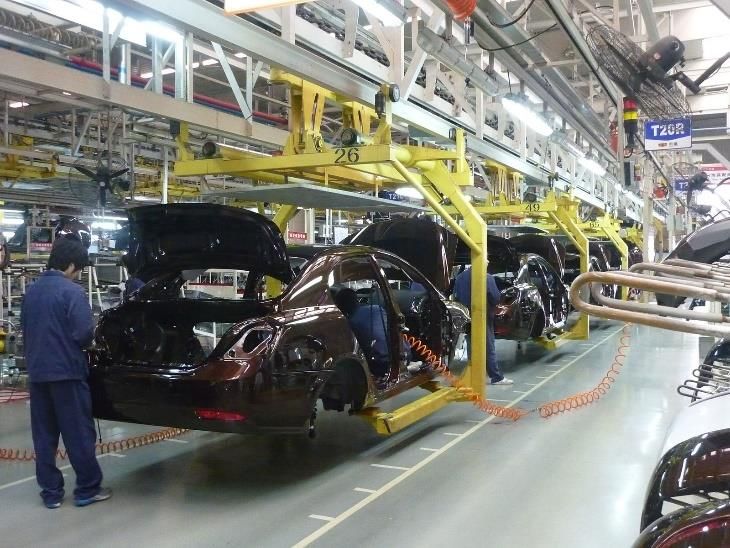
Introduction

This Keynote: An overview into the challenge of sustainability as the focus shifts
from ‘in-use’ emissions to those produced throughout the rest of the life cycle

             •       What challenge do we need to solve?
                                                                                      Design

             •       Why do we need to take a life cycle approach?

                                                                                    Life Cycle
             •       Let’s take a closer look at vehicle production     Disposal                 Production
                                                                                   Philosophy

             •       So, what is the trade-off between production and
                     in-use?
                                                                                       Use

© Ricardo plc 2020                Unclassified - Public Domain                                   6 July 2020   4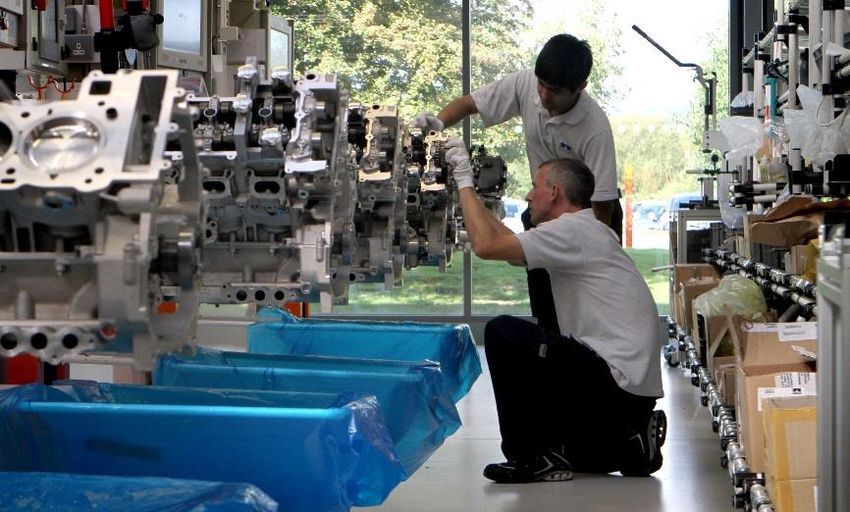
What challenge do we need to solve?
The transport challenge is a complex interaction between three competing themes:
Health, Wealth, and Environment for a sustainable solution these need balancing
The Transport Challenge
For a sustainable future transport
needs to balance:
• Not impacting the environment
• Not adversely affecting peoples
health
• Moving people and goods cheaply
to maintain healthy economies
© Ricardo plc 2020 Unclassified - Public Domain 6 July 2020 5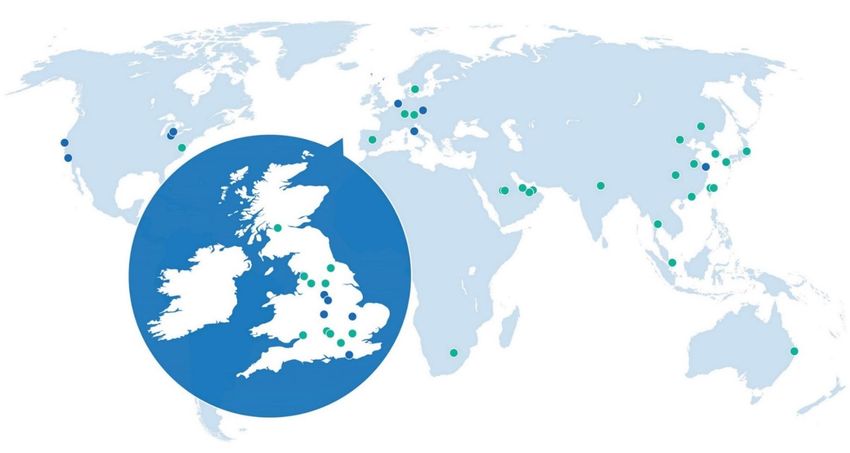
What is LCA?

Life Cycle Assessment (LCA) is about taking a holistic approach to the analysis of a
product’s environmental impact

      What is Life Cycle Assessment?
      •      All things have a life cycle of “birth”, “use / service” and “death” in
             which they impact on their environment
      •      Life Cycle Assessment (LCA) is a technique for quantifying the
             environmental and human health impacts of a product over its life                                                                                                    Material              Product
                                                                                                                                                                                 Extraction            Assembly
             cycle
             –      Other names include “life cycle analysis”, “life cycle approach”,
                    “cradle-to-grave analysis”, “ecobalance” or “environmental
                                                                                                                                                                         Recycling
                    footprinting”                                                                                                                                        / Disposal
                                                                                                                                                                                                           Logistics

      •      Life Cycle Thinking is a way of thinking that includes the
             economic, environmental and social consequences of a product or
                                                                                                                                                                                                 Use
             process over its entire life cycle

          Formal Definition of Life Cycle Assessment
          “It is a process to evaluate the environmental burdens associated with a product, process or activity by identifying and quantifying energy and materials used and
          wastes released to the environment. The assessment includes the entire life cycle of product, process or activity, encompassing extracting and processing raw
          materials, manufacturing, transport and distribution; use, re-use, maintenance; recycling, and final disposal”
                                                                                                                                                                    SETAC, 1991
      Source: See “Understanding the life cycle GHG emissions for different vehicle types and powertrain technologies”, Ricardo report for LowCVP, August 2018, for further explanation of LCA
© Ricardo plc 2020                                Unclassified - Public Domain                                                                                                                                6 July 2020   6
What is LCA?

A vehicle’s life cycle consists of four stages – vehicle production, fuel production,
use and end of life

     Vehicle Life Cycle

                     Well-to-Wheel (WTW) Analysis
                      on the production of fuels and
                                                                                                           The whole vehicle life cycle
                       electricity, and operational
                                                                                                          includes embedded emissions
                                emissions
                                                                     Fuel & Electricity                      from vehicle production,
                                                                       Production                         maintenance and servicing, and
                       Vehicle cycle “Embedded”                      Assessment of (Well-to-Tank)         end-of-life activities, and WTW
                      emissions result from vehicle              environmental impact of producing the     (WTT+TTW) emissions from
                                                                 energy vector(s) from primary energy
                     manufacturing, maintenance and               source, generation plants, through to
                                                                                                                fuels and electricity
                        end-of-life (EoL) disposal                          distribution point

                         Vehicle Production                            Use/Operation                                 End-of-Life
                         Assessment of ‘Cradle-to-Gate’            • Environmental impact of driving          Adds assessment of environmental
                       environmental impact of producing the          (Tank-to-Wheels emissions)              impact of “end of life” scenario (i.e.
                          vehicle, including extract of raw                                                -to-Grave). Can include: re-using or re-
                         materials, processing, component                                                     purposing components, recycling
                                                                    • Impact from maintenance and
                           manufacture, logistics, vehicle                                                 materials, energy recovery and disposal
                                                                                servicing
                              assembly and painting                                                                        to landfill

© Ricardo plc 2020                Unclassified - Public Domain                                                                                         6 July 2020   7
Why do we need to take a life cycle approach?

Life Cycle Assessment provides us with deeper understanding of the environmental
impacts of our technology decisions

      Estimation of GHG Emissions for European Medium Passenger Car

                                                   Vehicle Policy                                                        Energy Policy                                                           OEM Product LCA

                              70                                                                                                                                                     60.8
                              60                                                                        52.5
      GHG Emissions [tCO2e]

                              50        41.7
                              40                                                                                                                                                                              32.4
                                                                                                                                                                                                                                       27.1
                              30                                                                                                  21.3
                              20                                                                                                                           14.7
                                                        8.6
                              10                                                0.0
                               0
                              -10
                                    Gasoline ICE     Gasoline                 BEV               Gasoline ICE                 Gasoline                     BEV               Gasoline ICE                 Gasoline                      BEV
                                                      PHEV                                                                    PHEV                                                                        PHEV
                                                     Tailpipe                                                           Well-To-Wheel                                                            Vehicle Life Cycle
                                                                                                                                 2020

                                       Vehicle Use      Fuel / Electricity Production                       Vehicle Production                     Vehicle Maintenance                        Vehicle End-of-Live                      Total
      Source: Ricardo Vehicle LCA analysis (June 2020) for average EU lower-medium passenger car (C-segment): Assumes lifetime 225,000 km, real-world fuel consumption based on average EU28 use profile. GHG from fuel/electricity consumption is
                based on the average fuel/grid electricity factor over the life of the vehicle (Baseline scenario); Calculated 89.0 kgCO 2e/kWh battery in 2020, Includes EoL recycling credits; Analysis assumed PHEV has 11 kWh Li-ion battery pack, and
                BEV has 57 kWh Li-ion battery pack
© Ricardo plc 2020                                     Unclassified - Public Domain                                                                                                                                            6 July 2020                   8
Why do we need to take a life cycle approach?
And it’s not just about Global Warming and GHG Emissions – other impacts need to
be considered too
Estimation of other LCA Environmental Impacts for European Medium Passenger Car
Cumulative Energy Demand Acidification Potential Human Toxicity Potential
SO2
[GJ] [kg SO2eq] [mCTUh]
1000
70 851
300 10
61.4
Human Toxicity Potential [mCTUh]
[tCO2e] [GJ]
Acidification Potential [kgSO2eq]
60 250 52.5 8
800 6.3
Energy Demand
200 6.0
50 41.7 604 586 194 5.1
6
600 150
40 131 130 32.7
GHG Emissions
100 4 28.6
400
30 21.3
50 2
20 14.7
200 0
Cumulative
8.6
10 0
0.0 -50
0 -2
0 -100
-200 Gasoline ICE Gasoline
-10 BEV Gasoline ICE Gasoline
-150 BEV Gasoline
-4 ICE Gasoline BEV
PHEV
Gasoline Gasoline BEV Gasoline PHEV
Gasoline BEV PHEV
Gasoline Gasoline BEV
ICE PHEV
Tailpipe ICE Well-To-Wheel
PHEV ICE LifePHEV
Vehicle Cycle
Vehicle Life Cycle Vehicle
2020Life Cycle Vehicle Life Cycle
2020 2020 2020
Vehicle Use Fuel / Electricity Production Vehicle Production Vehicle Maintenance Vehicle End-of-Live Total
Source: Ricardo Vehicle LCA analysis (June 2020) for average EU lower-medium passenger car (C-segment): Assumes lifetime 225,000 km, real-world fuel consumption based on average EU28 use profile. GHG from fuel/electricity consumption is
based on the average fuel/grid electricity factor over the life of the vehicle (Baseline scenario); Calculated 89.0 kgCO2e/kWh battery in 2020, Includes EoL recycling credits; Analysis assumed PHEV has 11 kWh Li-ion battery pack, and
BEV has 57 kWh Li-ion battery pack
© Ricardo plc 2020 Unclassified - Public Domain 6 July 2020 9
Closer look at Vehicle Production

Considering vehicle production: the technology evolution to plug-in vehicles has
lead to higher embedded CO2e emissions due to the addition of new components

      Estimation of GHG Emissions for European Medium Passenger Car – Vehicle Production

                                         Gasoline ICE                                                             Gasoline PHEV                                                               Gasoline BEV

                                            8.9 tCO2e                                                                 11.3 tCO2e                                                                 13.9 tCO2e
                                        1%                                                                                         2%                                                                            2%

                                             7%
                                                                                                                  16%
                                  15%
                                                                                                           4%
                                                                                                                                                                                      40%
                                                                                                           3%
                                                                                                                                                                                                                          52%
                                                                                                           10%
                                                                                                                                             65%
                                                             77%
                                                                                                                                                                                                  4%

                                                                                                                                                                                                  2%

                             Vehicle Glider                     Engine & Exhaust                   Electric Motor                      Transmission                       Energy Storage                      Power Electronics

      Source: Ricardo Vehicle LCA analysis (June 2020) for average EU lower-medium passenger car (C-segment): Assumes lifetime 225,000 km, real-world fuel consumption based on average EU28 use profile. GHG from fuel/electricity consumption is
                based on the average fuel/grid electricity factor over the life of the vehicle (Baseline scenario); Calculated 89.0 kgCO 2e/kWh battery in 2020, Includes EoL recycling credits; Analysis assumed PHEV has 11 kWh Li-ion battery pack, and
                BEV has 57 kWh Li-ion battery pack
© Ricardo plc 2020                                     Unclassified - Public Domain                                                                                                                                            6 July 2020                   10
Case Example
Ricardo is also adopting a life cycle philosophy in our Performance Products
division – initial results have been surprising
RICARDO
Ricardo – Cradle-to-Gate LCA Study of High Performance Engines CASE EXAMPLE
• Ricardo Performance Products assemble high performance engines
at our Shoreham Technical Centre
• In 2017, we performed a cradle-to-gate life cycle assessment of a
high performance engine, using primary data collected directly from
our assembly facility, and EcoChain’s online LCA modelling tool
• For such a complex product, the calculations were surprisingly
simple
• The results were intriguing – only 3.5% of total embedded carbon
footprint for one engine arises from Ricardo’s assembly Embedded CO2e
contribution from Ricardo
engine assembly
Rather than focusing on further significant
improvements in our own energy efficiency,
Ricardo PP are engaging with our supply chain to
help them reduce their impacts
Source: Ricardo “cradle-to-gate” LCA analysis of high performance engine using EcoChain
© Ricardo plc 2020 Unclassified - Public Domain 6 July 2020 11Vehicle Production vs. In-Use GHG Emissions Trade-off
So, if GHG emissions for producing a BEV or PHEV are higher than for gasoline ICE,
how far to you have to travel to payback the GHG emissions?
Estimation of GHG Emissions for European Medium Passenger Car – Vehicle Production
50
Cumulative CO2e [tonnes]
45
40
35 Carbon payback for
30 BEV ~30,000 km >11 tCO2e saved
after 100,000 km
25 Carbon payback for
PHEVTo conclude, we need to adopting a life cycle philosophy to meet the challenges of
sustainable transport
Conclusions
• A truly sustainable solution for future transport needs to
balance three competing themes: Health, Wealth, and
Environment
• A life cycle approach enables holistic analysis of the health,
wealth and environmental impacts of powertrain technology
and fuels
• OEMs and their supply chains will need to work together
• This changes the mobility discussion – making sure
environmental burdens are not shifted to other parts of the
vehicle life cycle
We need to adopt a life cycle philosophy to
successfully engineer net zero transport
© Ricardo plc 2020 Unclassified - Public Domain 6 July 2020 13Thank-you for listening
Acknowledgements
For further information on Ricardo LCA
“Pilot study on determining the environmental impacts of conventional and activities, please contact:
alternatively fuelled vehicles through Life Cycle Assessment”
Jane Patterson
Technology Strategy
Ricardo Strategic Consulting
jane.patterson@ricardo.com
A project led by Ricardo Energy & Environment, with its partners ifeu and E4Tech
The study covers road transport vehicles of different types / powertrains, and fuel Nikolas Hill
and electricity production chains looking out to 2050. The work includes a review Associate Director, Knowledge
the literature, development and implementation of a methodology generate results Leader in Transport Technology and
to inform understanding for the Commission in a policy context. A range of Fuels
stakeholder consultation and data gathering activities have been completed, Ricardo Energy & Environment
nikolas.hill@ricardo.com
including a survey (and workshop) with LCA experts/stakeholders. Results were
presented in a Final Workshop in January 2020.
Simon Gandy
For further information, please contact us via the project email address: Associate Director, Knowledge
VehicleLCA@ricardo.com Leader in Life Cycle Assessment
Ricardo Energy & Environment
simon.gandy@ricardo.com
© Ricardo plc 2020 Unclassified - Public Domain 6 July 2020 14UNDERSTANDING VEHICLE
EMISSIONS ACROSS THE
WHOLE LIFE CYCLE
Dr Stuart ColesPhases Manufacturing Usage Recycling
Manufacturing
 Manufacturing a battery has more CO2 emissions
 associated with it than a comparable ICE
 When considering the whole vehicle, literature
 reports increases of around 33% - 100%
 Absolute values will change depending on model,
 location etc. – but trend is clear
Usage
 Zero emission at point of use
   Driven by legislation to reduce exhaust emissions
 Electricity generation has related carbon
 emissions
 Comparison with ICE using UK grid mix is
 favourable
CO2 emissions across manufacturing and use phases
                      40

                      35
                                         BEV
                      30
                                         ICE
 Emissions / t CO2e

                      25
                                                             EVs better on an LCA basis
                      20                                      than ICE except for very
                                                                low mileage vehicles
                      15

                      10

                       5

                       0
                           0   15   30           45          60          75           90       105   120   135   150
                                                               Distance / x 1000 miles

Mid-range passenger car, manufacturing values calculated using GREET 2019 and Warwick data.
Emissions based on 2019 UK grid average (BEV) and 120 g CO2e / km (ICV)
Projected CO2 emissions (2030) across manufacturing and use phase
40
35
BEV
30
ICE
Emissions / t CO2e
25
20
Reduction in UK grid
15 intensity will also affect
manufacturing emissions
10
5
0
0 15 30 45 60 75 90 105 120 135 150
Distance / x 1000 miles
Mid-range passenger car, manufacturing values calculated using GREET 2019 and Warwick data.
Emissions based on projected 2030 UK grid average (BEV) and 120 g CO2e / km (ICV)End of life Batteries are difficult to disassemble Energy, emission & cost inefficient Lack of industrially-relevant data
Projected CO2 emissions (2030) across manufacturing and use phase
                      40

                      35
                                              BEV
                      30
                                                                                     Recycling likely to have a
                                              ICE                                   greater impact on BEV life
 Emissions / t CO2e

                      25
                                                                                         cycle emissions
                      20
                                    Although more recycled
                      15              material will reduce
                                    manufacturing impacts
                      10

                       5

                       0
                           0   15        30         45          60          75           90        105        120   135   150
                                                                  Distance / x 1000 miles

Mid-range passenger car, manufacturing values calculated using GREET 2019 and Warwick data.
Emissions based on projected 2030 UK grid average (BEV) and 120 g CO2e / km (ICV)
Materials
Bigger long-term consideration
is materials supply
Particularly cobalt, neodymium
and other critical raw materials
Needs legislation to drive
Current target of 50% recycling
by mass doesn’t include any
specific materials
Assessment of potential bottlenecks along the materials supply chain for the future deployment of low-carbon energy and transport
technologies in the EU, EU JRC, 2016Summary
Larger proportion of environmental impact is associated with
manufacturing of EV battery (vs. ICE)
Improves with increasing energy density and charging infrastructure
EV is better than ICE for anything other than a very low mileage vehicle
Reductions in grid carbon intensity strengthens this case from both manufacturing
and usage phase perspectives
Need to consider the materials impact
Particularly cobalt and neodymium; recycling important but cost and carbon
inefficient
Need battery recycling directive to be more challenging than 50% by massReferences
Assessment of potential bottlenecks along the materials supply chain for the future deployment
of low-carbon energy and transport technologies in the EU, EU JRC, 2016
GREET v1.3.0.13520, 2019, http://greet.es.anl.gov
Q. Qiao, F. Zhao, Z. Liu, S. Jiang, H. Hao
Cradle-to-gate greenhouse gas emissions of battery electric and internal combustion engine
vehicles in China
Appl Energy, 2017, 204, 1399–411
L.A. Ellingsen, G. Majeau-bettez G, B. Singh, A.K. Srivastava, L.O. Valøen, A.H. Strømman
Life Cycle Assessment of a Lithium-Ion Battery Vehicle Pack
J. Ind. Ecol., 2014, 18(1), 113–24
T.R. Hawkins, B. Singh, G. Majeau-bettez, A.H. Strømman
Comparative Environmental Life Cycle Assessment of Conventional and Electric Vehicles
J. Ind. Ecol., 2013, 17(1), 53–64
J. Wellings, M. Ozoemena, M. Dowson, D. Greenwood, S.R. Coles
Whole Life Cycle Analyis of Electric Vehicles
Unpublished Data, 2020
E: stuart.coles@warwick.ac.ukReducing the carbon intensity of metal
alloys used in vehicle production
Claire DavisIssues to be considered
• Energy and carbon costs for steel and aluminium production
• Energy and carbon costs for transportation from producer to fabricator
• Production of improved alloys for light-weighting options
• Recycling
• Design for assembly, disassembly, reuse and remanufacture
©2017Energy and carbon costs for steel and aluminium production
Steel and aluminium are the most commonly used materials for modern
vehicles. Primary production of aluminium and steel is very energy
intensive but efficient.
In the UK the integrated blast furnace-based process route is the main method used
(required for car body steels) and produces about 1.8 t of CO2 for each tonne of steel with
an energy consumption of 24 GJ/tonne. The electric arc furnace scrap melting based
route requires only half to two thirds of this energy with a correspondingly lower CO2
footprint (650 kg CO2 per tonne of steel).
Primary production of aluminium produces between approx. 5 – 40 t of CO2 per tonne of
aluminium (depending on processing route) whilst the US Department of Energy reports
that secondary aluminium production requires 90% less energy than primary production.
Environmental Carbon Footprints Industrial Case Studies 2018, Pages 197-228
https://www.eia.gov/todayinenergy/detail.php?id=16211
©2017Energy and carbon costs for steel and aluminium production New technologies are being considered to reduce energy and carbon costs for production. Examples include: • New steel production processes – HYBRIT which uses hydrogen rather than coke and could reduce emissions to 25 kg CO2 per tonne of steel. Pilot plant facility being built in Sweden (https://www.hybritdevelopment.com/). • Net shape production: belt casting technology that can reduce energy costs by up to 50%. Alcoa Micromill started production for aluminium alloys in 2016. For steel twin roll casting is used and limited belt casting (Salzgitter Steel) ©2017
Energy and carbon costs for transportation from producer to fabricator

    Transportation of steel or aluminium during production and from producer
    to consumer also incurs carbon cost.

    Example case study (for plate steels):
    Carbon cost for transport of overseas produced slab to UK rolling facility is 0.54 t CO2 per
    tonne steel compared to 0.20 t CO2 per tonne steel for UK production of slab transported
    internally to rolling facility. Ref. CarbonTrust report to WMG 2020

    Currently no UK production of primary aluminium. Not all automotive grades of steel are
    produced in the UK, therefore transportation CO2 costs are inevitable.

    Full energy and CO2 considerations need to consider local compared to global
    production and transportation costs.
©2017
Production of improved alloys for light-weighting options Aluminium industry and steel industry are continuing to develop improved alloys with higher strength / elongation values to allow light weighting of structures. New development of Advanced High Strength Steels (AHSS) New development of Al alloy sheet for body structures ©2017
Production of improved alloys for light-weighting options

    Specific properties allow choice between material types.

 ©2017
from  https://aluminiuminsider.com/aluminium-alloys-automotive-industry-handy-guide/ 2020
Production of improved alloys for light-weighting options
Dissimilar joining is often required
when selecting ‘right’ material for a
different parts in overall vehicle. This
allows better design for light-
weighting and hence efficiencies.
New / modified joining approaches
are often required:
https://www.carbodydesign.com/2013/02/honda-develops-new-
©2017technology-to-join-steel-and-aluminum/Production of improved alloys for light-weighting options
Dissimilar joining is often required
when selecting ‘right’ material for a
different parts in overall vehicle. This
allows better design for light-
weighting and hence efficiencies.
New / modified joining approaches
are often required.
Care is required to avoid issues, such
as intermetallics causing joint failure
when laser welding steel to
aluminium.
©2017Recycling To take advantage of the lower energy and CO2 of secondary metal processing it is important to consider the current and future needs for recycling. The UK is a net exporter of ferrous scrap, with over 9.3 Mt of ferrous scrap being exported in 2017. Annual scrap consumption in the UK currently stands at around 1 Mt of internally UK generated scrap and 1.4 Mt of imported scrap. End of use vehicles comprise 20% of scrap arising. Challenges in the UK for more scrap use is related to current plant infrastructure and investment, energy costs, policy and market demand. An additional challenge for greater scrap use is on the build up of deleterious residual elements (e.g. Cu, Sn) affecting the quality of steel that can be produced. This requires improved sorting of scrap material and more closed loop recycling. ©2017
Recycling

 Current recycling technology and limits on residual content defines opportunities
 for increasing scrap use:
                                                  0.35                                                                         BOF/EAF
                  Copper content in steel (wt%)

                                                   0.3
                                                  0.25
                                                   0.2
                                                                                                                               Example
                                                  0.15                                                                         max.
                                                   0.1                                                                         content
                                                  0.05
                                                    0
                                                         0           2           4            6            8              10             12
                                                                                         Cycle Number

                                                         90/10   80/20   70/30   60/40    50/50    40/60       30/70   20/80   10/90

 Cyclical aggregation of copper due to a theoretical consideration of closed border scrap recycling for BOF and EAF steel
 production utilising a weighted average of high residual scrap in the BOF at 20% scrap loading and a weighted average of low
 residual scrap in the EAF at 100% scrap loading.
©2017
 (ref: S. Spooner, C. Davis and Z. Li, “Modelling the Cumulative Effect of Scrap Usage within A circular UK Steel Industry – Residual Element Aggregation”
Recycling Aluminium in the automotive industry typically falls into two categories (cast and wrought) that use different alloying elements. Important to sort between categories to improve recycling. New technologies, such as laser induced breakdown spectroscopy (LIBS), is being used for compositional analysis for sorting. Closed loop recycling from fabricators is an important element for improved quality control: For example “Novelis has recently started supplying Jaguar Land Rover with RC5754. This alloy has increased allowances for iron, copper and silicon, allowing the company to make it from 50% production scrap returned from pressing plants. Aleris, for example, incorporates 71 % recycled content in its transportation 3004 alloy, mostly used in truck trailer sheet, horse trailers and irrigation pipes.” from https://aluminiuminsider.com/aluminium-alloys-automotive-industry-handy-guide/ 2020 ©2017
Design for assembly, disassembly, reuse and remanufacture

   Considerations of disassembly and reuse of materials in products in increasing
   allowing use of lower energy / CO2 embodied materials. Full LCA required to
   consider benefits for a given scenario.

   Taken from Sirje Vares, Petr Hradil, Michael Sansom & Viorel Ungureanu (2019): Economic potential and environmental impacts of reused steel
   structures, Structure and Infrastructure Engineering
©2017
Design for assembly, disassembly, reuse and remanufacture

  Case studies are being developed in different sectors for economic and technical
  opportunities for disassembly, reuse and remanufacture. Vehicle design should
  therefore take into account assembly, disassembly, reuse and remanufacture.

   Taken from “Dismantling, remanufacturing and recovering heavy vehicles in a circular economy—Technico-economic and organisational lessons learnt
   from an industrial pilot study” by Michael Saidani, Bernard Yannou, Yann Leroy, François Cluzel in Resources, Conservation & Recycling 156 (2020) 104684
©2017
Issues considered

        •   Energy and carbon costs for steel and aluminium production
        •   Energy and carbon costs for transportation from producer to fabricator
        •   Production of improved alloys for light-weighting options
        •   Recycling
        •   Design for assembly, disassembly, reuse and remanufacture

        In summary: there are opportunities for lower energy / CO2 contribution to full
        life vehicle assessment from the materials (steel and aluminium) used.
        Examples include closed loop recycling, light-weighting via improved materials
        and design for reuse / remanufacture.

©2017
You can also read