Model Year 2010 (Gen 3) Toyota Prius Level-1 Testing Report - Energy Systems Division
←
→
Page content transcription
If your browser does not render page correctly, please read the page content below
ANL/ES/RP-67317

Model Year 2010 (Gen 3) Toyota Prius
Level-1 Testing Report

Energy Systems Division
About Argonne National Laboratory
Argonne is a U.S. Department of Energy laboratory managed by UChicago Argonne,
LLC under contract DE-AC02-06CH11357. The Laboratory’s main facility is outside
Chicago, at 9700 South Cass Avenue, Argonne, Illinois 60439. For information about
Argonne, see www.anl.gov.

Availability of This Report
This report is available, at no cost, at http://www.osti.gov/bridge. It is also available on
paper to the U.S. Department of Energy and its contractors, for a processing fee, from:
       U.S. Department of Energy
       Office of Scientific and Technical Information
       P.O. Box 62
       Oak Ridge, TN 37831-0062
       phone (865) 576-8401
       fax (865) 576-5728
       reports@adonis.osti.gov

Disclaimer
This report was prepared as an account of work sponsored by an agency of the United States Government. Neither
the United States Government nor any agency thereof, nor UChicago Argonne, LLC, nor any of their employees or
officers, makes any warranty, express or implied, or assumes any legal liability or responsibility for the accuracy,
completeness, or usefulness of any information, apparatus, product, or process disclosed, or represents that its use
would not infringe privately owned rights. Reference herein to any specific commercial product, process, or service
by trade name, trademark, manufacturer, or otherwise, does not necessarily constitute or imply its endorsement,
recommendation, or favoring by the United States Government or any agency thereof. The views and opinions of
document authors expressed herein do not necessarily state or reflect those of the United States Government or any
agency thereof, Argonne National Laboratory, or UChicago Argonne, LLC.
ANL/ES/RP-67317

Model Year 2010 (Gen 3) Toyota Prius
       Level 1 Testing Report

                     9/7/2010

                     Authors:
                    Eric Rask
                  Michael Duoba
               Henning Lohse-Busch
                   Daniel Bocci

            Argonne National Laboratory
             9700 South Cass Avenue
              Argonne ,IL 60439-4815
                       USA
1 Abstract
As a part of the US Department of Energy’s Advanced Vehicle Testing Activity (AVTA),
a model year 2010 Toyota Prius (Generation 3) was procured by eTec (Phoenix, AZ)
and sent to ANL’S Advanced Powertrain Research Facility for the purposes of “Level 1”
testing in support of the Advanced Vehicle Testing Activity (AVTA). Data was acquired
during testing using non-intrusive sensors, vehicle network connection, and facilities
equipment (emissions and dynamometer data). Standard drive cycles, performance
cycles, steady-state cycles and A/C usage cycles were conducted. Much of this data is
openly available for download in ANL’s Downloadable Dynamometer Database (D3).
The major results are shown here in this report.

Given the preliminary nature of this assessment, the majority of the testing was done
over standard regulatory cycles and seeks to obtain a general overview of how the
vehicle performs. These cycles include the US FTP cycle (Urban) and Highway Fuel
Economy Test cycle as well as the US06, a more aggressive supplemental regulatory
cycle. Data collection for this testing was kept at a fairly high level and includes
emissions and fuel measurements from the exhaust emissions bench, high-voltage and
accessory current and voltage from a DC power analyzer, and minimal CAN bus data
such as engine speed and pedal position. The following sections will seek to explain
some of the basic operating characteristics of the MY2010 Prius over standard
regulatory cycles.

2 Vehicle Description
The MY2010 Toyota Prius represents the most recent iteration of Toyota’s hybrid
system which began wide-scale production in 1997. As with the majority of Toyota
hybrid systems, this version includes an Atkinson-cycle engine, two electric machines
and a power-split device used to control the allocation of energy between the electric
and mechanical (fuel) power paths. As with most hybrid systems, fuel economy and
emission gains are enabled through regenerative braking, engine-off at idle, electric
operation at low road loads, electric assist, and the general ability to operate the engine
more optimally. In addition to the broad goal of generally improved fuel economy, the
MY2010 Prius also specifically seeks to improve the vehicle’s real-world fuel economy,
namely, hot and cold weather operation as well as improving high-speed operation with
minimal compromise to urban driving.

To accomplish these objectives, the majority of the Prius’ hybrid components have been
redesigned or updated. Engine displacement has increased to 1.8L versus the previous
1.4L in order to increase efficiency at higher vehicle speeds. In order to maintain low-
speed vehicle efficiency, an Exhaust Gas Recirculation (EGR) system was included.
Additional engine related improvements include an electric water pump and an exhaust
heat recirculation system. The recirculation system allows for exhaust heat (loss)
leaving the engine to be absorbed into the engine coolant when desired. The hybrid
transmission and electric machines were also redesigned to facilitate an overall
transmission length and mass reduction. More specifically, gearing was included
between the motor/planetary gear set and compound gearing was also included. The
motor/planetary gearing is to allow for reduced motor torque while still providing high
power through increased motor speed (~ 13000 rpm maximum versus previous ~9000
rpm maximum speed). The compound gearing integrates several functions such as a
parking gear and counter drive into a more compact package. In addition to these
mechanical components, the power electronics and battery packaging have also been
redesigned to facilitate mass and volume reductions. Overall, much attention has been
paid towards reducing the mass and volume of the newly developed system while
continuing to improve fuel economy.

The following are Generation 3 Prius vehicle specifications according to Toyota Motor
Corporation (http://www.toyota.com/prius-hybrid/specs.html).

Gasoline Engine
Type: Aluminum double overhead cam (DOHC) 16-valve VVT-i 4-cylinder
Displacement: 1.8 liters (1798 cc)
Bore x stroke: 3.17 in. x 3.48 in.
Compression ratio: 13.0:1
Valvetrain: Four valves per cylinder with Variable Valve Timing with intelligence (VVT-i)
Induction system: Sequential multi-point EFI with Electronic Throttle Control System
with intelligence (ETCS-i)
Ignition system: Electronic, with Toyota Direct Ignition (TDI)
Power output: 98 hp @ 5200 rpm (73 kW @ 5200 rpm)
Torque: 105 lb.-ft. @ 4000 rpm (142 N•m @ 4000 rpm)
Emission rating: Advanced Technology Partial Zero Emission Vehicle (AT-PZEV)

Electric Motor
Motor type: Permanent magnet AC synchronous motor
Power output: 80 hp (60 kW)
Torque: 153 lb.-ft. (207 N•m)
Voltage: 650V maximum

Traction Battery
Type: Sealed Nickel-Metal Hydride (Ni-MH)
Power Output: 36 hp (27 kW)
Voltage: 201.6V

Hybrid System Net Power
134 hp (100 kW)
Mechanical/Performance
Transmission: Electronically controlled continuously variable transmission (ECVT)
      - EV mode
      - Eco and Power modes

Front Suspension: Independent MacPherson strut with stabilizer bar
Rear Suspension: Torsion beam
Steering: Electric Power Steering (EPS); rack-and-pinion with electric power-assist

Vehicle
Overall height/width/length (in): 58.7/68.7/175.6
Wheelbase(in): 106.3
Track (front/rear, in): 60.0/59.8
Curb weight (lb.): 3042
Seating capacity: 5
Passenger volume (cu. ft.): 93.7
Luggage capacity (cu. ft.): 21.6
Fuel tank (gal.): 11.9

Mileage estimates
MY 2010 Prius (Gen. 3)
MPG city: 51
MPG highway: 48
MPG combined: 50

Previous generation vehicle: MY 2004 Prius (Gen. 2)
MPG city: 48
MPG highway: 45
MPG combined: 46

3 Vehicle Instrumentation
3.1 Data Acquisition System
Argonne’s chassis dynamometer facility was specifically designed to perform research-
oriented testing. Because of this objective, a custom data acquisition and control
system was built around the needs for hybrid vehicle testing. The custom design also
allows integration with new measurement systems as different vehicles are tested in the
lab. All data is collected from the various sources, time-aligned and merged by the Host
Computer and saved along with other test information in a 10Hz data file.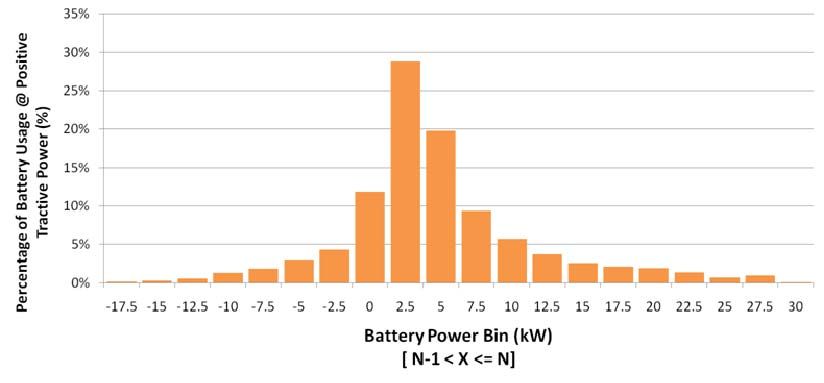
3.2 Vehicle Signals
             Facility Data                                        Comment
                        Drive Schedule [MPH]
                        Bag Number [n]
                        Vehicle Speed [MPH]
                        Dyno_TractiveForce_Front [N]
                        Dyno Front Load Cell [N]
                        DilAir RH [%]
                        Tailpipe Pressure [in H2O]
                        Cell Temp [C]
                        Cell RH [%]
                        Cell Press [inHg]
                        Tire_Temp [C]
             Vehicle Network Data
                        Accel_Pedal_Position_CAN [%]
                        Veh_Spd_CAN [mph]
                        Powetrain_Torque_CAN
                        Eng_Spd_CAN [rpm]
                        Brake_Pedal_Force_CAN
                        Brake_Pedal_Switch_CAN
                        A/C_on_off_CAN
                        Eng_Temp_CAN
                        Batt_SOC_CAN                   scaling found after testing
                        Batt_Current_CAN [A]
             Installed Sensors
                        Eng_Temp_Oil_Dipstick[C]
                        Cabin_Vent_Temp[C]
                        Eng_Spd[rpm]
                        Dyno Spd Front copy [MPH]
             Hioki Analog
                        Batt_Curr_Hioki‐I1 [A]         Ch1 = HV Battery
                        Batt_V_Hioki‐U1 [V]            Ch1 = HV Battery
                        12VBatt_Curr_Hioki‐I5 [A]      Ch2 = 12V Battery
                        12VBatt_Volt_Hioki‐U5 [V]      Ch2 = 12V Battery
             Hioki Serial
                        U1                             HV voltage
                        I1                             HV current
                        P1                             HV power
                        IH1                            HV Ah
                        WP1                            HV Wh
                        U5                             12V voltage
                        I5                             12V current
                        P5                             12V power
                        IH5                            12V Ah
                        WP5                            12V Wh
             Emissions Bench
                        THC [mg/s]
                        CH4 [mg/s]
                        NOx [mg/s]
                        COlow [mg/s]
                        COmid [mg/s]
                        CO2 [mg/s]
                        HFID [mg/s]
                        NMHC [mg/s]
                        Fuel [g/s]
4 Urban Cycle Operation
This section discusses vehicle performance over the Urban driving schedule. This
schedule is meant to replicate typical stop-and-go city driving. Testing for this cycle is
comprised of two repeated runs with a 10 minute soak period between repeats. The
first run is referred to as “cold” due to the vehicle having no warm-up operation prior to
running. The second repeat run is referred to as “warm” given the fact that the vehicle
has run the cold cycle prior to running the next cycle. In addition to the overall
performance over the Urban drive schedules, the difference between “hot” and “cold”
operation is also of interest. Table 1 below shows the dynamometer tested fuel
economy over both “warm” and “cold” cycles.

Table 1: Urban Fuel Economy
                                    Urban Cold   Urban Warm
Unadjusted Fuel Economy (mpg)           63           70

In addition to the high fuel economy values, it is worth noting that the difference
between the cold and warm urban is roughly 10%. This result is smaller than previous
generation hybrid vehicles which typically have a difference of roughly 15%. While the
urban cold and warm cycles are run with a fairly warm ambient temperature (~75F), the
moderate differences between Urban cold and warm operation are illustrative towards
understanding one of the main missions of this vehicle, namely, improved cold
temperature (much colder than regulated) fuel economy.

4.1 Engine Operation
This reduced difference between warm and cold operation is mainly due to the Prius
utilizing a similar amount of engine-off operation between the warm and cold cycles.
While there is more engine-off operation for the warm cycle, the difference between the
two is smaller compared to previous vehicles. Table 2 shows the fraction of engine off
time for the warm and cold cycles.

Table 2: Urban Cycle Engine Off
                                    Urban Cold   Urban Warm
Engine-off Fraction of Total Time      0.63          0.66

The warm and cold cycles are also differentiated in terms of engine operating speed.
The warm cycle appears to run the majority of engine-on operation at a slightly lower
speed as compared to cold operation. Additionally, the warm operation appears to run
at higher engine speeds slightly more frequently. The majority of the additional higher-
speed engine operation observed during the warm Urban cycle occurs during the time
of the cold cycle’s vehicle warm-up period. This higher speed is sensible given the
need to reduce engine usage, especially at higher speeds, as the vehicle warms up.
Figure 1 shows the engine speed histogram over the cold and warm cycles for all non-
zero engine operation.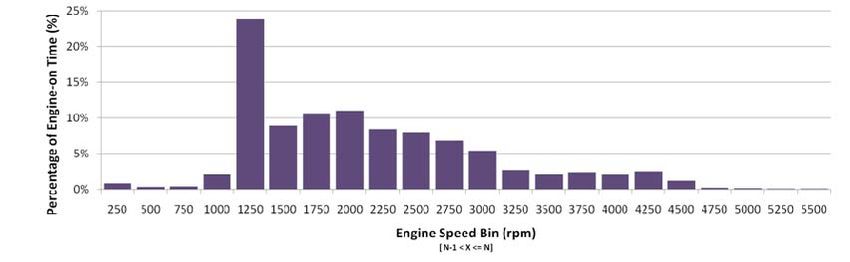
Figure 1: Urban Cycle Engine Speed Histogram

The following figures show more detailed information regarding the engine usage for the
different cycles. As can be seen in Figures 2 and 3, following the first roughly 200
seconds, the vehicle operates the engine very similarly in terms of engine speed and
fueling. During the first 200 seconds, or what may likely be considered vehicle warm-up
operation, the cold operation is much different compared to the warm operation.
Additionally, the first 50 seconds of engine operation appears to use a prescribed
fueling rate which is most likely used for catalyst warm-up and cold engine start
emissions abatement.

                           Figure 2: Urban Cycle Engine Speed

                             Figure 3: Urban Cycle Fuel Rate

Despite the initial operating differences to accommodate vehicle warm-up, the warm
and cold operation following this initial 200 seconds is fairly similar which helps explain
the reduced difference between warm and cold cycle fuel economy relative to the
previous generation vehicle. This fuel economy difference is summarized in Figure 4.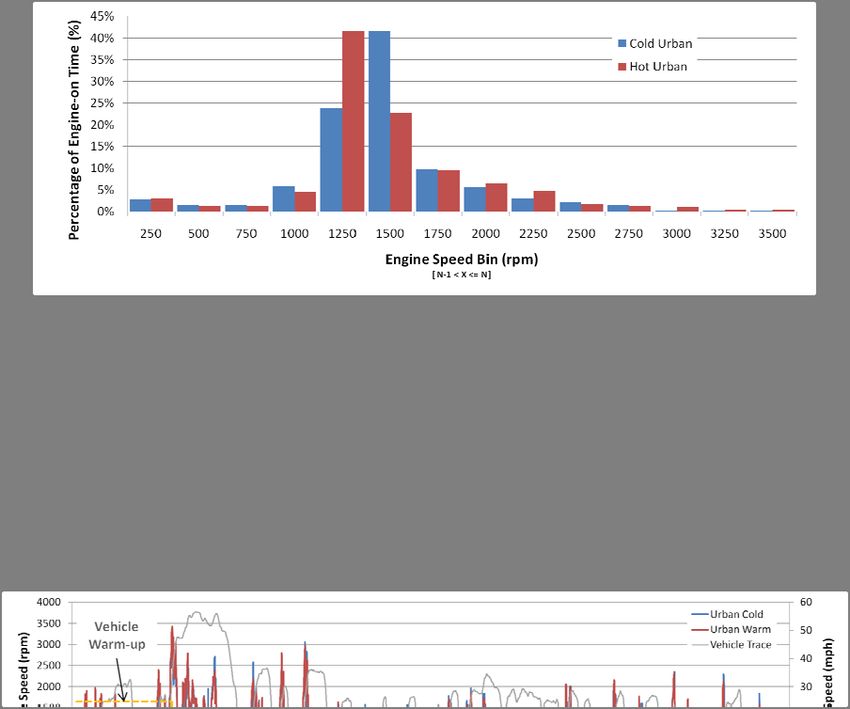
Figure 4: Urban Cold Penalty MY 2010 vs MY 2004 Prius
4.2 High Voltage Battery Usage
As with the engine usage, the battery usage is also fairly similar between the warm and
cold cycles aside from the first 200 seconds. As can be seen below in Table 3, the
peak positive battery power (from battery to powertrain) is slightly higher during the cold
cycle, while peak regenerative power (from powertrain to battery) is very similar.
Table 3: Urban Cycle Battery Peak Power
Urban Cold Urban Warm
Peak Positive Battery Power (kW) 24.2 22.2
Peak Regen Battery Power (kW) -24.7 -24.2
The detailed battery usage plot in Figure 5 shows the higher peak battery power during
the cold cycle occurs during the prescribed catalyst warm-up period (first 50 seconds)
and is used to supplement the lower engine power due to reduced engine fueling.
Following this initial period, the battery usage between the two cycles is fairly similar.
Figure 5: Urban Cycle Battery Power
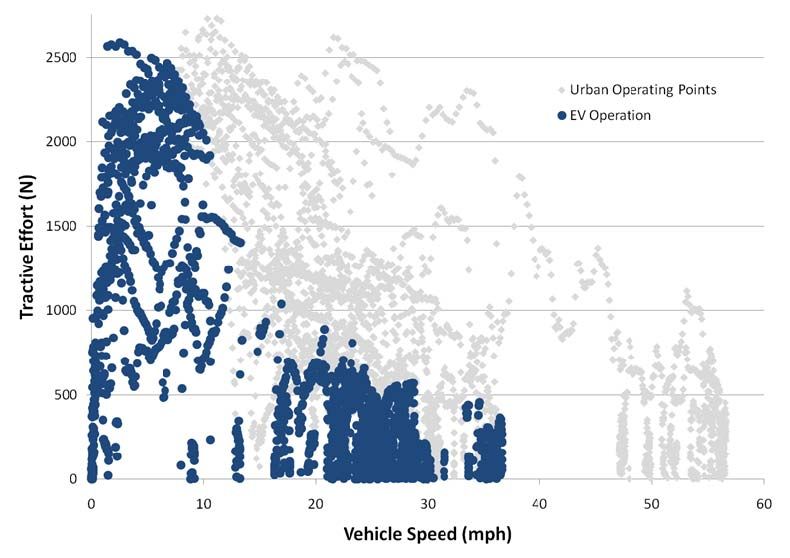
In addition to measuring battery power, current measurements were also taken. Figure
6 shows the integrated current versus time for the warm and cold cycles. As would be
expected, the additional battery usage during catalyst warm-up is the main point of
deviation between the warm and cold cycles. Assuming a quoted pack capacity of 6.5A-hr, the peak-to-peak state of charge swing during Urban operation may be estimated
to be roughly 10% on an Amp-hr basis.
Catalyst
Warm‐up
Figure 6: Urban Cycle Integrated Amp-Hours
4.3 Oil Temperature
Given the reduced cold penalty of the current generation vehicle over the Urban cycles,
engine oil temperature is also of particular interest. Figure 7 shows the engine oil
temperature measured at the dipstick for the cold and warm operation. Additionally,
Figure 8 shows the oil temperature over an extended series of four back-to-back Urban
cycles. As would be expected given the vehicle goal of improving cold performance, the
oil temperature rises quickly and then remains fairly constant.
Figure 7: Urban Engine Oil Temperature (Cycles 1 and 2)
Figure 8: Engine Oil Temperature Over Repeated Cycles4.4 Urban Operating Strategy Discussion
Although it can be inferred from the previous engine fueling and speed figures, Figure 9
shows a simplified version of the basic engine on/off strategy of the Prius over the warm
urban cycle. Vehicle speed is plotted and coded relative to engine on/off operation:
orange represents engine-on operation and grey represents engine-off operation.
Figure 9: Warm Urban Engine On/Off Strategy Summary
To better illustrate the general electric-only operating envelop of the Prius, Figure 10
shows the vehicle’s EV operation relative to the Urban cycle.
Figure 10: Urban Cycle EV Usage
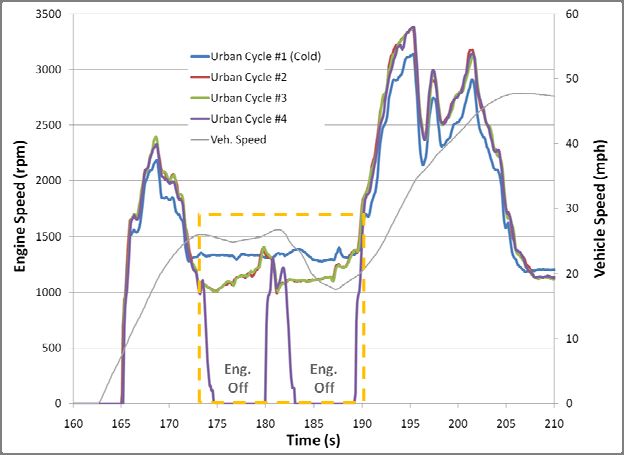
An additional point of interest resulting from the back-to-back urban cycles is that the
engine on/off behavior continues to change most likely due to continued vehicle warm-
up. More specifically, the fourth repeated cycle turns the engine off during the light
deceleration that occurs between 175 and 190 seconds of the Urban cycle. Given
nearly identical pedal inputs during this segment, it is hypothesized that this behavior isdue to continued vehicle warm-up beyond a certain threshold. Figure 11 shows a
magnified view of this section of the Urban cycle and Figure 12 shows the engine oil
temperature, which can be seen to be warmer for the 4th cycle during the period of
interest. While this effect may not be entirely related to oil temperature, it serves as a
fairly representative number for the thermal state of the entire system.
Figure 11: Urban Engine Off Variability with Repeated Cycles
Figure 12: Continued Engine Oil Warm-up5 Highway Cycle Operation
This section discusses operation over the Highway cycle. As its name implies, this
cycle is used to evaluate higher-speed, fairly steady driving. In contrast to the Urban
cycle, only the warm results for this cycle are currently evaluated for regulatory
purposes. Recalling the initial section on powertrain system updates versus previous
generations, the engine displacement for this vehicle has been increased to 1.8L to
improve efficiency for this type of driving. Table 4 shows the tested fuel economy for
this cycle.
Table 4: Highway Cycle Fuel Economy
Hwy Cycle
Unadjusted Fuel Economy (mpg) 67
5.1 Engine Operation
As mentioned previously, the larger engine displacement in this version of the Prius
system is to facilitate lower engine speeds during high speed operation. Figure 13
demonstrates this behavior and shows the current and previous generation engine
speed histograms over the Highway cycle. As would be expected at elevated vehicle
speeds, engine-off operation is fairly limited and represents roughly 7% of the total
operating time.
Figure 13: Highway Engine Speed 2010 vs 2004 Prius
More detailed information is available in the engine speed and fueling plots of Figures
14 and 15 respectively. It is notable that even during the higher speed Highway cycle,
the vehicle displays some engine-off (RPM=0) operation. This higher speed engine-off
operation is primarily limited to deceleration and is used to improve regenerative braking
energy capture.Figure 14: Highway Cycle Engine Speed
Figure 15: Highway Cycle Fuel Rate
To summarize the basic engine operation strategy, Figure 16 provides engine on/off
state coded on to the vehicle speed trace. Note: some of the engine-off operation
during temporary decelerations is very short in duration and thus are fairly hard to see in
Figure 16.
Figure 16: Highway Engine On/Off Strategy Summary
5.2 High Voltage Battery Usage
During Highway operation, battery usage is fairly minimal with the engine providing the
majority of the vehicle tractive power aside from a few occasions for engine restarting
and torque assistance. In fact, observed peak battery power is slightly higher compared
to the Urban cycle due to a high-power engine start. Regenerative braking peak power
is very similar to the Urban cycle. Table 5 shows the peak positive and negative powerobserved during Highway operation and Figure 17 provides a histogram of battery
usage during positive tractive effort events.
Table 5: Highway Cycle Peak Battery Power
Hwy Cycle
Peak Positive Battery Power (kW) 26.8
Peak Regen Battery Power (kW) -24.8
Figure 17: Highway Cycle Battery Usage Histogram
As with the engine data, more detailed, time-series data is provided as well. Figures 18
and 19 show the battery power and integrated current plots relative to the entire cycle.
Figure 18: Highway Cycle Battery Power
Figure 19: Highway Cycle Integrated Current5.3 Engine Oil Temperature
Engine oil temperature was also collected during highway operation. Figure 20 shows
the engine oil temperature over the second Highway cycle. In contrast to Urban
operation, the observed engine oil temperature during the Highway cycle was higher, in
the range of 90-98C.
Figure 20: Highway Cycle Engine Oil Temperature
6 US06 Cycle Operation
The final regulatory cycle used for this AVTA baseline testing is the US06 cycle. This
cycle represents a mix of more aggressive stop-and-go driving and higher speed
freeway type driving, but at generally higher speeds than the Highway cycle. As with
the Highway cycle, only the warm cycle is used for regulatory purposes. Table 6 shows
the tested fuel economy over the US06 Cycle.
Table 6: US06 Fuel Economy
US06 Cycle
Unadjusted Fuel Economy (mpg) 44
6.1 US06 Engine Operation
In a similar manner to the higher-speed Highway engine usage, the Prius shows a
relatively large fraction of operation in the 1250-1500 RPM operating range. However,
the more aggressive driving of the US06 cycle also shows much more usage at higher
engine speeds and thus power levels. Figure 21 shows the histogram of engine usage
over the US06 cycle. Due to the stop-and-go nature of certain sections of the cycle, the
vehicle also operates in engine-off mode about 20% of the total cycle time.Figure 21: US06 Cycle Engine Speed Histogram
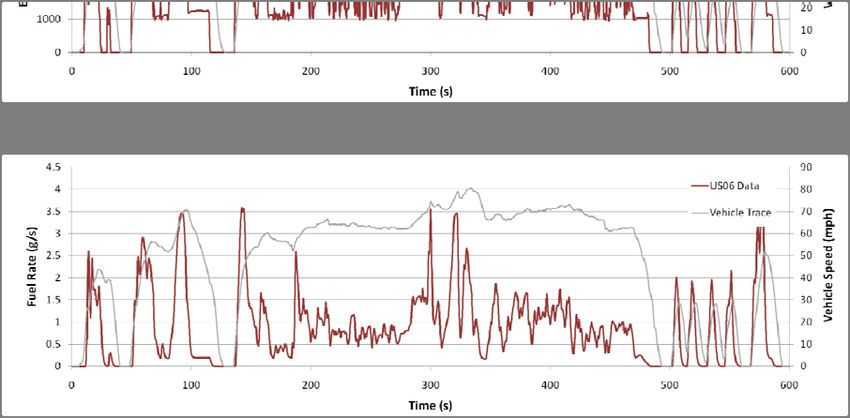
Figures 22 and 23 show more detailed information regarding engine speed and fueling
over the US06 cycle. As can be expected with the more aggressive operation, engine
speed and fueling show a much greater range of operation.
Figure 22: US06 Cycle Engine Speed
Figure 23: US06 Cycle Fuel Rate
Figure 24 shows a summary plot of the basic engine on/off strategy relative to vehicle
speed over the US06 cycle. As would be expected for this more aggressive cycle
engine-off operation is limited primarily to during vehicle decelerations.Figure 23: US06 Engine On/Off Strategy Summary
6.2 High Voltage Battery Usage
Battery usage over the US06 cycle displays quite a bit of battery assistance and overall
shows a higher peak positive power as compared to the other cycles. Interestingly, the
regenerative braking power observed is lower than that seen during Highway and Urban
operation. It would be expected that at least a similar level of regenerative braking
based battery power would be observed due to the US06 cycle’s more aggressive
braking. More discussion regarding this issue will be included later in this section.
Table 7 summarizes the observed peak battery power.
Table 7: US06 Peak Battery Power
US06 Cycle
Peak Positive Battery Power (kW) 28.0
Peak Regen Battery Power (kW) -20.0
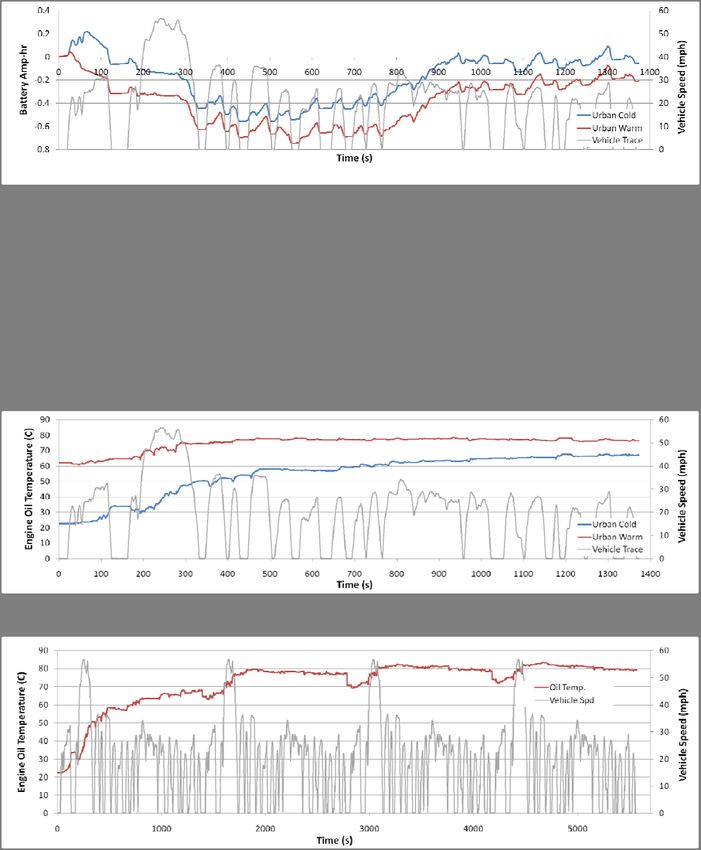
Figure 25 shows the battery usage histogram over the US06 cycle for all positive
tractive effort events. While there is still a significant amount of time spent at minimal
battery usage, the US06 shows a much wider range of both positive and negative
battery operation.Figure 25: US06 Cycle Battery Power Histogram
As mentioned previously, it is counterintuitive that the peak observed regenerative
braking power for the US06 cycle would be lower compared to the Urban and Highway
cycles. This behavior appears to be due to a de-rating of regenerative braking
capability (battery power) between the first (warm-up) and second (regulated) repeats of
the US06 cycle. As can be seen clearly in Figure 26 the first US06 cycle shows
increased regenerative capability much more in line with the roughly 25 kW observed
from the other cycles. It is hypothesized that this de-rating may be related to the more
frequent use of the battery during the US06 cycle and thus the need to reduce power
availability to maintain a stable battery temperature.
Figure 26: US06 Cycle Battery Power Prep. vs FE Cycle
More detailed information regarding the battery power and integrated current is shown
in Figures 27 and 28. As mentioned previously, battery power varies much more under
these more aggressive conditions. Assuming a 6.5 A-hr total battery capacity results in
roughly a 10% SOC swing on an Amp-hr basis, similar to what was observed on the
Urban cycle.Figure 27: US06 Cycle Battery Power
Figure 28: US06 Cycle Integrated Amp-Hours
6.3 Engine Oil Temperature
Engine oil temperature during the US06 cycle behaves as a mix between the Urban and
Highway cycles. During the more Urban sections, oil temperature is fairly steady.
During higher speed driving, oil temperature increases. Figure 29 shows the engine oil
temperature over the US06 cycle.
Figure 29: US06 Cycle Engine Oil Temperature7 Other Operation
In addition to the regulatory cycles, this AVTA baseline analysis also provides insight
regarding the current generation Prius relative to its driver selectable Eco and Power
modes and behavior over repeated accelerations.
7.1 Eco and Power Modes
The Prius provides the driver with selectable Eco and Power modes which change the
accelerator pedal mapping for the vehicle. Using the various modes on the Urban
cycle, minimal fuel economy change was observed. Figure 30 shows the tested Urban
fuel economy for the Prius operating in Standard, Power, and Eco mode. The observed
variation in fuel economy is well within expected test-to-test variation and should be
considered minimal.
Figure 30: Standard, Power, and Eco Mode Urban Warm Fuel Economy
Given the nature of pedal signal remapping, these results are reasonably expected over
a prescribed drive trace. Despite this fact, real-world fuel economy is likely to improve
when running in Eco mode due to the smoothed accelerator demand and additional
effort required to drive the vehicle aggressively. For comparison, Figure 31 shows the
pedal position over the same portion of the Urban cycle for the Standard, Eco, and
Power modes.Figure 31: Standard, Eco, and Power Mode Pedal Position During Urban Cycle
7.2 Repeated Accelerations
For this testing, 10 back-to-back maximum accelerations were run to assess
performance fade, the degradation of performance over repeated runs. Hybrid vehicles
typically scale back performance after a certain number of runs due to battery
management issues relating to state-of-charge management or thermal management.
Figure 32 shows the repeated performance cycles for the current generation Prius. It is
quite interesting to see that performance stays nearly constant across all of the 10 runs.
This consistent performance is due to minimal de-rating of positive battery power even
after 10 performance runs. Also of interest, is that regenerative power during the
deceleration back to zero mph begins to reduce after about the fourth cycle. This is
similar to what was observed during the US06 cycle and suggests that the regenerative
power is reduced before reducing the tractive power, minimizing the effect on
acceleration performance.
Figure 32: Battery Usage for Repeated Accelerations8 Conclusions and Future Work
Preliminary testing has provided significant insight into the operating strategies and
behavior of this new and state-of-the-art vehicle. The MY2010 Prius achieves high fuel
economy and clearly works to improve operating regimes that are often problematic for
hybrid vehicles. Relevant findings include:
Significant engine-off operation during Urban operation as well as some engine-
off operation at higher speeds.
A reduced fuel economy penalty between warm and cold Urban operation.
Use of a specific fueling/operating strategy for initial catalyst warm-up during the
cold Urban cycle.
Lower speed engine operation at higher vehicle speeds due to larger engine
displacement.
De-rating of battery regeneration capability during US06 testing and repeated
acceleration.
For the next phase of testing, the MY2010 Prius will be extensively instrumented and
tested over a much wider variety of cycles. This instrumentation will be used to gain
more insight into the operating strategies of this vehicle as well as delve more deeply
into the performance characteristics of the various components. Additionally, the
vehicle will be tested over many cycles in addition to the standard regulatory cycles as
well as different ambient temperatures to investigate specific design choices and
evaluate the real-world fuel economy of the vehicle in greater detail. This deeper
research will strongly leverage the preliminary testing and analysis contained in this
report and seek to understand the research findings in greater detail. Once complete,
the in-depth testing and analysis combined with this preliminary analysis will proved a
much deeper understanding of the MY2010 Prius as well as its applicability to additional
advanced vehicle research.
Detailed data regarding this vehicle as well as additional AVTA vehicles may be found
in ANL’s Downloadable Dynamometer Database (D3) at
https://webapps.anl.gov/vehicle_data/.Energy Systems Division Argonne National Laboratory 9700 South Cass Avenue, Bldg. 362 Argonne, IL 60439-4815 www.anl.gov Argonne National Laboratory is a U.S. Department of Energy laboratory managed by UChicago Argonne, LLC
You can also read