Optimal energy management system for distribution systems using simultaneous integration of PV-based DG and DSTATCOM units - Lietuvos mokslų akademija
←
→
Page content transcription
If your browser does not render page correctly, please read the page content below
ENERGETIKA. 2020. T. 66. Nr. 1. P. 1–14
© Lietuvos mokslų akademija, 2020

Optimal energy management system for
distribution systems using simultaneous integration
of PV-based DG and DSTATCOM units

Adel Lasmari1,                                   The energy management system (EMS) of an electrical distri-
                                                 bution system (EDS), with the integration of distributed gen-
Mohamed Zellagui2, 3,                            eration (DG) and distribution static compensator (DSTAT-
                                                 COM), provides numerous benefits and significantly differs
Rachid Chenni1,                                  from the existing EDSs. This paper presents an optimal inte-
                                                 gration of DG based on photovoltaic (PV) solar panels and
Smail Semaoui4,                                  DSTATCOM in EDS. A single objective function, based on
                                                 maximizing the active power loss level (APLL) in EDS, is de-
Claude Ziad El-Bayeh5,                           ployed to find the optimal size and location of photovoltaic
                                                 DG and DSTATCOM simultaneously in different study cases
Heba Ahmed Hassan6                               using various particle swarm optimization (PSO) algorithms.
                                                 These PSO algorithms are the basic PSO, adaptive acceler-
1
 MoDERNa Laboratory,                             ation coefficients PSO (AAC-PSO), autonomous particles
Department of Electrotechnic,                    groups for PSO (APG-PSO), nonlinear dynamic acceleration
Mentouri University of Constantine 1,            coefficients PSO (NDAC-PSO), sine cosine acceleration co-
Constantine, Algeria                             efficients PSO (SCAC-PSO), and time-varying acceleration
Email: adel.lasmari@umc.edu.dz,                  PSO (TVA-PSO). These algorithms are applied to the stand-
rachid.chenni@umc.edu.dz                         ard IEEE 33- and 69-bus EDSs, which are used as test sys-
                                                 tems to verify the effectiveness of the proposed algorithms.
2
 Department of Electrical Engineering,           Simulation results prove that the TVA-PSO algorithm exhib-
École de Technologie Supérieure (ÉTS),           its higher capability and efficiency in finding optimum solu-
Montréal, Québec, Canada                         tions. Comparing the simulation results attained for different
                                                 study cases leads to the conclusion that DG and DSTATCOM
3
 Department of Electrical Engineering,           were optimally-allocated simultaneously, which resulted in
Faculty of Technology,                           a significant reduction of power losses and an enhancement
University of Batna 2, Fesdis, Batna, Algeria
                                                 of the voltage profile.
Email: m.zellagui@ieee.org,
m.zellagui@univ-batan2.dz
                                                 Keywords: energy management system (EMS), electrical dis-
                                                 tribution system (EDS), renewable energy resources (RES),
4
 Division Énergie Solaire Photovoltaïque,
                                                 distributed generation (DG), distribution static compensator
Centre de Développement
des Energies Renouvelables (CDER),               (DSTATCOM), active power loss level, particle swarm opti-
Algiers, Algeria                                 mization algorithm
Email: s.semaoui@cder.dz

5
 Canada Excellence Research Chairs Team,
Concordia University, Montréal, Québec, Canada
Email: c.bayeh@hotmail.com

6
 Department of Electrical Power Engineering,
Cairo University, Giza, Egypt
Email: hebahassan@ieee.org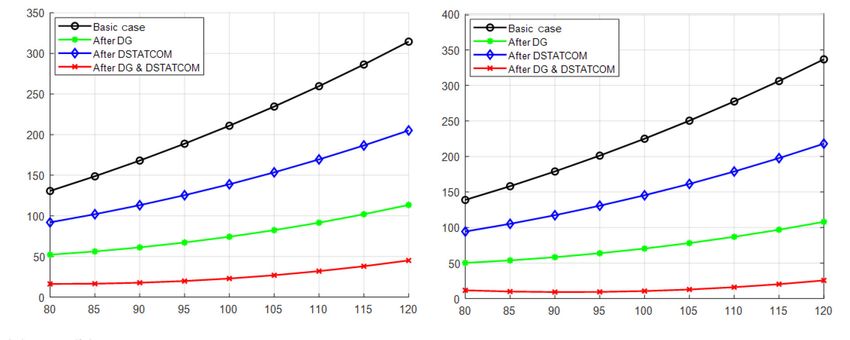
2   Adel Lasmari, Mohamed Zellagui, Rachid Chenni, Smail Semaoui, Claude Ziad El-Bayeh, Heba Ahmed Hassan

INTRODUCTION                                            algorithm (ICSA) [14], multi-verse optimizer
                                                        (MVO) algorithm [15], modified bat algorithm
The demand for electricity has recently increased       (MBA) [16] and artificial fish swarm optimiza-
due to the ongoing urbanization and the indus-          tion algorithm (AFSOA) [17]. Recently in 2020,
trial revolution. In early ages, electric demand        the applied discrete rooted tree optimization
was mainly fulfilled by fossil fuel-based power         (DRTO) technique [18], Latin hypercube sam-
generation, which nowadays constitutes a seri-          pling (LHS) algorithm [19] and whale optimiza-
ous threat to environment. In order to address          tion algorithm (WOA) [20] were used.
this problem, the renewable energy-based power              This paper presents a new approach for
generation in the electrical distribution system        the identification of the optimal location and size
(EDS) has become of great interest and impor-           of photovoltaic source-based DG and DSTAT-
tance. The integration and utilization of renew-        COM simultaneously into EDS using various
able energy sources in the existing conventional        PSO algorithms. The algorithms are based on
EDSs are becoming more attractive and valuable          the variation of acceleration coefficients (cogni-
due to their technical and economic impacts [1].        tive and social values), which aim to maximize
In the present‐day scenario, power system util-         the active power loss level (APLL) and improve
ities are operating closer to the stability margin      the voltage profile of EDS. The algorithms are
because of an enormous load growth and an un-           tested on two different standard IEEE 33- and 69-
desired power flow, depending on the energy ef-         bus EDS systems using the following algorithms:
ficiency policy in the country [2, 3]. The energy       basic PSO, AAC-PSO, APG-PSO, NDAC-PSO,
management system (EMS) is the central control          SCAC-PSO and TVA-PSO. From comparing
unit for an EDS, which would control the power          the optimization results of the TVA-PSO algo-
flow among the elements of the system and with          rithm with the rest of PSO applied algorithms to
regard to the external grid.                            the test systems, it can be deduced that the re-
    The expansion of an existing EDS or the con-        sults obtained using the TVA-PSO algorithm are
struction of new centralized generation units has       better in terms of maximizing the APLL.
become not practically feasible because of vari-
ous restrictions [4]. These issues divert the at-       PROBLEM FORMULATION AND
tention of EDS planners towards the simultane-          CONSTRAINTS
ous deployment of distributed generation (DG)
and distribution static compensator (DSTAT-             The objective function
COM) [5, 6]. In order to enhance the stability          The main objective function to be maximized is
and power quality of the system, DSTATCOM               the APLL, i.e. maximizing the reduction of active
is used in the EDS to automatically compensate          power loss:
reactive power according to the system variable                                         N Bus N Bus
loads [7].
    In literature, issues and challenges of EDS
                                                            Objective Function = Max    ∑ ∑ APLL(i, j ). (1)
                                                                                       =i 1 =j 2
can be addressed through several solutions. Nu-         Here,
merous algorithms have been developed by re-
searchers to address the best allocation of simul-          APLL(i, j ) =
taneous deployment of DG and DSTATCOM in                                                                       (2)
                                                                           Before DG/DSTATCOM
EDS. Some of the algorithms used in 2018 were,                           PLoss
                                                              Before DG/DSTATCOM        After DG/DSTATCOM
                                                                                                          × 100%.
for example, the applied cuckoo searching algo-             PLoss                   + PLoss
rithm (CSA) [8], improved PSO algorithm based
on success rate (IPSO-SR) [9], flower pollination          The active power loss on the distribution line
algorithm (FPA) [10], honey bees mating opti-           connecting bus i to bus j [21, 23] is represented by
mization (HBMO) algorithm [11] and water cy-            the following equation:
cle algorithm (WCA) [12]. In 2019, examples of
the algorithms used were the applied rooted tree           PLoss(i, j) = αij(PiPj + QiQj) + βij(QiPj + PiQj). (3)
optimization (RTO) [13], improved crow search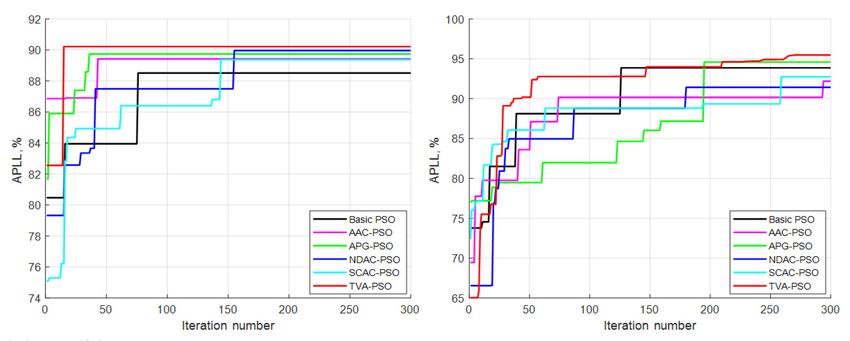
Optimal energy management system for distribution systems using simultaneous integration ... 3
Here, nDG,i/Location ≤ 1. (15)
Rij
αij cos(δi – δ j ), (4)
VV
i j DSTATCOM constraints
Inequality constraints represent the DSTATCOM
Rij
βij cos (δi – δ j ). (5) unit’s limits which can formulate as follows [15]:
VV
i j
min max
QDSTATCOM ≤ QDSTATCOM ≤ QDSTATCOM , (16)
Distribution line constraints
N DST N bus
Power conservation constraint [21–24]:
DSTATCOM
=i 1 =j 1
∑Q (i ) ≤ ∑ QD (i ), (17)
PG + PDG = PD + PLoss, (6)
2 ≤ DSTATCOMPosition ≤ NBus, (18)
QG + QDSTATCOM = QD + QLoss. (7)
NDSTATCOM ≤ NDSTATCOM.max, (19)
Bus voltage limits:
nDSTATCOM,i / Location ≤ 1. (20)
Vmin ≤ |Vi| ≤ Vmax. (8)
Voltage drop limit: OVERVIEW OF VARIOUS PSO
ALGORITHMS
|1 – Vi| ≤ ∆Vmax. (9)
The PSO algorithm was first introduced in 1995,
which can be seen as a global search technique. In
Line capacity limit:
this algorithm, each particle, denoted by i, has a ve-
locity vector (Vi) and a position vector (Xi). It can
|Sij| ≤ |Smax|. (10)
be represented by the following equations [25]:
Vk+1
i
= ω.Vki +c1r1[P best
k
–Xki ] +
DG constraints
Inequality constraints represent the DG unit’s c2r2[G best
k
–Xki ] , (21)
limits [21, 23], which can be given by
X k+1
i
= X ki + V k+1
i
. (22)
min max
P DG ≤ PDG ≤ P DG
, (11)
Various novel PSO algorithms, in which time-
N DG N bus
varying acceleration coefficients are included, are
∑P
DG
=i 1 =j 1
(i ) ≤ ∑ PDG (i ), (12) applied in this paper. These PSO algorithms are
shown in Table 1.
, Different time-varying updating strategies for
2 ≤ DGPosition ≤ NBus (13)
c1 and c2 acceleration coefficients for various PSO
NDG ≤ NDG.max, (14) algorithms are represented in Fig. 1.
Table 1. Various equations of PSO algorithms applied
Algorithm Ref. Acceleration coefficients formula Constants
2
4×k
−
kmax
c1 = cmin + (cmax − cmin )e cmin = 0.5
AAC-PSO [26] 2
4×k
– cmax = 2.5
kmax
c2 = cmax – (cmax – cmin )e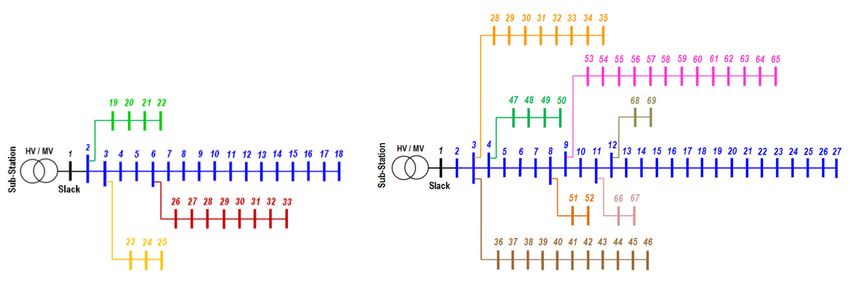
4 Adel Lasmari, Mohamed Zellagui, Rachid Chenni, Smail Semaoui, Claude Ziad El-Bayeh, Heba Ahmed Hassan
Table 1. (Continued)
Algorithm Ref. Acceleration coefficients formula Constants
2× kα
c1 1.95 −
= α
kmax
APG-PSO [27] α = 1/3
2× kα
c2 0.05 +
= α
kmax
2
k
− ( c f − ci ) ×
c1 = + cf
kmax ci = 0.5
NDAC-PSO [28]
2
k k cf = 2.5
c2 = ci × 1 − + cf ×
kmax kmax
k π
c1 = ∂ × sin 1 − × + δ
kmax 2 ∂=2
SCAC-PSO [29]
k π δ = 0.5
c2 = ∂ × cos 1 − × + δ
kmax 2
c1 f − c1i
c=
1 c1i + .k c1i = 2.5
kmax c1f = 0.5
TVA-PSO [30]
c2 f − c2i c2i = 0.5
c=
2 c2i + .k c2f = 2.5
kmax
Fig. 1. Variation of acceleration coefficients for PSO algorithms applied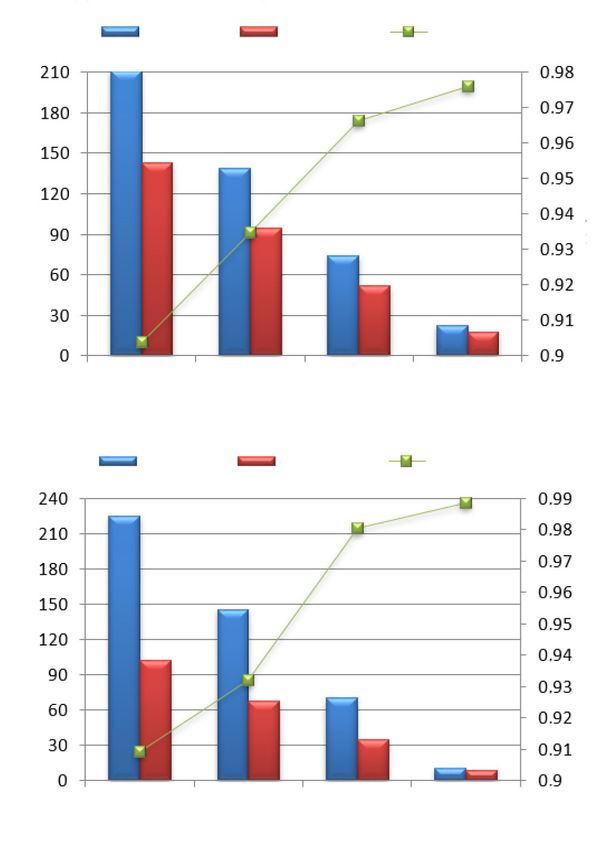
Optimal energy management system for distribution systems using simultaneous integration ...            5

    As shown in Fig. 1, while using the basic PSO                        Comparison among various algorithms
algorithm, despite the variation of the num-                             applied
ber of iterations, the acceleration coefficients                         The convergence optimization characteristics of
c1 and c2 are constant. However, in other algo-                          various PSO algorithms proposed for the two
rithms, the acceleration coefficients vary with                          distribution systems, in the presence of both DG
iterations.                                                              and DSTATCOM, are presented in Fig. 3.
    Furthermore, c1 is decreased from 2.5 to                                Results of the IEEE 33-bus system are shown
0.5 for all the algorithms except for APG-PSO,                           in Fig. 3(a) for various algorithms, where all
in which c1 varies from 1.65 to 0. On the other                          algorithms converge in 10 to 150 iterations.
hand, c2 is increased from 0.5 to 2.5 for almost                         Among these algorithms, the TVA-PSO, APG-
all algorithms except for APG-PSO, in which c2                           PSO and AAC-PSO are faster in convergence as
varies from 0.35 to 2.05. It is also noticed that                        the optimal solution is reached in less than 50 it-
the AAC-PSO shows a rapid variation to retain                            erations. The optimal values of APLL are close to
a stable form, whereas the NDAC-PSO takes                                each other for almost all of the algorithms, and
longer for c2 to be greater than c1.                                     they are around 90% of the initial values.
                                                                            For the IEEE 69-bus, Fig. 3(b) clearly shows
TEST SYSTEMS, RESULTS AND                                                that all the algorithms take a long time to reach
COMPARISON                                                               the optimal solution, with more than 170 iter-
                                                                         ations, except for the basic PSO that converges
Various PSO algorithms are implemented in                                in 130 iterations. On the other hand, the TVA-
MATLAB and applied to two standard IEEE                                  PSO encountered the best APLL, but it takes
distribution systems. The first test system used                         260 iterations to achieve the optimal solution.
in this study is the standard IEEE 33-bus EDS                            The maximum values of APLL are not much
represented in Fig. 2(a), which is composed of                           far from each other; moreover, it can be not-
33 buses and 32 distribution lines. The active                           ed that the best results are obtained by TVA-
and reactive power losses calculated from power                          PSO for the two test systems. These values are
flow are 210.987 kW and 143.128 kVar, respec-                            90.2161 and 95.4715%, respectively. In addi-
tively. Fig. 2(b) represents the second test system,                     tion, it is noted that the first test system con-
which is the standard IEEE 69-bus EDS, that is                           verges faster when compared with the second
composed of 69 buses and 68 distribution lines.                          system.
The active and reactive power losses in the EDS                             Figure 4 illustrates the boxplot of APLL using
are 224.948 kW and 102.140 kVar, respectively.                           various PSO algorithms applied to the two test
The base voltage of the two EDSs is 12.66 kV.                            systems.

 (a)                                                        (b)

Fig. 2. Single line diagram of standard EDS: (a) IEEE 33-bus, (b) IEEE 69-bus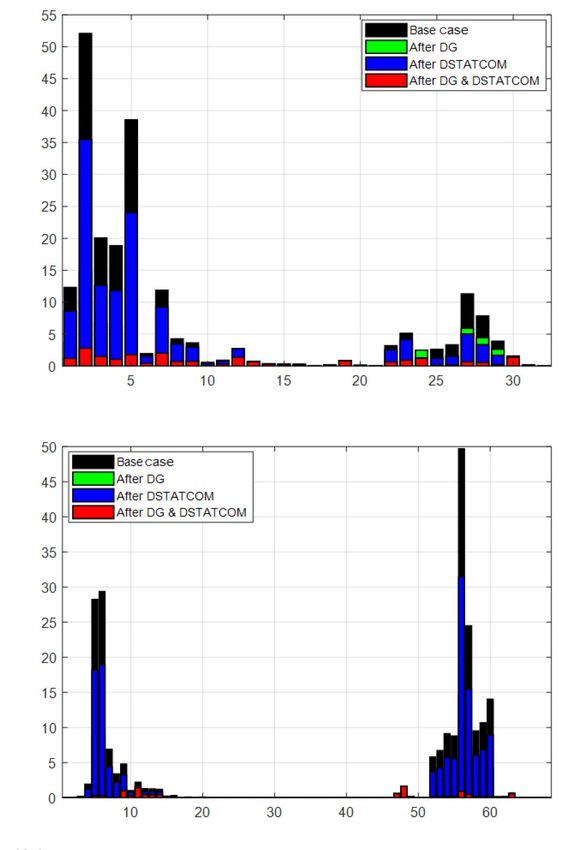
6    Adel Lasmari, Mohamed Zellagui, Rachid Chenni, Smail Semaoui, Claude Ziad El-Bayeh, Heba Ahmed Hassan

        (a)                                                                     (b)

Fig. 3. Convergence curves of various PSO algorithms: (a) IEEE 33-bus, (b) IEEE 69-bus

        (a)                                                                   (b)

Fig. 4. Boxplot of APLL for various PSO algorithms: (a) IEEE 33-bus, (b) IEEE 69-bus

     Considering the results of both test sys-                           that chooses buses 13, 24 and 30 as an optimal
tems as in Fig. 4, while taking into account                             location for the integration of DG units, with
the same number of iterations and population                             a total size of 2.3251 MW. Simultaneously, buses
size, the boxplots prove that the results of all                         4, 29 and 30 are found to be the best location
algorithms applied are close to each other. Fur-                         for the integration of DSTATCOM units, with
thermore, the best (maximum) APLL results are                            a total size of 1.9985 MVar. This integration led
obtained when using the TVA-PSO algorithm.                               to reducing the active power loss from 210.9875
    The results of the test systems after the installa-                  to 22.8821 kW with a reduction percentage
tion and optimization of the simultaneously used                         of up to 89.1547%. In addition, the APLL was
DG and DSTATCOM are presented in Table 2.                                maximized to 90.2161%. On the other hand,
    The analysis of the results tabulated in Table 2                     the minimum reactive power loss is obtained
for the first test system (IEEE 33-bus system)                           when using the NDAC-PSO algorithm, which is
reveals that the integration of DG and DSTAT-                            17.2421 kVar. The minimum voltage is increased
COM units simultaneously contributes to mini-                            from 0.9038 to 0.9907 p.u. when using the AAC-
mizing the total power loss to acceptable values                         PSO algorithm.
for all the algorithms. The best result of APLL                              For the second test system (IEEE 69-bus sys-
is obtained by applying the TVA-PSO algorithm                            tem), the TVA-PSO algorithm identifies the buses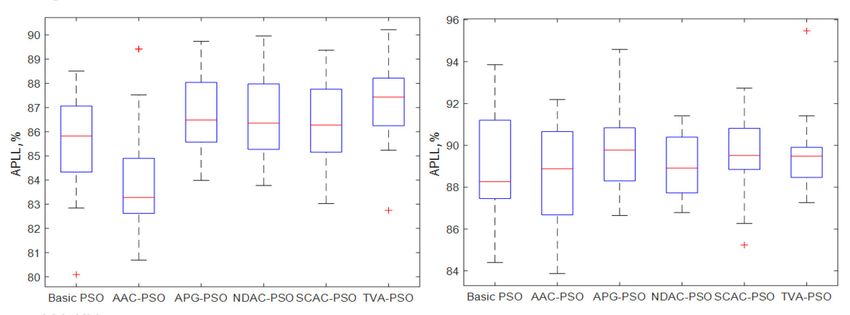
Optimal energy management system for distribution systems using simultaneous integration ...             7

Table 2. Optimization results of simultaneous installation of DG and DSTATCOM

                                                        (a) IEEE 33-bus
                            DG               DSTATCOM              PLoss, kW     QLoss, kVar     Vmin, p.u.     APLL, %
                        P (MW); Bus         Q (MVar); Bus
                          1.0154 (9)          0.6034 (8)
     Basic PSO            0.3514 (24)         0.4663 (22)           27.3993       20.3035          0.9750       88.5063
                          0.8445 (30)         0.8567 (30)
                          0.8507 (14)         0.0100 (3)
     AAC-PSO              0.8103 (25)         0.6906 (26)           24.9642       20.7094          0.9907       89.4202
                          1.3916 (29)         0.7237 (32)
                          0.5494 (15)         0.7407 (8)
     APG-PSO              1.0485 (24)         0.3521 (29)           24.1281       18.0946          0.9785       89.7378
                          0.7655 (30)         0.4405 (32)
                          0.8374 (6)          0.4739 (10)
     NDAC-PSO             0.7970 (12)         0.5736 (30)           23.5550       17.2421          0.9813       89.9571
                          0.6296 (32)         0.3713 (31)
                          0.7748 (10)         0.4407 (11)
     SCAC-PSO             1.0305 (24)         1.1710 (19)           25.0973       19.6188          0.9798       89.3695
                          0.9038 (32)         1.1789 (28)
                          0.7712 (13)         0.7783 (4)
      TVA-PSO             0.7808 (24)         0.6314 (29)           22.8821       17.8931          0.9760       90.2161
                          0.7731 (30)         0.5888 (30)
                                                        (b) IEEE 69-bus
                             DG              DSTATCOM
                                                                   PLoss, kW     QLoss, kVar     Vmin, p.u.     APLL, %
                         P (MW); Bus        Q (MVar); Bus
                          0.4175 (17)         0.0100 (41)
     Basic PSO            1.8976 (62)         1.5836 (61)           14.7216       10.9116          0.9929       93.8572
                          0.0638 (67)         0.2137 (69)
                          0.9258 (50)         0.7334 (40)
     AAC-PSO              1.6670 (63)         1.0379 (52)           19.0555       10.2770          0.9838       92.1905
                          0.7815 (66)         1.1509 (63)
                          0.4614 (20)         0.0100 (6)
     APG-PSO              0.0632 (53)         0.0100 (54)           12.8728       10.3139          0.9910       94.5873
                          1.6033 (61)         1.3875 (61)
                          0.0100 (42)         0.0594 (13)
     NDAC-PSO             1.9423 (62)         0.9283 (59)           21.1266       13.3832          0.9838       91.4144
                          0.7921 (66)         0.4917 (65)
                          0.0100 (13)         0.7290 (29)
     SCAC-PSO             0.2787 (25)         0.0100 (51)           17.6186       12.9267          0.9857       92.7364
                          1.8718 (62)         1.1561 (62)
                          0.9159 (12)         0.7785 (11)
      TVA-PSO             0.1344 (22)         0.0942 (24)           10.6691        9.1144          0.9886       95.4715
                          1.3616 (61)         1.2234 (61)

12, 22 and 61 as the optimal locations to install                  9.1144 kVar, respectively, which contribute to
the DG units. Similarly, the buses 11, 24 and 61                   maximizing the APLL to 95.4715%. This note is
are the best locations to install the DSTATCOM                     valid for the rest of algorithms but with less ef-
units. This integration led to minimizing the ac-                  ficiency compared to the TVA-PSO algorithm.
tive and reactive power loss to 10.6691 kW and                     APLL is maximized to 93.8572, 92.1905, 94.5873,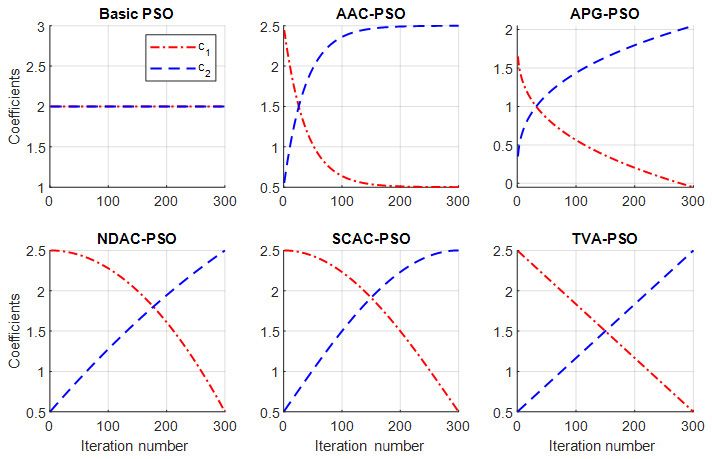
8   Adel Lasmari, Mohamed Zellagui, Rachid Chenni, Smail Semaoui, Claude Ziad El-Bayeh, Heba Ahmed Hassan

91.4144 and 92.7364% in the case of using the ba-                  only, and simultaneous operation of DG and
sic PSO, AAC-PSO, APG-PSO, NDAC-PSO                                DSTATCOM) compared to the base case,
and SCAC-PSO algorithms, respectively. Fur-                        where the simultaneous installation of DG and
thermore, the voltage profile is improved from                     DSTATCOM provides more enhancement in
0.9092 to 0.9929 p.u. as in the case of using                      the voltages profile.
the basic PSO algorithm.                                              The minimum voltage is improved from
                                                                   0.9038 to 0.9760 p.u. for the first test system, and
Study of the efficient energy on EDS                               from 0.9092 to 0.9886 p.u. for the second test
For the two test systems studied in this paper,                    system in the simultaneous presence of DG and
the best algorithm is found to be the TVA-PSO                      DSTATCOM.
if we chose to study the efficient energy of dif-                     Figure 6 shows the effect of the installation of
ferent case studies. Figure 5 represents the effect                DG, DSTATCOM, and the simultaneous opera-
of the installation of DG, DSTATCOM, and si-                       tion of DG and DSTATCOM on the active power
multaneous operation of DG and DSTATCOM                            loss of each line branch for each of the two test
on the voltage profile of each of the two systems.                 systems.
    From Fig. 5, for both test systems, it is clear                   Figure 6 shows that the results of the two case
that the voltages profile is improved for the three                studies show that more reduction in active pow-
case studies (integration of DG only, DSTATCOM                     er loss is achieved in the case of simultaneous

                      (a)

                     (b)

                     Fig. 5. Bus voltages profile of EDS: (a) IEEE 33-bus, (b) IEEE 69-bus
Optimal energy management system for distribution systems using simultaneous integration ... 9
(a)
PLoss, kW
(b) Branch number
PLoss, kW
Branch number
Fig. 6. Active power loss in branches of EDS: (a) IEEE 33-bus, (b) IEEE 69-bus
installation of DG and DSTATCOM for all Figure 7 shows that the comparison among all
branches, compared to the other cases (using case studies indicates that the integration of DG
DG only or DSTATCOM only). and DSTATCOM simultaneously provides more
Following the individual integration of DG reduction of active and reactive power losses, and
and DSTATCOM, and the simultaneous installa- achieves the highest minimum voltage profile
tion of DG and DSTATCOM, a noticeable reduc- compared to other case studies of using an indi-
tion of active power loss is noted in all branches vidual DG or a DSTATCOM unit.
compared to the base case. However, the simul- For the first test system, comparing various
taneous integration of DG and DSTATCOM case studies indicates that the simultaneous
offers the maximum reduction, which is at- integration of DG and DSTATCOM leads to
tributed to injecting active power by DG and reducing power loss with a reduction percent-
reactive power by DSTATCOM at the same age of almost 89.1547%. This is followed by
time. Concerning the maximum active pow- the case of using DG only, where the reduc-
er loss of branches, it is reduced from 52.0667 tion percentage of power loss becomes close to
to 2.8130 kW in the first test system, and from 64.7905%. Using DSTATCOM only comes last
49.6844 to 0.9287 kW in the second test system. as it encounters the least reduction percentage
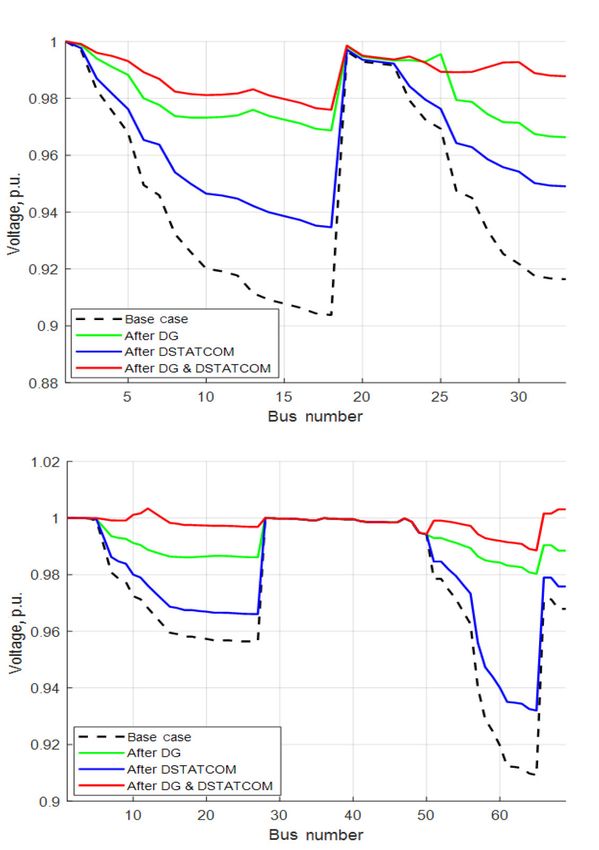
Figure 7 represents the total power losses (ac- of power loss, which is 34.1581%. Furthermore,
tive and reactive) and the minimum bus voltages the best (maximum) reduction of reactive power
in the two systems for different case studies. loss and the best voltage values in EDS occur in10 Adel Lasmari, Mohamed Zellagui, Rachid Chenni, Smail Semaoui, Claude Ziad El-Bayeh, Heba Ahmed Hassan
(a)
P loss, kW Q loss, kVar V min, p.u.
Power loss
Voltage
Base case After After DG After DG&
DSTATCOM DSTATCOM
(b) P loss, kW Q loss, kVar V min, p.u.
Voltage
Power loss
Base case After After DG After DG&
DSTATCOM DSTATCOM
Fig. 7. Active and reactive power losses and minimum voltage of EDS: (a) IEEE 33-bus, (b) IEEE 69-bus
the case of the simultaneous installation of DG where load demand has varied from 80 to 120%
and DSTATCOM. with a step of 5% for all load buses for each of
For the second test system, the trend of results the two test systems.
obtained is similar to that obtained for the first Figure 8 reveals that the active power loss-
test system. However, more efficiency is shown es almost vary in a linear characteristic with
in terms of reducing the power loss with a high- the linear variation of loads, in the basic case and
er reduction percentage, that reaches 95.2570, after integration of DG or/and DSTATCOM. In
68.6907 and 35.3660% for the three cases of addition, the power losses after the simulta-
using DG and DSTATCOM simultaneously, DG neous installation of DG and DSTATCOM are
only and DSTATCOM only, respectively. noted to be always smaller than the power losses
For both test systems, the impact of loadabil- when using DG only or DSTATCOM only. It is
ity (variation of load demand) on the total ac- noted that for whatever load increase, the simul-
tive power losses is investigated in the basic case taneous integration of DG and DSTATCOM in
and in the three cases of integrating the DG and the system has the ability to achieve a significant
DSTATCOM units. Results are shown in Fig. 8, reduction in active power loss.Optimal energy management system for distribution systems using simultaneous integration ... 11
(a) (b)
PLoss, kW
PLoss, kW
Loadability, % Loadability, %
Fig. 8. Active power losses for different loadability values: (a) IEEE 33-bus, (b) IEEE 69-bus
CONCLUSIONS mum APLL values with fast convergence charac-
teristics. In addition, the statistical analysis con-
In this paper, various PSO algorithms were used firms the efficiency of the TVA-PSO algorithm in
to solve the problem of optimal simultaneous in- achieving the best value of APLL when compared
tegration of the PV-based DG and DSTATCOM with other algorithms. Furthermore, when both
units in the standard IEEE 33- and 69-bus EDSs. DG and DSTATCOM are simultaneously placed,
The optimization is based on a single objec- the overall system performance is also improved.
tive function that aims at maximizing APLL for This observation is still valid for the two standard
the best optimal EMS. IEEE test systems.
The simulation results proved the efficien- From the above discussion, it can be deduced
cy and robustness of the TVA-PSO algorithm, that the TVA-PSO algorithm could be simply ap-
compared with other PSO algorithms, in terms plied to practical, large-scale, complex EDSs in
of achieving minimum power losses and maxi- electrical power distribution companies.
NOMENCLATURE
PLoss, QLoss Total active and reactive power losses
Pij, Qij Active and reactive power in branch ij
Pi, Qi Active and reactive power at bus i
Pj, Qj Active and reactive power at bus j
Nbus Number of buses
Rij, Xij Resistance and reactance of line
Vi, δi Voltage magnitude and angle
PG, QG Active and reactive power of generator
PD, QD Active and reactive power of load demand
PDG Active power injection from PV-DG unit
Vmin, Vmax Specified voltages limits
ΔVmax Maximum voltage drops
Sij Apparent power in branch ij12 Adel Lasmari, Mohamed Zellagui, Rachid Chenni, Smail Semaoui, Claude Ziad El-Bayeh, Heba Ahmed Hassan
Smax Maximum apparent power
PDGmin, PDGmax Active power output limits of DG
Q DSTATCOM
,Q
min
DSTATCOM
max
Reactive power output limits of DSTATCOM
DGPosition Position of DG units
DSTATCOMPosition Position of DSTATCOM units
NDG, NDSTATCOM Number of DG and DSTATCOM units
NDG.max, NDSTATCOM.max Maximum number of DG and DSTATCOM units
nDG, i, nDSTATCOM, i Location of DG and DSTATCOM units at bus i
P Population of individuals
Xi Position of particle
Vi Velocity of particle
Pbest Best locations found by particle
Gbest Best locations found by all particles
c1 The cognitive acceleration factor
c2 The social acceleration factor
ω The inertia weight
r1, r2 Random values belong to [0, 1]
cmin, cmax Limits values of c1 and c2
k Number of iterations
kmax Maximum number of iterations
Received 21 December 2019 PV system. Energy Procedia. 2017. Vol. 141.
Accepted 20 March 2020 P. 66–70.
4. Sannigrahi S., Ghatak S. R., Acharjee P. Fuzzy
References logic–based rooted tree optimization algorithm
for strategic incorporation of DG and DSTAT-
1. Pesaran H. A. M., Huy P. D., Ramachandara- COM. International Transactions on Electrical
murthy V. K. A review of the optimal alloca- Energy Systems. 2019. Vol. 29. No. 8. e12031.
tion of distributed generation: objectives, con- P. 1–30.
straints, methods, and algorithms. Renewable 5. Hien N. C., Mithulananthan N., Bansal R. C.
and Sustainable Energy Reviews. 2017. Vol. 75. Location and sizing of distributed generation
P. 293–312. units for loadability enhancement in prima-
2. Fahad S. A., El-Hawary M. E. Optimal distrib- ry feeder. IEEE Systems Journal. 2013. Vol. 7.
uted generation allocation and sizing in distri- No. 4. P. 797–806.
bution systems via artificial bee colony algo- 6. Taher S. A., Afsari S. A. Optimal location and
rithm. IEEE Transactions on Power Delivery. sizing of DSTATCOM in distribution systems
2011. Vol. 26. No. 4. P. 2090–2101. by immune algorithm. International Journal
3. Bouchakour S., Hadj Arab A., Abdeladim K., of Electrical Power & Energy Systems. 2014.
Ould Amrouche S., Semaoui S., Taghezouit B., Vol. 60. P. 34–44.
Boulahchiche S., Razagui A. Investigation of 7. Yuvaraj T., Ravi K., Devabalaji K. R. DSTAT-
the voltage quality at PCC of grid connected COM allocation in distribution networksOptimal energy management system for distribution systems using simultaneous integration ... 13
considering load variations using bat algo- Power Systems Conference (MEPCON), Tanta,
rithm. Ain Shams Engineering Journal. 2017. Egypt, 17–19 December 2019. P. 277–282.
Vol. 8. No. 3. P. 391–403. 16. Pottukkannan B., Thangaraj Y., Kaliyaperu-
8. Yuvaraj T., Ravi K. Multi-objective simultane- mal D., Abdul Rasheed M. I., Perumal M. P.
ous DG and DSTATCOM allocation in radial Integration of solar and wind based DGs with
distribution networks using cuckoo searching DSTATCOM in distribution systems using
algorithm. Alexandria Engineering Journal. modified bat algorithm. Gazi University Journal
2018. Vol. 57. No. 4. P. 2729–2742. of Science. 2019. Vol. 32. No. 3. P. 895–912.
9. Ghatak S. R., Sannigrahi S., Acharjee P. Com- 17. Salkuti S. R. Optimal location and sizing of DG
parative performance analysis of DG and and D-STATCOM in distribution networks. In-
DSTATCOM using improved PSO based on donesian Journal of Electrical Engineering and
success rate for deregulated environment. IEEE Computer Science. 2019. Vol. 16. No. 3. P. 1107–
Systems Journal. 2018. Vol. 12. No. 3. P. 2791– 1114.
2802. 18. Sannigrahi S., Ghatak S. R., Acharjee P. Mul-
10. Bhat M. V., Manjappa N. Flower pollination ti-scenario based bi-level coordinated planning
algorithm based sizing and placement of DG of active distribution system under uncertain
and D-STATCOM simultaneously in radial dis- environment. IEEE Transactions on Industry
tribution systems. Proceedings of 20th National Applications. 2020. Vol. 56. No. 1. P. 850–863.
Power Systems Conference (NPSC), Tiruchirap- 19. Rezaeian-Marjani S., Galvani S., Galvanat V.,
palli, India, 14–16 December 2018. P. 1–5. Farhadi-Kangarlu M. Optimal allocation of
11. Ahmadnia S., Tafehi E. Comparison of opti- D-STATCOM in distribution networks includ-
mum wind-solar DG, STATCOM and capaci- ing correlated renewable energy sources. Inter-
tor placement and sizing based on voltage sta- national Journal of Electrical Power & Energy
bility margin enhancement in microgrid with Systems. 2020. Vol. 122. P. 1–14.
three different evolutionary algorithms. Iranian 20. Yuvaraj T., Devabalaji K. R., Thanikanti S. B. Si-
Journal of Science and Technology, Transactions multaneous allocation of DG and DSTATCOM
of Electrical Engineering. 2017. Vol. 41. No. 3. using whale optimization algorithm. Iranian
P. 241–253. Journal of Science and Technology, Transactions
12. El-Ela A. A., El-Sehiemy R. A., Abbas A. S. Op- of Electrical Engineering. 2020. Vol. 44. P. 879–
timal placement and sizing of distributed gen- 896.
eration and capacitor banks in distribution sys- 21. Settoul S., Chenni R., Hassan H. A., Zel-
tems using water cycle algorithm. IEEE Systems lagui M., Kraimia M. N. MFO algorithm for
Journal. 2018. Vol. 12. No. 4. P. 3629–3636. optimal location and sizing of multiple pho-
13. Sannigrahi S., Ghatak S. R., Acharjee P. Fuzzy tovoltaic distributed generations units for loss
logic-based rooted tree optimization algorithm reduction in distribution systems. Proceedings
for strategic incorporation of DG and DSTAT- of 7th International Renewable and Sustainable
COM. International Transactions on Electrical Energy Conference (IRSEC), Agadir, Morocco,
Energy Systems. 2019. Vol. 29. No. 8. P. 1–30. 27–30 November 2019. P. 1–6.
14. Sannigrahi S., Ghatak S. R., Acharjee P. Strate- 22. Shukor S. F. A., Musirin I., Hamid Z. A., Zama-
gically incorporation of RES and DSTATCOM ni M. K. M., Zellagui M., Suyono H. Intelligent
for techno-economic environmental benefits based technique for under voltage load shedding
using search space reduction-based ICSA. IET in power transmission systems. Indonesian Jour-
Generation, Transmission & Distribution. 2019. nal of Electrical Engineering and Computer Sci-
Vol. 13. No. 8. P. 1369–1381. ence. 2020. Vol. 17. No. 1. P. 110–117.
15. Hassan H. A., Zellagui M. MVO algorithm for 23. Settoul S., Zellagui M., Abdelaziz A. Y., Chenni R.
optimal simultaneous integration of DG and Optimal integration of renewable distributed gen-
DSTATCOM in standard radial distribution eration in practical distribution grids based on
systems based on technical-economic indices. moth-flame optimization algorithm. Proceedings
Proceedings of 21st International Middle East of International Conference on Advanced Electrical14 Adel Lasmari, Mohamed Zellagui, Rachid Chenni, Smail Semaoui, Claude Ziad El-Bayeh, Heba Ahmed Hassan
Engineering (ICAEE), Algiers, Algeria, 19–21 No- Adel Lasmari, Mohamed Zellagui,
vember 2019. P. 1–6. Rachid Chenni, Smail Semaoui,
24. Kellogg W. D., Nehrir M. H., Venkataramanan G., Claude Ziad El-Bayeh, Heba Ahmed Hassan
Gerez V. Generation unit sizing and cost analysis
for stand-alone wind, photovoltaic, and hybrid SKIRSTOMŲJŲ TINKLŲ OPTIMALIAM
wind/PV systems. IEEE Transactions on Energy ENERGIJOS VALDYMUI SISTEMA SU SAULĖS
Conversion. 1998. Vol. 13. No. 1. P. 70–75. MODULIAIS IR DSTATCOM TECHNOLOGIJA
25. Eberhart R., Kennedy J. A new optimizer using S antrauka
particle swarm theory. Proceedings of 6th Interna-
Skirstomojo tinklo energijos valdymo sistema (EMS),
tional Symposium on Micro Machine and Human
į kurią integruota paskirstyta generacija ir statinis
Science (MHS), Nagoya, Japan, 4–6 October 1995.
P. 39–43. skirstomųjų tinklų kompensatorius (DSTATCOM),
pasižymi daugybe privalumų ir labai skiriasi nuo
26. Ziyu T., Dingxue Z. A modified particle swarm
optimization with an adaptive acceleration coeffi- kitų, šiuo metu skirstomuosiuose tinkluose esančių,
cients. Proceedings of IEEE Asia-Pacific Conference sistemų. Straipsnyje pristatoma optimali saulės elekt
on Information Processing (APCIP), Shenzhen, rinės ir DSTATCOM integracija į skirstomąjį tinklą.
China, 18–19 July 2009. P. 330–332. Optimaliai galiai ir vietai nustatyti naudojama vieno
27. Mirjalili S., Lewis A., Sadiq A. S. Autonomous kriterijaus funkcija, ieškanti aktyviosios galios nuos-
particles groups for particle swarm optimization. tolių maksimumo, esant skirtingiems, tyrime užsi-
Arabian Journal for Science and Engineering. 2014. duotiems, scenarijams, ir naudojant įvairius dalelių
Vol. 39. No. 6. P. 4683–4697.
spiečių optimizacijos (PSO) algoritmus. Naudojamas
28. Chen K., Zhou F., Wang Y., Yin L. An ameliorated paprastasis PSO, adaptyviai greitėjančių koeficien-
particle swarm optimizer for solving numerical
tų PSO (AA-PSO), autonominių dalelių grupių PSO
optimization problems. Applied Soft Computing.
(APG-PSO), netiesinių greitėjančių koeficientų PSO
2018. Vol. 73. P. 482–496.
(NDAC-PSO), pagal sinusoidės (kosinusoidės) dės-
29. Chen K., Zhou F., Yin L., Wang S., Wang Y.,
nį greitėjančių koeficientų PSO (SCAC-PSO) ir bė-
Wan F. A hybrid particle swarm optimizer with
sine cosine acceleration coefficients. Information gant laikui kintančio greitėjimo PSO (TVA-PSO).
Sciences. 2018. Vol. 422. P. 218–241. Algoritmų efektyvumas (adekvatumas) testuojamas
30. Ratnaweera A., Halgamuge S. K., Watson H. C., IEEE standarto 33 ir 69 šynų sistemoje. Modeliavimas
Self-organizing hierarchical particle swarm op- atskleidė, kad efektyviausias ir geriausiai tinkantis yra
timizer with time-varying acceleration coeffi- TVA-PSO algoritmas. Saulės elektrinei ir DSTATCOM
cients. IEEE Transactions on Evolutionary Com- parenkama optimali vieta, kas sumažina aktyviosios
putation. 2004. Vol. 8. No. 3. P. 240–255. galios nuostolius ir pakelia įtampos lygį.
Raktažodžiai: energijos valdymo sistema (EMS),
energijos skirstymo sistema (EDS), atsinaujinan-
tys energijos šaltiniai (RES), paskirstyta generacija
(DG), skirstomųjų tinklų statinis kompensatorius
(DSTATCOM), aktyviosios galios nuostolių lygis
(APLL), dalelių spiečiaus optimizacijos algoritmas
(PSO)You can also read