ATTACHMENT 10.1 BUREAU OF METEOROLOGY (BOM): CLIMATE EXTREMES ANALYSIS FOR SOUTH AUSTRALIAN POWER NETWORK OPERATIONS 2014
←
→
Page content transcription
If your browser does not render page correctly, please read the page content below

Attachment 10.1
Bureau of Meteorology (BoM):
Climate extremes analysis for
South Australian Power
Network operations
2014
Climate extremes analysis for South
Australian Power Network operations
Heat, lightning, wind and fire weather trends and variability

Climate extremes analysis for South Australian Power Network operations

 © Commonwealth of Australia 2014

 This work is copyright. Apart from any use as permitted under the Copyright Act 1968, no part may be
 reproduced without prior written permission from the Bureau of Meteorology. Requests and inquiries
 concerning reproduction and rights should be addressed to the Communication Section, Bureau of
 Meteorology, GPO Box 1289, Melbourne 3001. Requests for reproduction of material from the Bureau
 website should be addressed to AMDISS, Bureau of Meteorology, at the same address.

Published by the Bureau of Meteorology
Author- Darren Ray, Senior Climatologist
Climate Services South Australian Region
Bureau of Meteorology

Climate extremes analysis for South Australian Power Network operations

Table of contents

    Executive summary ................................................................................................................ 4
            Introduction .................................................................................................................... 4
            Higher temperatures ...................................................................................................... 4
            Increased fire risk .......................................................................................................... 4
            Thunderstorm and lightning activity ............................................................................... 5
            Vegetation related damage ............................................................................................ 5
    2       Introduction .................................................................................................................... 6
            2.1        The SAPN coverage area. ................................................................................. 6
            2.2        The climate of South Australia and the SAPN coverage area. ............................ 7
            2.3        Major modes of variability influencing South Australia and the SAPN coverage
                       area.................................................................................................................... 8
            2.3.1      El Niño and La Niña events ................................................................................ 8
            2.3.2      Inter-decadal Pacific Oscillation ......................................................................... 9
            2.3.3      Indian Ocean influences..................................................................................... 9
            2.4        Climate trends and change .............................................................................. 10
    3       Temperature extremes ................................................................................................ 12
            3.1   SA agricultural area heat extremes .................................................................. 12
            3.1.1 Numbers of days ADT>32oC ............................................................................ 12
            3.2   SA station temperature extremes ..................................................................... 14
    4       Extremes in fire weather .............................................................................................. 18
            4.1        Frequency of extreme fire weather ................................................................... 19
    5       Lightningand thunderstorm activity across SAPN regions ............................................ 22
            5.1        Lightning detection across SAPN regions......................................................... 23
            5.2        Station thunderstorm and lightning reports ....................................................... 26
            5.3        Influences of major modes of climate variability on thunderstorm and lightning
                       activity .............................................................................................................. 29
    6       Wind events impacting SAPN operations ..................................................................... 33
            6.1   Wind extremes ................................................................................................. 33
            6.2   Extreme heat and impact on tree die off ........................................................... 37
    Glossary ............................................................................................................................... 42
    References ........................................................................................................................... 43

                                                                                                                                               1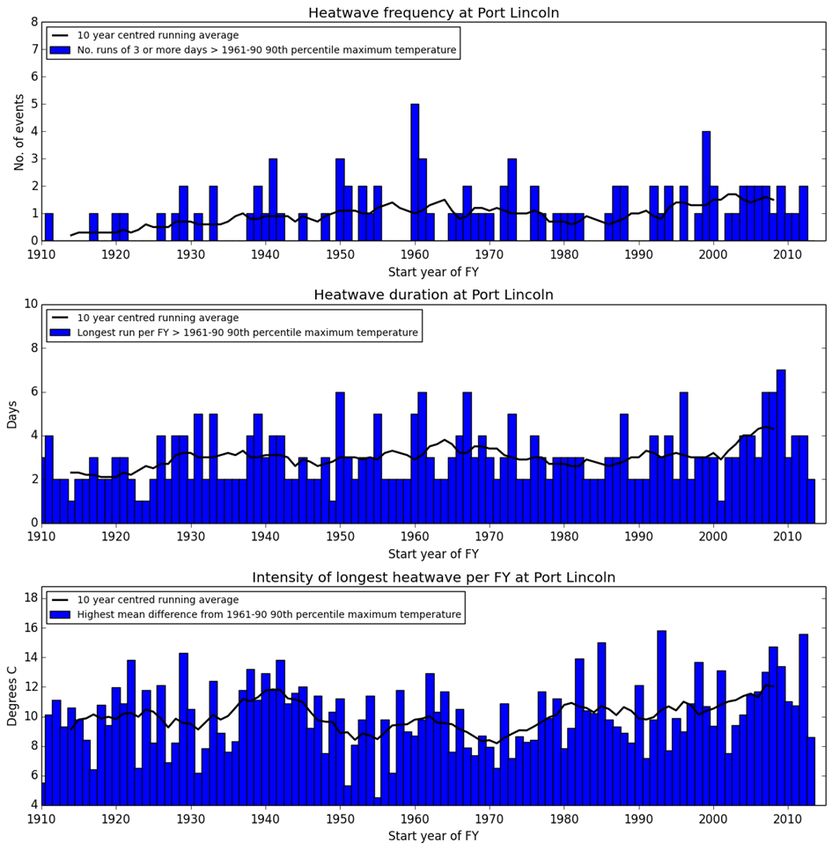
Climate extremes analysis for South Australian Power Network operations

List of Figures
     Figure 2.1-1 SAPN network coverage ........................................................................... 6
     Figure 2.1-2 Annual average rainfall in South Australia (1980 to 2010) ......................... 7
     Figure 2.3-1 Inter-decadal Pacific Oscillation (IPO) ....................................................... 9
     Figure 2.4-1 Trend in annual minimum temperature across South Australia since
     1970 (°C per decade) ................................................................................................... 10
     Figure 2.4-2 Trend in annual maximum temperature across South Australia since
     1970 (°C per decade) ................................................................................................... 10
     Figure 2.4-3 Australian and South Australian agricultural area annual maximum
     temperature anomaly (difference from the 1961-1990 average) .................................... 11
     Figure 2.4-4 Australian and South Australian agricultural area annual minimum
     temperature anomaly                                                (difference from the 1961-1990
     average) ....................................................................................................................... 11
     Figure 3.1-1 Mean FY ADT and numbers of days with ADT>32.5°C each FY for the
     South Australian Agricultural area ................................................................................. 13
     Figure 3.2-1 Mean FY ADT and numbers of days with ADT>32.5°C each FY for
     Ceduna ......................................................................................................................... 15
     Figure 3.2-2 Mean FY ADT and numbers of days with ADT>32.5°C each FY for
     Woomera ...................................................................................................................... 15
     Figure 3.2-3 Mean FY ADT and numbers of days with ADT>32.5°C each FY for
     Cleve ............................................................................................................................ 15
     Figure 3.2-4 Mean FY ADT and numbers of days with ADT>32.5°C each FY for
     Eudunda ....................................................................................................................... 16
     Figure 3.2-5 Mean FY ADT and numbers of days with ADT>32.5°C each FY for
     Maitland ........................................................................................................................ 16
     Figure 3.2-6 Mean FY ADT and numbers of days with ADT>32.5°C each FY for
     Adelaide Airport ............................................................................................................ 16
     Figure 3.2-7 Mean FY ADT and numbers of days with ADT>32.5°C each FY for
     Loxton ........................................................................................................................... 17
     Figure 3.2-8 Mean FY ADT and numbers of days with ADT>32.5°C each FY for
     Lameroo ....................................................................................................................... 17
     Figure 3.2-9 Mean FY ADT and numbers of days with ADT>32.5°C each FY for
     Mount Gambier ............................................................................................................. 17

                                                                                                                                    2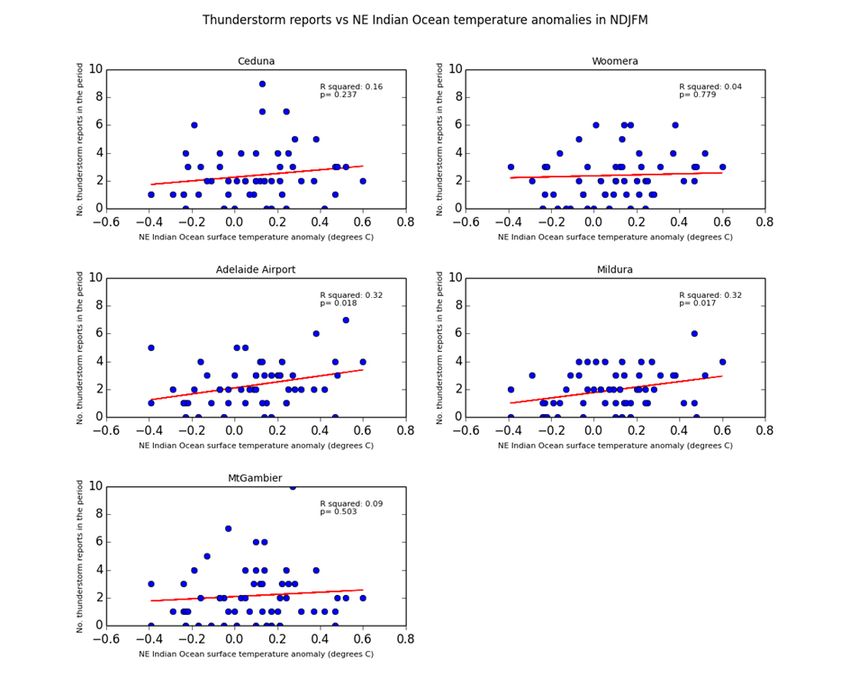
Climate extremes analysis for South Australian Power Network operations

Figure 4.1-1 Number of hours per summer with FFDI >50 for Mount Crawford in the
Adelaide Hills ................................................................................................................ 19
Figure 4.1-2 Number of hours per summer with FFDI >50 for Nuriootpa in the
Barossa Valley .............................................................................................................. 20
Figure 4.1-3 Number of hours per summer with FFDI >50 for Adelaide Airport ............. 20
Figure 4.1-4 Number of hours per summer with FFDI >50 for Port Lincoln Airport ........ 20
Figure 5.1-1 Regions used for lightning strike analysis across SAPN coverage area .... 23
Figure 5.1-2 Numbers of lightning strikes per FY across each regions A to D ............... 24
Figure 5.1-3 Numbers of lightning strikes per FY across each regions E to G ............... 25
Figure 5.2-1 FY numbers of lightning strikes and thunderstorm reports near Ceduna ... 27
Figure 5.2-2 FY numbers of lightning strikes and thunderstorm reports near Woomera 27
Figure 5.2-3 FY numbers of lightning strikes and thunderstorm reports near Adelaide
Airport ........................................................................................................................... 28
Figure 5.2-4 FY numbers of lightning strikes and thunderstorm reports near Mildura .... 28
Figure 5.2-5 FY numbers of lightning strikes and thunderstorm reports near Mount
Gambier ........................................................................................................................ 28
Figure 5.3-1 Numbers of thunderstorm reports for SA and Mildura stations compared
with IOD phase for July to October ............................................................................... 31
Figure 5.3-2 For November to March, numbers of thunderstorm reports for SA and
Mildura stations compared with temperature anomalies in the NE Indian Ocean .......... 32
Figure 6.1-1 Maximum recorded wind gust per FY for Adelaide Hills stations
(month of occurrence is shown over the bar plot) .......................................................... 34
Figure 6.1-2 Maximum daily wind run per FY for Adelaide Hills stations ....................... 35
Figure 6.1-3 Maximum daily wind run per FY for Adelaide Airport
(month of occurrence is shown over the bar plot) .......................................................... 36
Figure 6.1-4 Maximum recorded wind gust per FY for Adelaide Airport
(month of occurrence is shown over the bar plot) .......................................................... 36
Figure 6.2-1 Heat event frequency, duration and intensity per FY for Adelaide ............. 38
Figure 6.2-2 Heat event frequency, duration and intensity per FY for Nuriootpa ........... 39
Figure 6.2-3 Heat event frequency, duration and intensity per FY for Port Lincoln ........ 40

                                                                                                                                3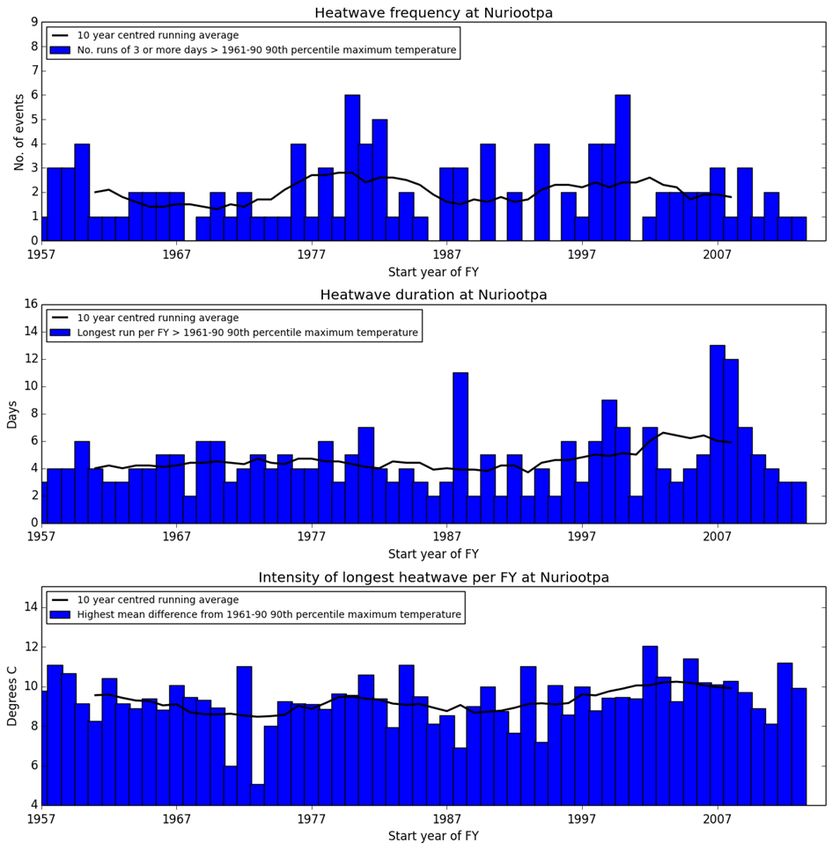
Climate extremes analysis for South Australian Power Network operations

Executive summary

 Introduction
 This report analyses trends and variability of climate and weather parameters known to
 impact South Australia Power Networks (SAPN) operations, and examines possible
 connections with major modes of climate variability that influence the South Australian
 climate.

 Some analysis is conducted across the South Australian agricultural area which covers all of
 the SAPN coverage area apart from the northern branches up to Woomera and Hawker.
 Area averaged data is available for the South Australian agricultural area that provides
 insight that station data cannot.

 Higher temperatures
 Analysis across the South Australian agricultural area as a whole, and at individual weather
 stations, clearly indicate a warming trend in the last few decades of about 1°C in both
 average daytime and night-time temperatures, consistent with trends observed for Australia.

 Average Daily Temperatures (ADT = ½ (Max temp + Min temp)) greater than 32.5°C are
 known to impact SAPN operations, and the frequency of such events has generally doubled
 since 2000. Many southern areas which have had few, if any, such days prior to the year
 2000, have been experiencing them regularly since then.

 With further temperature rises likely over the next 5 to 10 year timeframe, this trend to
 greater numbers of days with extreme temperatures is likely to continue.

 Increased fire risk
 Along with increasing temperatures, the number of Severe, Extreme or Catastrophic Fire
 Danger Rating days in summer has increased by between 1.7 and 2.5 times since 2000, in
 the Mount Lofty Ranges and at Port Lincoln. This increased fire risk is likely to remain or
 increase further with increased temperatures over the next 5 to 10 year timeframe.

                                                                                                4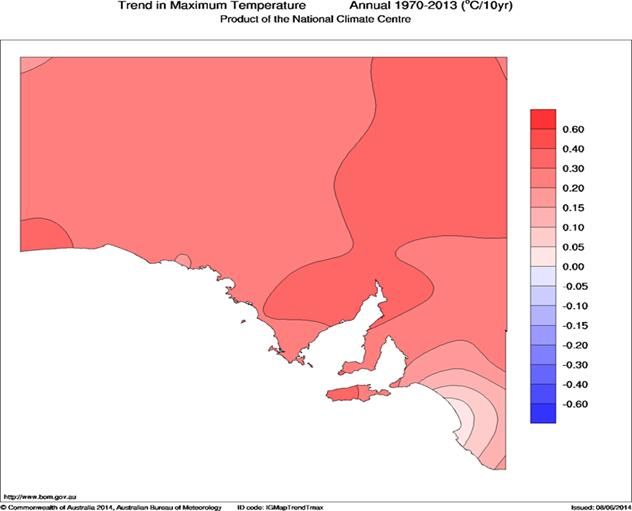
Climate extremes analysis for South Australian Power Network operations

 Thunderstorm and lightning activity
 Thunderstorm and lightning activity has varied significantly across South Australia, with low
 levels of activity prior to the mid-1970’s, much increased activity from then until the late
 1990’s, and somewhat decreased levels since 2000.

 Correlations with the Inter-decadal Pacific Oscillation, a major mode of climate variability,
 suggest increased thunderstorm and lightning activity may occur in the next 10 to 20 year
 timeframe.

 Correlations of thunderstorm activity with Indian Ocean surface temperatures provide some
 predictability of lightning activity on a 3 to 6 month timeframe.

Vegetation related damage
No increase in either sustained wind events or extreme wind gusts is seen in the available
data. It is noted that extreme wind events in the Adelaide region cluster in the period June to
December but more particularly August to October.

A significant increase in the duration of heat events, which is likely to cause heat stress in
trees, has been observed since the late 1990’s. This suggests that when wind events do occur,
the increased heat stress may result in more material being blown around by winds.

                                                                                                  5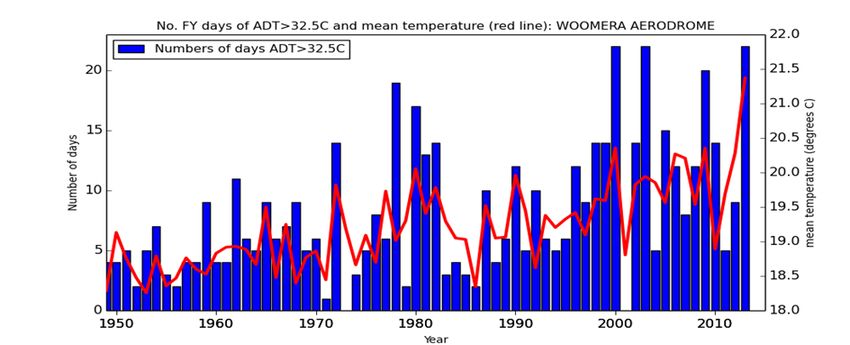
Climate extremes analysis for South Australian Power Network operations

2   Introduction

    This report examines trends and variability of extremes in weather and climate recognised to
    impact operations and the availability of supply within the operational network maintained by
    South Australia Power Networks (SAPN).

    The report includes a general climate summary for the SAPN network coverage area, and
    examination of extremes of temperature, fire weather, wind and lightning activity, looking for
    significant trends, and any variability that can be related to major modes of climate influence
    relevant to the South Australian region.

    A specific focus of the analysis was the potential for SAPN to improve its operational
    preparedness for weather events through the use of the forecast and outlook information
    which results from the analysis. This report aims to highlight the weather events which have
    historically been the most problematic for SAPN.

    2.1 The SAPN coverage area.
    SAPN’s distribution grid supplies the greater metropolitan area, regional population centres
    and areas in which agricultural activities occur and accompanying towns. This area covers
    southern South Australia, which generally receives on average 250 mm or more of rainfall
    annually, much of this in the months from April to October. The SAPN distribution grid also
    extends north along the Flinders Ranges which also has a 250mm average annual rainfall.
    The SAPN coverage area also extends outside of the agricultural areas to the north of Port
    Augusta into the northern pastoral areas of South Australia, covering major regional centres
    such as Woomera and Hawker.

                                        Figure 2.1-1 SAPN network coverage

                                                                                                      6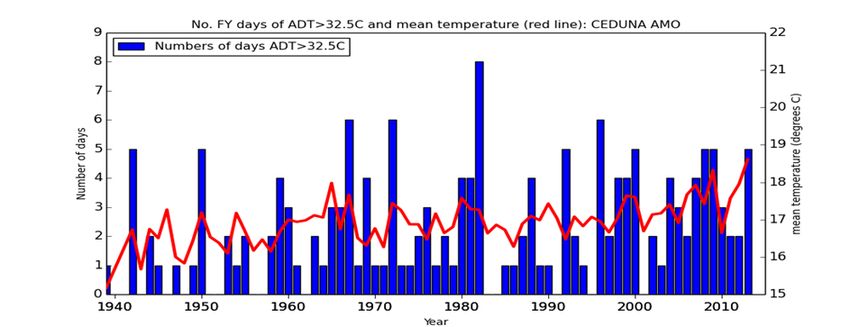
Climate extremes analysis for South Australian Power Network operations

                        Figure 2.1-2 Annual average rainfall in South Australia (1980 to 2010)

2.2 The climate of South Australia and the SAPN coverage area.
The climate of South Australia, particularly southern areas of the state, is generally described
as Mediterranean, meaning the region, being situated in the mid-latitudes, is influenced by
the seasonal variations in the position of the belt of high pressure systems that extend
around the southern hemisphere south of the tropics.

This variation results in the cooler and wetter conditions experienced as the belt of high
pressure moves further north through autumn and winter allowing cold frontal systems to
move up over southern South Australia.This results in higher annual rainfall on average
across southern South Australia (see Fig 2.1-2), with this falling mainly in the April to October
period. Spring sees the belt of high pressure moving southwards with cold frontal systems
beginning to retreat south of the continent, and warmer and drier conditions ensuing.

South Australia experiences major differences in spring and summer climate influences to
other areas that experience Mediterranean style climates, in that there is the maritime
continent to the north of Australia. This area of tropical seas, and the tropical variability in the
region, has a strong influence on moisture feeds available for rainfall across the continent
through spring and summer, and can contribute to significant rainfall events, and associated
thunderstorm and lightning, occurring intermittently through that time of the year.

                                                                                                   7
Climate extremes analysis for South Australian Power Network operations
2.3 Major modes of variability influencing South Australia and the SAPN
coverage area.
Major modes of climate variability such as El Niño and La Niña events and Indian Ocean
influences impact week to week and season to season the resulting rainfall and thunderstorm
activity in spring and summer.
2.3.1 El Niño and La Niña events
El Niño and La Niña events are different phases of patterns of natural variability that occur
across the equatorial Pacific Ocean. The normal pattern across the equatorial Pacific Ocean
is for trade winds blowing from east to west along the equator to push surface water warmed
by the tropical sun towards the western Pacific. Importantly, spring and summer rainfall in
Australia is influenced by the location of warmer surface waters. Where waters are warmer,
evaporation increases and moist air rises higher into the atmosphere as tropical convection
increases.
In El Niño events trade winds weaken allowing warmer water to stay in the central and
eastern Pacific Ocean. This sees cooler than usual water around Australia’s north, resulting
in reduced moisture availability and decreased tropical convection. This reduces rainfall in
spring and early summer across Australia generally, and South Australia also.
La Niña events are the opposite phase seeing stronger than usual trade winds enhancing
warmer than average surface ocean temperatures in the western Pacific increasing
evaporation and tropical convection. This leads to increased spring and summer rainfall
generally across Australia, and South Australia also.
Both El Niño and La Niña events are features of natural climate variability that have been
occurring for thousands of years, and typically start in late winter or spring returning to
neutral conditions in April the following year. The strength of both types of event varies from
event to event and there are variations in the number of El Niño events compared to La Niña
events on a decade to decade basis, both typically occurring on average every 4 to 7 years.
The last moderate to strong El Niño event began in 2006, with the second half of 2010 until
April 2011 seeing the occurrence of one of the strongest La Niña events on record, followed
by another more moderate event in late 2011 to early 2012. Conditions since April 2012 have
been neutral, though there are some indications of weak swings towards El Niño type
conditions since mid-2012.
8Climate extremes analysis for South Australian Power Network operations
2.3.2 Inter-decadal Pacific Oscillation
This is a feature of climate variability across the Pacific Ocean on ~ 20 to 30 year timescales.
The positive phase last seen from the mid-1970’s to the late 1990’s sees warmer waters in
the central and eastern Pacific in a more El Niño like pattern, and the negative phase from
the 1950’s to the mid-1970’s and from the late 1990’s onwards, sees the opposite occurring
with a more La Niña like pattern (Power et al 2006).
Figure 2.3-1 Inter-decadal Pacific Oscillation (IPO)
2.3.3 Indian Ocean influences
The Indian Ocean to the northwest of Australia also experiences patterns of variability similar
in some respects to El Niño and La Niña and with some inter-connections with such events.
A pattern occurs in the tropical Indian Ocean called the Indian Ocean Dipole with this seeing
variation in the locations of warmer water along the tropical Indian Ocean through June to
October. Positive values of the Indian Dipole index indicate warmer surface water near Africa
and cooler water to the northwest of Australia, resulting in reduced evaporation and tropical
convection near Australia, hence resulting in decreased rainfall through June to October.
Negative values indicate the reverse. Outside of June to October the temperature variability
in the oceans to the north-west of Australia in the north-eastern Indian Ocean also can
influence weather patterns and rainfall across South Australia.
9Climate extremes analysis for South Australian Power Network operations
2.4 Climate trends and change
South Australia’s climate is being affected by the significant trends in global and Australian
climate changes.
Much research, as detailed in reports on www.climatechangeinaustralia.gov.au and
summarised in the Bureau of Meteorology ‘State of the Climate’ report (State of the Climate
2014) and the Australian Academy of Science Climate Change report (Australian Academy
of Science 2010), clearly indicate that significant trends in climate are occurring in Australia
and South Australia reflective of similar changes at a global level.
Temperature trends in recent decades within Australia are clear, with an approximately 1°C
increase in temperatures in the last few decades. South Australian temperature trends (Fig
2.4-1 to 2.4-4 ) are consistent with these global and national trends.
Figure 2.4-1 Trend in annual minimum temperature across South Australia since 1970 (°C per decade)
Figure 2.4-2 Trend in annual maximum temperature across South Australia since 1970 (°C per decade)
10Climate extremes analysis for South Australian Power Network operations
Figure 2.4-3 Australian and South Australian agricultural area annual maximum temperature anomaly
(difference from the 1961-1990 average)
Figure 2.4-4 Australian and South Australian agricultural area annual minimum temperature anomaly
(difference from the 1961-1990 average)
While annual and decadal variability is apparent, trends showing an increase in both
maximum and minimum temperatures for Australia and for the South Australian agricultural
area (covering most of the SAPN coverage area), are clear. Trends in extremes related to
these changes in mean conditions will be examined in section 3.
11Climate extremes analysis for South Australian Power Network operations
3 Temperature extremes
Section 2 highlights increased average maximum and minimum temperatures around
Australia and across much of the SAPN coverage area.
Mean daily temperature, or average daily temperature (ADT) is the average of the maximum
and minimum temperature. As might be expected, mean temperature has also increased
over recent decades across Australia.
Days where the maximum temperatures exceed 38°C and the night temperatures stay
warmer than 27°C have been found to increase the risk of transformer failure in SAPN’s
network. A maximum temperature of 38°C and minimum of 27°C results in an ADT of 32.5°C.
Analysis of temperatures across the SA agricultural area, and at individual stations, was
conducted using ADT >32.5°C as a threshold.
All surface air temperature measurements taken by the Bureau of Meteorology since 1910
have been measured in Stevenson screens. This gives a consistent and comparable record
since at least that year. Area averaged temperature calculations such as those used for the
determination of Australian, and South Australian agricultural area temperatures as part of
the Australian Water Availability Project (AWAP) are conducted using an interpolation
method from station observations set out in Jones et al 2009.
Temperature analysis was conducted in most instances using the financial year (FY) July to
June to cover the summer period for each year, when temperature extremes are most
common.
3.1 SA agricultural area heat extremes
3.1.1 Numbers of days ADT>32°C
The South Australian agricultural districts cover most of the SAPN coverage area. Gridded
data derived on a daily basis for this area are produced by interpolation from all available
station data by the Bureau of Meteorology, as part of the AWAP project. Figure 3.1-1 below
shows for each FY, the FY mean of the Average Daily Temperature, as well as the numbers
of days each FY where the ADT exceeded 32.5°C, a threshold to be referred to as “extreme”,
and which SAPN has identified will increase the risk of impacts on its power infrastructure.
First it is apparent that there is a significant increasing trend in ADT for each FY since the
start of the record. This is clearly consistent with broad-scale temperature increases
highlighted in Section 2. Second, this increase in mean temperature is mirrored by an
increase in the number of days where the SA Agricultural districts had as a whole, an ADT in
excess of 32.5°C. Such days were very infrequent before the year 2000. In the 40 year period
up to 2000, there were 8 years when ADT was above 32.5°C.
12Climate extremes analysis for South Australian Power Network operations
Since 2000, 7 out of 14 years have had days when the ADT has exceeded 32.5°C, with
approximately twice as many such days in any one extreme FY compared to the earlier 40
years.
With the close match between the increase in extreme days and the increase in mean
temperature, and the likelihood of temperatures being sustained at this level or higher for the
next 5-10 years, such extreme days as have been observed since 2000 are likely to continue
over this period. Longer term, with climate change projections clearly indicating that a further
~1 to 1.5°C increase in temperatures is likely in the next 20 to 30 years (Climate Change in
Australia 2007), such extreme days are likely to further increase in frequency and severity.
Figure 3.1-1 Mean FY ADT and numbers of days with ADT>32.5°C each FY for the South Australian Agricultural
area
13Climate extremes analysis for South Australian Power Network operations
3.2 SA station temperature extremes
Temperature records for various stations across the SAPN coverage area were analysed for
numbers of days in each FY with ADT>32.5°C. Figures 3.2-1 to 3.2-9 clearly indicate an
increasing trend in numbers of days per FY with ADT >32.5°C. This is consistent with the
trend in mean temperature plotted in the figures. Some of the stations do show some
decadal variability in the numbers of extreme ADT days. The period ~1960 to 1980 sees an
increased number of days of extreme ADT, and a decrease from 1980-2000. All stations then
display a marked increase in numbers of extreme days from 2000. Stations in the hotter
parts of the state, Ceduna, Woomera, Loxton, all experienced days with ADT>32.5°C before
2000 but that number generally increases by 100% or more since 2000. Southern stations
that did not experience many or any extreme ADT days have been experiencing them since
2000.
The periods of variability in extreme ADT days generally correspond to periods when mean
temperatures are higher as well. This suggests that numbers of extreme ADT days are a
result of both the long term increasing trend from climate change, with some decadal
variability overlying this.
14Climate extremes analysis for South Australian Power Network operations
Figure 3.2-1 Mean FY ADT and numbers of days with ADT>32.5°C each FY for Ceduna
Figure 3.2-2 Mean FY ADT and numbers of days with ADT>32.5°C each FY for Woomera
Figure 3.2-3 Mean FY ADT and numbers of days with ADT>32.5°C each FY for Cleve
15Climate extremes analysis for South Australian Power Network operations
Figure 3.2-4 Mean FY ADT and numbers of days with ADT>32.5°C each FY for Eudunda
Figure 3.2-5 Mean FY ADT and numbers of days with ADT>32.5°C each FY for Maitland
Figure 3.2-6 Mean FY ADT and numbers of days with ADT>32.5°C each FY for Adelaide Airport
16Climate extremes analysis for South Australian Power Network operations
Figure 3.2-7 Mean FY ADT and numbers of days with ADT>32.5°C each FY for Loxton
Figure 3.2-8 Mean FY ADT and numbers of days with ADT>32.5°C each FY for Lameroo
Figure 3.2-9 Mean FY ADT and numbers of days with ADT>32.5°C each FY for Mount Gambier
17Climate extremes analysis for South Australian Power Network operations
4 Extremes in fire weather
SAPN’s network operations are impacted by extreme fire weather days, particularly in the
Mount Lofty Ranges. Analysis was conducted to examine trends and variability in the amount
of extreme fire weather in the Mount Lofty Ranges and the Port Lincoln Region.
Fire Danger Index values can be calculated either for grassland conditions, requiring
information on fuel loads and curing to obtain Grassland Fire Danger Index values (GFDI), or
for forest conditions using the MacArthur Forest Fire Danger Index formula (FFDI), requiring
wind speed, air temperature, relative humidity and Drought Factor.
Wind speed, relative humidity and air temperature data is available from Bureau of
Meteorology stations on a half-hourly or hourly basis for many sites going back to the early
1990’s from aviation format observations (METARS). Past fuel load and curing data is
incomplete and hence calculating past values of GFDI values with accuracy prior to the year
2000 would be inaccurate.
For this analysis, summer FFDI values were calculated from half hourly data from METARS
reported from Bureau of Meteorology stations, according to MacArthur FFDI formula:
FFDI= e to the power (n(2)-0.45+(0.987ln(DF))-(0.0345RH)+(0.0338T)+(0.0234V))
Where: DF = Drought Factor (dimensionless number between 0 and 10)
T = air temperature (°C)
V = 10 minute mean wind speed at a 10 metre level (km/h)
RH = relative humidity (%)
To simplify the calculation DF was assumed to be 10, which is a reasonable assumption for
summer conditions, but may result in some overestimation of FFDI. However, as this is
applied consistently across the record, it should not influence trends significantly.
It is recognised that the METAR format utilised by the Bureau of Meteorology has the
limitation of not always recording a 10 minute average wind speed in certain conditions. This
may result in over estimation of FFDI in some conditions, though once again is consistent
across the record so would not significantly impact trends.
Forest Fire Danger Index values in excess of 50 have been examined as a threshold
impacting SAPN’s operations, these values being Severe, Extreme or Catastrophic
according to CFS Fire Danger Ratings.
18Climate extremes analysis for South Australian Power Network operations
4.1 Frequency of extreme fire weather
Figures 4.1-1 to 4.1-4 show summer time FFDI for all available METAR observations for
stations with longer lengths of record in the Adelaide region, including the Adelaide Hills and
Barossa Valley, as well as from the site at Port Lincoln aerodrome.
There is no clear correlation with major climate influences observed in the variation year to
year of the number of Severe or higher FFDI values, but all sites show a significant increase
in numbers of hours of FFDI >50 each summer from 2000 onwards, with very high numbers
for weather stations in the Adelaide region in the last 2 years. This general increase in
Severe or higher FFDI is consistent with background warming trends noted in Sections 2 and
3, with numbers of hours of FFDI>50 from year 2000 onwards being 1.7 to 2.5 times the
values prior to 2000 (Table 4.1-1) and in the last 2 years the numbers of hours are 2 to 3
times higher again.
Figure 4.1-1 Number of hours per summer with FFDI >50 for Mount Crawford in the Adelaide Hills
19Climate extremes analysis for South Australian Power Network operations
Figure 4.1-2 Number of hours per summer with FFDI >50 for Nuriootpa in the Barossa Valley
Figure 4.1-3 Number of hours per summer with FFDI >50 for Adelaide Airport
Figure 4.1-4 Number of hours per summer with FFDI >50 for Port Lincoln Airport
20Climate extremes analysis for South Australian Power Network operations
pre 2000 post 2000
hours of hours
FFDI>50 per FFDI>50
Station DJF per DJF x change
ADELAIDE AIRPORT 8.1 20.0 2.5
MT CRAWFORD AWS 8.2 14.1 1.7
NURIOOTPA
VITICULTURAL 9.0 20.2 2.2
PORT LINCOLN AWS 12.4 21.1 1.7
Table 4.1-1 Average numbers of hours per summer of FFDI>50 pre and post 2000
In looking for significant trends in the figures above, the relatively short length of the record
must be taken into account. However the increasing trend in FFDI values is clear, and
extends through the longer record available at Adelaide Airport. These trends are also
consistent with other work looking at trends in Australian fire weather such as Clarke, Lucas
and Smith (2012), who found significant positive trends in accumulated FFDI and FFDI
extremes across southern Australia.
As there has not been a significant change in wind events in recent decades (further
discussed in Section 6) recent increases in FFDI are likely to be strongly driven by the
significant temperature increases seen in Sections 2 and 3. With temperatures expected to
continue to at least maintain recent levels or increase over the next 5 to 10 years it is
expected that the increased levels of fire weather risk observed since 2000 will continue.
21Climate extremes analysis for South Australian Power Network operations
5 Lightning and thunderstorm activity across SAPN regions
With power lines often the most elevated object in rural areas of South Australia, power line
outages due to lightning strikes are of interest to SAPN network operations.
Records of lightning and thunderstorm activity are subject to some limitations. The
technology for detecting lightning strikes is a relatively recent development, with its
deployment in Australia on a widespread basis commencing in late 1999, and in some
regions numbers of detectors was insufficient to provide accurate coverage until the
mid- 2000’s. Prior to 1999 the only reliable indication of lightning and thunderstorm activity is
from manual observations.
For this analysis, manual thunderstorm observations from South Australian Bureau of
Meteorology Meteorological Offices in Woomera, Ceduna, Adelaide Airport and Mount
Gambier were used. Also, as Mildura is just across the South Australian border its
observations were also used to give an indication of thunderstorm activity in the Riverland
region.
Manual observations are available since the early to mid-1950’s at synoptic hour periods
( every 3 hours). The completeness of the 3 hourly observations across a day has varied
through time. Since 2010 Woomera, Ceduna, Mount Gambier and Mildura have moved to an
observation program that has less complete observations on weekends. Taking these factors
into account, it was decided that the manual observations from 0600 hours to 1500 hours
synoptic observations, which are available consistently from 1955 at all of the above stations
until 2010, would be used.
All available lightning detection data has been utilised, covering the FY periods beginning in
July 2000 to the FY ending June 2013. Because of the sparse lightning detection network
coverage within South Australia prior to ~2004, lightning detection data prior to that period
must be viewed with caution. However this data has been utilised to allow maximum overlap
with available manual observations.
22Climate extremes analysis for South Australian Power Network operations
5.1 Lightning detection across SAPN regions
In consultation with SAPN, several regions were set to examine numbers of strikes per FY,
as per the map below:
Figure 5.1-1 Regions used for lightning strike analysis across SAPN coverage area
23Climate extremes analysis for South Australian Power Network operations
Figure 5.1-2 Numbers of lightning strikes per FY across each regions A to D
24Climate extremes analysis for South Australian Power Network operations
Figure 5.1-3 Numbers of lightning strikes per FY across each regions E to G
25Climate extremes analysis for South Australian Power Network operations
5.2 Station thunderstorm and lightning reports
To explore trends in thunderstorm and lightning activity across South Australia all
thunderstorm reports (observations conducted by Bureau of Meteorology observing staff plus
present and past weather codes >90) were summed for synoptic observations for 0600 to
1500 hours local time. This time period was used as this gave the most consistent set of
observations across the available manual observation record.
The number of lightning detection system strikes was summed for each FY for all ground
strikes within a radius of 25km of the weather station. This is the radius within which
thunderstorm activity would be heard, and lightning activity observed. This was done to
provide an indication of thunderstorm activity prior to the start of the lightning detection
system record, and allow comparison between the lightning detection observations and the
longer manual thunderstorm observations.
Figures 5.2-1 to 5.2-5 below show sums of manual observations and close lightning strikes
for weather stations across South Australia providing observations relevant to the SAPN
coverage area. Mildura was also included as explained earlier.
The correlation between lightning strike numbers and manual thunderstorm reports in
general is good, suggesting that the manual thunderstorm observation provides a useful
indication of thunderstorm and lightning activity as far back as 1955.
There is significant decadal variability in thunderstorm activity, with relatively lower levels
from the 1950’s, a significant increase during the 1970’s which persists until ~2000, and a
significant decrease in thunderstorm activity after 2000, though higher than the 1950’s to
1970’s. Numbers of lightning detection system reports do show higher numbers of strikes in
the last few years both in close vicinity to stations, and across regions, as seen in Figures
4.1.1 and 4.1.2. Comparing these to the numbers of thunderstorm reports for the period
suggests that there may have been levels of thunderstorm activity and hence likely increased
lightning activity at least comparable to, if not exceeding, numbers in recent years in the
period from the 1970’s into the 1990’s. The exception to this is seen at Mildura where levels
in recent years are as high as any earlier period indicating that perhaps lightning activity in
the Riverland area may be as high as at any previous time.
26Climate extremes analysis for South Australian Power Network operations
Figure 5.2-1 FY numbers of lightning strikes and thunderstorm reports near Ceduna
Figure 5.2-2 FY numbers of lightning strikes and thunderstorm reports near Woomera
27Climate extremes analysis for South Australian Power Network operations
Figure 5.2-3 FY numbers of lightning strikes and thunderstorm reports near Adelaide Airport
Figure 5.2-4 FY numbers of lightning strikes and thunderstorm reports near Mildura
Figure 5.2-5 FY numbers of lightning strikes and thunderstorm reports near Mount Gambier
28Climate extremes analysis for South Australian Power Network operations
5.3 Influences of major modes of climate variability on thunderstorm and
lightning activity
Section 5.2 above discusses significant decadal variability in thunderstorm reports across
stations in the analysis. It is not immediately clear what is underlying the decadal variability
observed across these stations. Every effort has been made to ensure this variation in
numbers of observed thunderstorm activity is not due to any changes in Bureau of
Meteorology observing practice and variations in the observational program. Decadal
variability over the same periods observed in other meteorological parameters such as
surface temperature as seen in Fig 3.1-1 and 2.4-3 and 2.4-4 suggests this is a real
phenomenon, with some underlying meteorological or broad-scale climatic influence.
It is of interest to note that the periods of lower thunderstorm activity (1950’s to mid-1970’s
and ~2000’s onwards) correspond to periods of negative Inter-decadal Pacific Oscillation
(IPO) values, with increased numbers of thunderstorm reports occurring during a period of
positive IPO values from the mid-1970’s to 2000. The IPO is a broad-scale feature of
variability in the Pacific Ocean that influences ocean temperature patterns across the Pacific
Ocean and around northern Australia on a roughly 30 year cycle. Research on the IPO has
established connections with variability in El Niño / La Niña events and correlations with
temperatures across Australia (Power et al 2005). While the mechanism and variability of the
IPO is still an area of ongoing research, if phases of the IPO are the underlying cause of the
observed thunderstorm variability, it suggests a significant increase in thunderstorm and
lightning activity may be anticipated in ~10 to 20 years with a shift back into the positive IPO
phase.
Section 5.1 shows a significant increase observed in lightning strike reports from ~2004
across all regions, particularly for the western and central regions, A and B. This is likely due
to increased sensor deployment at that time increasing numbers of recorded lightning strikes.
The years with highest numbers of strikes across most regions are 2012/13 and 2006/07,
with the latter an El Niño year and the former a year of weak El Niño like features. While this
might suggest some correspondence between El Niño events and lightning activity, 2002,
another El Niño year saw lower strike rates, and 2010/11, a very strong La Niña event is one
of the higher years in the short record.
Correlations with climate influences on a year to year basis such as El Niño /La Niña
variability and variability in the Indian Ocean to the northwest of Australia were examined
with respect to the longer thunderstorm observation record.
No significant correlation was found between El Niño / La Niña variability as indicated by
ocean temperature anomalies in what is known as the Niño 3.4 region in the central Pacific.
Positive temperature anomalies in this area greater than 0.8°Cindicate El Niño conditions,
and negative anomalies greater than 0.8°Cindicate La Niña conditions.
29Climate extremes analysis for South Australian Power Network operations
Neither numbers of thunderstorm reports across stations, or numbers of detected lightning
strikes across spring and summer show any strong correlation with Niño 3.4 temperature
anomalies. This is somewhat disappointing as El Niño and La Niña variability is the most
predictable of climate influences, and a significant correlation with El Niño/ La Niña variability
would provide some ability to forecast levels of lightning activity up to 9 months ahead.
To examine possible Indian Ocean influences, north-eastern (NE) Indian Ocean temperature
anomalies to the northwest of Australia were correlated with both lightning and thunderstorm
activity across the seasons July to October (JASO), and November to March (NDJFM). No
strong correlation was found between station thunderstorm reports and NE Indian Ocean
temperatures in JASO, though a slight –ve correlation with some significance can be seen at
Woomera. Correlations with Indian Ocean Dipole events are slightly stronger and more
significant for all stations apart from Mount Gambier (see Fig 5.3-1 below).
For the NDJFM period, all stations show positive correlation with NE Indian Ocean
temperature anomalies to the NW of Australia with numbers of thunderstorm reports, though
the correlations are either weak or not significant except at Mildura and Adelaide Airport (Fig
5.3-2 below).
The ability to forecast the phase of the Indian Ocean Dipole and ocean temperature
anomalies in the Indian Ocean several months in advance with ocean forecasting systems
such as the Bureau of Meteorology’s POAMA model, and the correlations above may supply
some predictive capacity of levels of lightning activity across SAPN network regions.
Forecasts of a positive phase of the Indian Ocean Dipole suggest a higher risk of increased
lightning activity across central and northern areas for July to October, while warmer oceans
in the NE Indian Ocean also suggest an increased risk of lightning activity for the November
to March period across the central districts of South Australia.
30Climate extremes analysis for South Australian Power Network operations
Figure 5.3-1 Numbers of thunderstorm reports for SA and Mildura stations compared with IOD phase for July to
October
31Climate extremes analysis for South Australian Power Network operations
Figure 5.3-2 For November to March, numbers of thunderstorm reports for SA and Mildura stations compared
with temperature anomalies in the NE Indian Ocean
32Climate extremes analysis for South Australian Power Network operations
6 Wind events impacting SAPN operations
SAPN networks can be impacted by wind events, either sustained periods of strong winds or
severe wind gusts, blowing material from trees onto power lines causing shorting and loss of
power. This is particularly relevant for the Adelaide metropolitan area and Mount Lofty
Ranges.
This section examines available wind data in the Adelaide and Mount Lofty Ranges area for
trends and variability that might impact the frequency of events that would impact the SAPN
network. It’s important to note that the available wind data records are relatively short in
comparison to other weather parameters such as rainfall and temperature.
Research related to climate change has examined the impact of a changing climate on tree
health. Events in which material from trees is blown onto power lines may be made worse by
heat stress in trees under warming conditions. With this in mind, trends in heat extremes are
also examined.
6.1 Wind extremes
Wind run is the accumulation of wind speeds through a 24 hour period at a location. Wind
run records are typically available from Bureau of Meteorology automatic weather stations
from the 1990’s. Adelaide Airport has a longer record using earlier wind run measurement
apparatus, and while not ideally placed to represent Adelaide Hills wind patterns, has a
significantly longer record than other stations.
Maximum wind gusts are reported as the maximum 1 second wind speed recorded in any 10
minute period at a location.
The analysis in figures 6.1-1 to 6.1-4 show the highest daily wind run and the maximum wind
gust recorded across each FY, with the month in which it occurred plotted over the top. The
records for the Mount Lofty Ranges stations are not long enough to highlight any trend. The
Adelaide Airport site has a significant step change in variability from the late 1980’s but
examination of station records indicate this is likely due to a change in the type of recording
instrument at that time rather than any change in wind extremes.
The lack of significant trends in wind speeds is consistent with analysis done for the periods
1948-2006 by Troccoli et al 2012.
33Climate extremes analysis for South Australian Power Network operations
Figure 6.1-1 Maximum recorded wind gust per FY for Adelaide Hills stations
(month of occurrence is shown over the bar plot)
34Climate extremes analysis for South Australian Power Network operations
Figure 6.1-2 Maximum daily wind run per FY for Adelaide Hills stations
35Climate extremes analysis for South Australian Power Network operations
Figure 6.1-3 Maximum daily wind run per FY for Adelaide Airport
(month of occurrence is shown over the bar plot)
Figure 6.1-4 Maximum recorded wind gust per FY for Adelaide Airport
(month of occurrence is shown over the bar plot)
36Climate extremes analysis for South Australian Power Network operations
It is noteworthy that most extreme winds occur in the months June to October, with strong
clustering around August to October.
Taking the change in instrument at Adelaide Airport into consideration maximum wind gusts
still decline at that site from the late 1980’s onwards. Wind records at Adelaide Hills weather
stations are too short to support this.
Highest daily wind run for any FY as seen in Figure 6.1-2 and 6.1-3 show an increase in
variability from about 2005, though records are too short to establish if this is significant or
not.
In summary there is no indication of any increase in extreme wind events either in wind gusts
or wind run measurements from any station in the analysis, with if anything a slight decline
occurring.
6.2 Extreme heat and impact on tree die off
The contribution of climate change to tree die off has been a subject of recent research. The
Millennium Drought from 1996 -2009 saw large areas of tree die off occurring in parts of
southern Australia in response to hot and drier conditions. Mitchell et al 2014 examined
climatic thresholds impacting trees, establishing that periods of 3 days above the 90th
percentile maximum temperature as being a necessary condition for tree die off episodes.
With increases in temperature and heat extremes in recent decades demonstrated, as seen
in Sections 2 and 3 of this report, further analysis was done of temperature records in the
Adelaide and Port Lincoln area using the criteria of Mitchell et al 2014 to seek to identify any
significant trends or variability.
The Bureau of Meteorology’s Australian Climate Observations Reference Network – Surface
Air Temperature data is a dataset using station data from long term sites that has been
checked for inhomogeneities from instrument or site changes that might cause spurious
trends in temperatures ( see http://www.bom.gov.au/climate/change/acorn-sat/)
Daily maximum temperatures from the Bureau of Meteorology’s ACORN-SAT dataset were
analysed for frequency of such events (3 days or more > 90th percentile maximum
temperatures), duration (longest consecutive run per FY of days >90th percentile maximum
temperature), and a measure of intensity of these heat extremes (the difference from the 90th
percentile maximum temperature averaged across the longest run in any FY). Figures 6.2-1
to 6.2-3 below show results for Adelaide Airport, Nuriootpa and Port Adelaide.
37Climate extremes analysis for South Australian Power Network operations
Figure 6.2-1 Heat event frequency, duration and intensity per FY for Adelaide
38Climate extremes analysis for South Australian Power Network operations
Figure 6.2-2 Heat event frequency, duration and intensity per FY for Nuriootpa
39Climate extremes analysis for South Australian Power Network operations
Figure 6.2-3 Heat event frequency, duration and intensity per FY for Port Lincoln
40Climate extremes analysis for South Australian Power Network operations
The frequency of heat extremes, seen above, shows some correlation with
Interdecadal Pacific Oscillation (IPO) phase, as did mean temperature and FFDI, as
seen in Sections 3 and 4. Increased heat event frequency is seen through the mid
1970’s to the late 1990’s at all sites matching the positive phase of the IPO, with a
subsequent decrease in frequency in the 2000’s on in the negative IPO phase.
All sites show relatively stable levels of heat event duration up until ~1990, when heat
event duration increases significantly, though the most recent years see events of
lesser duration. The intensity of the longest heat event in any FY is relatively stable
through the record at Adelaide and Nuriootpa, with an increasing trend since ~1980 at
Port Lincoln.
From the above, while there is no indication of increases in extreme wind events in
areas relevant for SAPN power lines, there appears to be an increase since the late
1990’s in the duration of heat events that might impact tree die off, so that when wind
events do occur prior hot conditions may have led to increased heat stress of trees and
lead to more material being available to be blown onto power lines. Further detailed
analysis is beyond the scope of this report but warrants further investigation.
41Climate extremes analysis for South Australian Power Network operations
Glossary
Australian Climate Observations Reference Network – Surface Air
ACORN-SAT
Temperature
AWAP Australian Water Availability Program
SAPN South Australian Power Networks
FFDI Forest Fire Danger Index
IOD Indian Ocean Dipole
ENSO El Niño Southern Oscillation
IPO Interdecadal Pacific Oscillation
An aviation weather observing format used by the Bureau of
METAR
Meteorology
SA South Australia
JASO July August September October
NDJFM November December January February March
FY Financial Year (ie July to June )
Average Daily Temperature (the average of the maximum and
ADT
minimum temperature on any day)
AMO Aerodrome Meteorological Office
POAMA Predictive Ocean Atmosphere Model for Australia
NE North east
SOI Southern Oscillation Index
42Climate extremes analysis for South Australian Power Network operations
References
Australian Academy of Science (2010) The science of climate change
http://www.science.org.au/publications/science-climate-change-questions-and-answers
Clarke H, Lucas, C and Smith P. (2012). Changes in Australian fire weather between 1973 and 2010.
International Journal of Climatology DOI:10.1002/joc.3480
http://images.smh.com.au/file/2013/09/14/4747251/fires1973.pdf
CSIRO and Bureau of Meteorology (2007). Climate Change in Australia, Technical Report, Australia.
Mitchell P, O’Grady A, Hayes K, Pinkard E (2014) Ecology and Evolution 4 (7) 1088-1101
http://onlinelibrary.wiley.com/doi/10.1002/ece3.1008/pdf
Power et al (1999) Climate Dynamics 15, 319–324
http://link.springer.com/journal/382/15/5/page/1
State of the Climate (2014). Bureau of Meteorology http://www.bom.gov.au/state-of-the-climate/
Troccoli A., Muller K., Coppin P., Davy R., Russell C. & Hirsch, A. (2012). Long-Term Wind Speed
Trends over Australia. Journal of Climate, 25, 170-183.
http://journals.ametsoc.org/doi/full/10.1175/2011JCLI4198.1
43You can also read