Data-Driven Analysis of Cellular Network Resilience in the Netherlands
←
→
Page content transcription
If your browser does not render page correctly, please read the page content below

Data-Driven Analysis of Cellular Network Resilience in
                       the Netherlands
                                                                    Dylan D. Janssen
                                                                 University of Twente
                                                           P.O. Box 217, 7500AE Enschede
                                                                   The Netherlands
                                                       d.d.janssen@student.utwente.nl

ABSTRACT                                                                             than normally. Therefore, it is important to understand
The importance of analysing the resilience of a mobile                               the resilience of mobile networks because almost everyone
cellular network has increased, since almost everyone in                             is depending on a functioning network even in hard times.
the world uses the mobile cellular network. This paper                               But how can the resiliency of a network be determined?
evaluates the resilience of cellular networks in the Nether-                         Previous studies provide multiple definitions of resilience.
lands using a crowd-sourced data set, i.e. OpenCellId. We                            For instance, Alliance et al. [3] define resilience as “the
perform a literature survey to determine which resilience                            capability of the network to recover from failures”, while
metrics can be used for mobile cellular network and also                             Liu et al. [7] defined it as “the percentage of lost traffic
the potential risks for a mobile cellular network. A sim-                            upon failures” and Sternbenz et al. [17] defined it as “the
ulator created by us uses an OpenCellId data set of base                             ability of the network to provide and maintain an accept-
stations to simulate the potential risks and evaluate the                            able level of service”. According to [16] and [17] the goal
resilience of the mobile cellular network in cities of the                           of resilience is that the system continues to work accord-
Netherlands. The analysis shows that Amsterdam is the                                ing to the user’s expectations regardless of changes that
most resilient city in the Netherlands against natural dis-                          may themselves be hidden away. The resilience of mobile
asters. On the other hand, Middelburg is the least re-                               cellular networks must be acceptable to provide service to
silient against natural disasters, since its number of base                          users. Since emergency services also use mobile networks,
stations in Middelburg is significantly lower than in Ams-                           public safety will decrease when the resilience of mobile
terdam. Moreover the area of Amsterdam is significantly                              networks is not acceptable.
larger than Middelburg, so the simulated natural disaster                            The goal of this research is to evaluate how resilient the
would not cover Amsterdam completely while Middelburg                                mobile cellular network is in the Netherlands. If certain
is completely covered. Malicious attacks do not have a                               cities in the Netherlands do not have an acceptable level of
large impact on the cities of the Netherlands. All cities                            resilience, then a more in-depth analysis of the networks
have an acceptable level of resilience for the network dur-                          in these cities should be performed.
ing a malicious attack. When increasing the requested
data rate, Middelburg performed the best of all the cities                           RQ1. What metrics are used in the literature to measure
and Rotterdam the worst. Since there are significantly                                    the resilience of a cellular network?
more users connected to the base stations in Rotterdam
than in Middelburg, the increasing requested data rate has                           RQ2. What are the potential risks for the resilience of cel-
more effect on the resilience of the network. This can also                               lular networks?
conclude that there is a relation between connected users
to base stations and the satisfaction level.                                         RQ3. Are all cities in the Netherlands equally resilient or
                                                                                          are there differences in the resiliency of certain cities
                                                                                          in the Netherlands?
Keywords
Mobile network, Cellular network, Resilience                                         To address the above-listed questions, we first conduct a
                                                                                     literature survey on the resilience metrics and potential
1.     INTRODUCTION                                                                  risks. As we do not have access to the information of
Almost everyone in the world uses mobile cellular networks                           cellular operators’ infrastructure, we will use a OpenCel-
for everyday activities, e.g. phone call and web browsing.                           lId [18] data set which records the location of cell towers
However, it is possible for a base station (BS) to partially                         across the world. Then we will consider major cities in
drop out of the network. A possible reason for this is that                          the Netherlands and evaluate the resilience of the cellular
the BS is damaged due to a disaster, malicious attack or                             networks in each city under increasing level of risks such
deprecated parts. This could result in a less functional                             as disaster radius.
network and users would receive a lower quality of service                           The rest of the paper is organized as follows. Section 2 dis-
                                                                                     cusses the related works on this topic. Section 3 overviews
Permission to make digital or hard copies of all or part of this work for
                                                                                     the literature survey of the resilience metrics. Section 4
personal or classroom use is granted without fee provided that copies
are not made or distributed for profit or commercial advantage and that              determines the literature survey of the potential risks. Sec-
copies bear this notice and the full citation on the first page. To copy oth-        tion 5 will provide the methodology. Section 6 analyses the
erwise, or republish, to post on servers or to redistribute to lists, requires       performance of the considered system. Section discusses
prior specific permission and/or a fee.                                              the shortcoming of this research. Finally, Section 8 con-
35th Twente Student Conference on IT July 2nd , 2021, Enschede, The                  cludes the results of the performance analysis.
Netherlands.
Copyright 2021, University of Twente, Faculty of Electrical Engineer-
ing, Mathematics and Computer Science.

                                                                                 1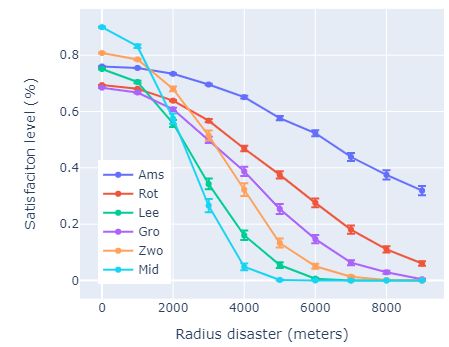
2.    RELATED WORK                                                          ing to Kamola et al. [6] QoS is part of the trustwor-
This section will discuss the related works on this topic.                  thiness of the resilience of a network.
Sterbenz et al. [17] introduced a resilience strategy called              • Isolated Users:
D2 R2 +DR, in which D2 R2 stands for Defend, Detect, Re-
mediate and Recover while DR stands for Diagnose and                        The number of isolated users is used as a resilience
Refine. Additionally, they also introduce a Resilience state                metric in Malandrino et al. [9]. The isolated users
space diagram. Lummen et al. [8] research the resilience                    are the number of users that do not have any connec-
between nodes and edges of a network using the defini-                      tion to a BS at all. This metric could give insights
tion of resilient and state-space diagram of Sterbenz et al.                on how many users will not have any service in the
[17]. Lummen et al. [8] defined resilience metrics such                     area where a potential risk occurred.
as clustering coefficient and number of connected compo-                    Also, the average number of users connected to a
nents. By performing multiple simulations the conclusion                    base station can be used as a resilience metric. This
is that the link placements between nodes are very impor-                   will provide similar results as the number of isolated
tant for having an acceptable level of service. However,                    users since the number of isolated users increases
the research did not include the resilience of wireless net-                when the average number of users connected to a
works, this research will on the other hand include the                     base station will decrease. But this metric will give
resilience of wireless networks. Labib et al. [10] analysed                 insights on how dense the number of BS are in a city.
and enhanced the resilience of LTE and LTE-A System to
RF Spoofing. They proposed multiple changes to the LTE                    • SNR:
system to make it more resilient. This research will not
consider RF Spoofing in particular on the LTE system but                    The Signal-to-Noise ratio (SNR) can be used as a
will consider malicious attacks in general that can damage                  resilience metric. The SNR is a ratio for the signal
the cellular network. Kamola et al. [6] analysed network                    strength to signal noise [19]. The SNR shows how
resilience on a country-level. The authors determine the                    far users are located and how well the signal reaches
term resilience as the vulnerability of a network of au-                    the user. Together with the assigned bandwidth, the
tonomous systems located in a single country to link or                     data rate can be calculated. The SNR can on the
node failures. They conclude that there are noticeable ef-                  other hand show different results since SNR will give
fects on the resilience only when large areas are affected                  information on how close the user is to the BS and
(800 meters or more). Kamola et al. [6] research is dif-                    the data rate only shows how much the data can be
ferent from this study, since they analyse the resilience on                sent to the user.
a link and node level while this research focuses on the
resilience of wireless cellular networks.                            4.    POTENTIAL RISKS
Dobson et al. [4] focus on the self-organization and re-             It is important that potential risks are determined to eval-
silience for networked systems. The self-organized system            uate the resilience of a mobile cellular network. When a
can optimize or manage itself and does not need any hu-              potential risk occurs this can lead to errors which can ex-
man interaction. The resilience of the self-organized sys-           tend to multiple failures of the complete system. Çetinkaya
tems will increase because the system will optimize itself           et al. [20] divide potential risks in seven categories: large-
even in challenging situations. The authors did not deter-           scale disasters, socio-political and economic risks, depen-
mine resilience metrics, but proposed multiple ways that             dent failures, human errors, malicious attacks, unusual but
could improve the resilience of the system. The authors              legitimate traffic and environmental risks. Using the po-
concluded that the self-organization properties can help             tential risks, we determined different potential risks for a
with the level of service, but human behaviour should be             mobile cellular network, natural disaster, natural disasters
taken into account when designing a resilient system. In             with a power outage, malicious attacks and socio-political
this work, we will also consider self-organization by allo-          risks and other risks.
cating bandwidths to the user in case of failures. Ahmadi
et al. [2] researched the resilience of airborne networks.                • Natural disaster:
They use the definition of [17] as the resilience metric.
The authors concluded that machine learning and block-                      A natural disaster such as earthquakes, floods and
chain techniques might be able to improve the resilience                    wildfires are a potential risk for a mobile cellular net-
of airborne networks. The work in [2] is different from this                work. A natural disaster can also occur when there
research because they investigate the resilience of airborne                are dependent failures, which can cascade through
networks while this research will focus on a terrestrial cel-               the network and affect multiple BSs. The natural
lular network.                                                              disaster has a big impact on the base stations around
                                                                            the epicentre of the disaster. The BS closest to the
3.    RESILIENCE METRICS                                                    epicentre will be more damaged than the BS further
                                                                            away from the epicentre.
After a survey of the literature, we identified the following
metrics used in the literature to assess the resilience of a                A natural disaster would have a large impact on the
cellular network: Quality of Service, fraction of isolated                  resilience of a mobile cellular network. It is expected
users, and signal-to-noise ratio.                                           that there would be a large number of users which
                                                                            are disconnected from all nearby BSs. This would
     • Quality of Service:                                                  imply that these users will not get any service and
       The Quality of Service (QoS) is arguably the most                    that the resilience of the network will be decreased
       important resilience metric in mobile networks. One                  significantly.
       of the widely-used QoS metrics is the data rate (in
                                                                          • Natural disasters with a power outage:
       Mbps) experienced by a user. This metric gives in-
       sights on how much the network can satisfy the users                 A natural disaster with a power outage is similar to
       and if the network is still functioning or not. Accord-              a normal natural disaster. However in this case, the

                                                                 2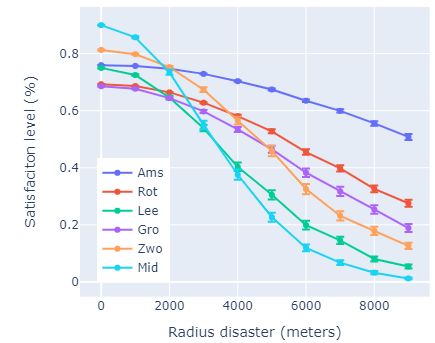
electricity grid might also be affected by the disas-                           Table 1: City information
       ter resulting in total power outage at a certain re-
       gion. But the area affected by the natural disaster                 City         Abbreviation     #BSs    #Active users
       will have no power, which implies that every BS in               Amsterdam          Ams            334       5752
       that area will not have power and will not function                Arnhem           Arn             88       1066
       completely (it is assumed that backup power is not                  Assen            Ass            36        475
       available for the BSs).                                          Den Bosch          Bos             61       1056
       It is expected that a natural disaster with a power               Den Haag          Haa            154       3604
       outage has more impact on the resilience of a mobile              Enschede          Ens             40       1109
       cellular network than a normal natural disaster. It is           Groningen          Gro             74       1402
       also expected that this type of disaster has the most             Haarlem           Hrm             79       1645
       impact on the resilience of a mobile cellular network            Leeuwarden          Lee            38        753
       because it would create a lot of isolated users in an             Lelystad           Lel            36        545
       area and also users that are connected to BS that are            Maastricht         Maa             66        856
       far away. This would imply that many users would                 Middelburg         Mid             24        339
       not get a satisfactory service.                                  Rotterdam          Rot            178       4386
                                                                          Utrecht           Utr           236       2515
     • Malicious attacks and socio-political risk:
                                                                          Zwolle           Zwo             59        867
       Malicious attacks like a DDoS attack or a targeted
       attack on a BS could have an impact on the resilience
       of a mobile cellular network. A DDoS attack could
                                                                      Twente, Enschede will also be used in this research. In-
       be able to take up parts of the maximum data rate of
                                                                      formation of each city is presented in Table 1. We use the
       the BS. Unusual but legitimate traffic occurs when
                                                                      population of each city to generate the number of users of
       a large number of people try to access the same ser-
                                                                      a cellular network. Since not all users will be active simul-
       vice at the same time. This will result in the same
                                                                      taneously, we assume that only 0.7% of the population is
       effects on the network as a DDoS attack. These risks
                                                                      active at the same time.
       prevent users to get a acceptable level of service.
       It is expected that the resilience of a mobile cellular        Since mobile networks do not reveal their infrastructures
       network will be affected by the malicious attack. But          with the public, we leverage a crowd-sources data set. This
       it will only affect a few BS and would not have a big          is a crowd-source database listing information about the
       impact on the rest of the network. So it is expected           cell towers worldwide. The data set contains information
       that it will affect the resilience marginally.                 about the location in terms of longitude and latitude, radio
                                                                      type (e.g., 3G or 4G), range and local area code of the
     • Increase of requested data rate:                               BS. Using the longitude and latitude of each city, it is
       A potential risk for a mobile cellular network is that         possible to determine which BS is within that city. The
       the users request more data rate than the network              range is used to determine if users are close enough to
       can actually deliver. This means that the users are            the BS to connect to it. Since the data set contained a
       less satisfied with the service that they receive. It is       large number of entries, some BSs are very close to each
       expected that the satisfaction level of the users will         other, so we first group them using the local area code to
       decrease when more users increase their requested              reduce the number of BSs in that area. Due to the time
       data rate.                                                     constraints of this research, the difference in delivering
                                                                      service to the users of the different radio types are not
     • Other risks:                                                   taken into account. It is assumed that every BS is an
       Human errors can fail a BS, but this would not have a          LTE eNodeB and has bandwidth according to that radio
       very big impact on the resilience of a mobile cellular         type. This will have an impact on the results since LTE
       network, since the human error only affects a limited          has faster performance than a GSM or UMTS network.
       number of BSs. So this risk will not be taken into             Moreover, the connectivity between BS and the way data
       account in this research.                                      travels between the BSs is also not simulated, for the sake
                                                                      of simplicity.
5.    METHODOLOGY
This section will address the methodology that is being
                                                                      5.2    Simulation Model
used to answer RQ3. Now that the resilience metrics and               The simulation will load in all the BS of a city using the
potential risks are defined, we will assess the resilience of         OpenCellId [18] data set. In the same area users will be
the cellular networks in the Netherlands via simulations              randomly distributed in the cities. Each user will have a
using a data set from OpenCellId [18].                                longitude, latitude, link object to a BS and a requested
                                                                      data rate. The requested data rate is a randomized inte-
5.1     Cities of the Netherlands                                     ger between 10 and 100 Mbps to simulate different traffic
It is not possible to calculate the complete resilience of            profiles, e.g., users with a video streaming application or
the complete network in the Netherlands, since the algo-              web browsing.
rithm is too complex and this would require a long simu-              A link can be created between a user and a BS when the
lation time. So we will divide the network into different             user is within the range of the BS, which is retrieved from
cities. For this, the 12 provincial cities of the Nether-             the OpenCellId data set [18]. The simulator will determine
lands will be used. The provincial cities of the Netherlands          which BS is the closest to the user. It will try to connect
are Groningen, Leeuwarden, Assen, Zwolle, Lelystad, Arn-              the user to the BS, if that is not possible, because for
hem, Utrecht, Haarlem, Den Haag, Middelburg, Den Bosch                instance there is no available bandwidth left for the user
and Maastricht. Additionally, important cities of the Nether-         then it will try to connect the user to the second closest
lands are used, such as Amsterdam and Rotterdam. More-                BS. If the user is not able to connect to a BS, this user will
over since this research is performed at the University of            be considered as an isolated user. When the link object

                                                                  3
is created, multiple properties will be defined. First, it          the carrier frequency and Dhb the base station antenna
will save the distance between the user and the BS. Given           height in meters, measured from the average rooftop level.
the requested rate of the user, it is possible to calculate         Finally, the path loss formula can be calculated as follows
how much bandwidth the users needs using the Shannon                [1]:
Capacity formula [14].
The number of channels that each BS has in the simu-                                            √
lation is 5. Each channel has a maximum bandwidth of                                PL = L +        10 ∗ randn(1).           (3)
20 MHz. Each channel can provide different bandwidths
                                                                    The signal bandwidths are carried over a 2000 MHz fre-
to the user. This bandwidth will be allocated to the users
                                                                    quency. The base stations have a Ptx of 43 dB [1], the
considering the following concrete bandwidths, [20, 15, 10,
                                                                    antenna height is 15 meters, the M CL is 70 dB, the Gtx
5, 4, 1.4] MHz. These bandwidths are from LTE channels
                                                                    is 15 dBi, Grx is 0 dBi.
and are also applied to BS with another radio type for
the sake of simplicity. For instance if a user requests 7           After calculating the receiving power using (1), the SNR
MHz then 10 MHz will be allocated to the user. When                 can be calculated using (6). The SNR can then be used
assigning bandwidths to the users, the users will be sorted         to calculate the data rate that the user receives. The data
in decreasing order according to the amount of requested            rate can be calculated using the Shannon Capacity (4),
bandwidth. When a channel does not have enough band-                where B the bandwidth in MHz and C is the data rate
width to serve another user, the user with the most band-           (capacity) in Mbps:
width will receive a lower bandwidth so that another user
can be served. For instance if there are 2 users where 1
user is using 10 MHz and the other 15 MHz of bandwidth,                              C = B ∗ log2 (1 + SN R).                (4)
then the total bandwidth is 25 MHz. This is too much
for the channel, so the bandwidth of the user that receives         5.4    Calculating Resilience Metrics
15 MHz will reduce the bandwidth to 10 MHz. This will               The simulator needs to calculate the resilience metrics for
ensure that less users are isolated, but it will less satisfy       a certain scenario. This subsection will discuss how the
some users. Since it is arguably more important to serve            resilience metrics are calculated for a certain scenario.
more users than to give a higher satisfaction level to some
users.                                                                 • Quality of Service
5.3    Simulation Environment                                             To determine the QoS resilience metic, the satisfac-
We develop a system-level simulator in Python [13] to sim-                tion level will be calculated. The formula to calculate
ulate the potential risks on the cities and retrieve the re-              the satisfaction level is as follows:
silience metrics.
Frameworks                                                                                       P#users     Ci
                                                                                                      i=0    Ri
It will load in the BSs for the city, create a baseline, fail                               S=                               (5)
                                                                                                      #users
some of the BSs according to the model of the potential
risk and retrieve resilience metrics. After that, it saves                where S is the satisfaction level, Ci the received data
all the retrieved data in a CSV file. NumPy [11] is used                  rate and Ri the requested data rate of a user. This
to have some helper functions for randomization of the                    formula creates an average of the satisfaction level of
distribution of the users and for failing of the BSs. The                 the users.
SciPy [15] and NumPy [11] libraries are used to determine
the 95% confidence interval of the data. Plotly [12] is used           • Isolated users
to plot all the retrieved metrics into charts. Since it is an             The number of isolated users is the number of all the
easy-to-use library to plot charts with a large amount of                 users that are not connected to a BS. We also report
data.                                                                     the average number of users per BS.
LTE framework
                                                                       • SNR
The larger the distance between the user and BS the lower
                                                                          SNR is calculated as follows:
the receiving power will be. The received power can be
calculated as follows:
                                                                                                       Psignal
                                                                                              SN R =           .             (6)
                                                                                                       Pnoise
       Prx = Ptx − M ax(P L − Gtx − Grx , M CL)          (1)
                                                                          The signal strength will be determined using a path
where Prx is the received signal power, Ptx the transmitted               loss model [1]. The signal noise will be set as a con-
signal power, Gtx the transmitter antenna gain, Grx the                   stant in the simulation.
receiver antenna gain and M CL the minimum coupling
loss, which is the minimum signal loss between BS and
user. Also, the path loss needs to be calculated to complete        5.5    Test Scenarios
this formula. We assume a Macro cell propagation model              To determine how much effect each potential risk has on
for an Urban Area [1]. The propagation model can be                 the resilience of mobile networks, test scenarios are per-
calculated as follows:                                              formed in the simulation. Each scenario will run 200 times
                                                                    to ensure that the randomizations performed are unified
                                                                    and a normal distribution can be used to determine a 95%
         L = 40 · (1 − 4 · 10−3 · Dhb) + log10 (R)                  confidence level. When running a scenario each round the
                                                         (2)
            −18 · log10 (Dhb) + 21 · log10 (f ) + 80                user will be placed randomly in the city. The following
                                                                    scenarios will be performed:
where R is the distance between the user and the BS, f

                                                                4
(a) Isolated Users. (b) Satisfaction level. (c) Number of active BSs.
Figure 1: The impacts of increasing radius of a natural disaster on the resilience
• Natural disaster: Table 2: Minimum and maximum requested capacities per
severity level
This scenario will simulate how a natural disaster
would impact the resilience of a mobile cellular net- Severity level Min. Mbps Max. Mbps
work. The position of the natural disaster will change 0 10 20
at each round of the simulation. This will evaluate 1 20 30
how resilient the network is in different parts of the
2 30 40
city. This simulation will alter the radius of the dis-
3 40 50
aster. The simulation starts with a radius of 0 meters
4 50 60
to create a baseline and will be increased by 1000 me-
ter up until 9000 meters. To represent the fact the 5 60 70
the failure probability of a BS depends on its dis- 6 70 80
tance from the epicentre of the disaster, we define 7 80 90
the probability of failure of a BS as follows: 8 90 100
9 100 110
Distance to BS 2
( ) . (7)
Radius of disaster 6.1 Natural Disaster
The results of the simulation for a large disaster can be
• Natural disaster with a power outage: seen in Figures 1a, 1b and 1c. Figure 1a shows the per-
This scenario works the same as a standard natural centage of isolated users in each city. It was expected that
disaster, but in this scenario all BSs in the area of the the percentage of isolated users would rise when the ra-
disaster will completely fail. The same range for the dius of the disaster increases. According to Figure 1a this
radius for the disaster will be used as the standard is also the case. For instance, the number of isolated users
natural disaster. of Middelburg increases rapidly when the radius of the
disaster is 3000 meters. The city that has the least num-
• Malicious attack: ber of isolated users is Amsterdam. Even when the radius
This scenario will simulate a malicious attack on a of the disaster is 9000 meters, the number isolated is still
network. The simulation will randomly choose 50% around 5%. A reason why Middelburg is more affected by
of the base stations. This will be randomized each a natural disaster than Amsterdam is that Amsterdam is
simulation round. Each severity level the amount of larger than Middelburg. Hence, the natural disaster takes
available functionality of the BS will be decreased by up less space in the whole city and the rest of the city
0.1, starting with 1 and ending with 0. will just function normally. In the case of Middelburg, the
natural disaster will affect most of the space of the city
• Increase of requested data rate: which results in almost none of the BSs remaining active.
The number of active base stations can be found in Fig-
To simulate the increase of requested capacities of ure 1c. When the disaster has a radius of 9000 meters
the users, the simulation will start with a low re- Amsterdam still has around 272 BSs that are still active.
quested data rate for the users and increases the Middelburg on the other hand has only 1 BS left that is
request. The requested capacities for each severity still active. Consequently, in Middelburg the satisfaction
level is shown in Table 2. level will also be low, since many more users are connected
to that single BS or not even connected at all. The single
BS can then only provide the minimum level of service to
6. PERFORMANCE ANALYSIS these users. In Figure 1b it is visible that the satisfaction
This section will discuss the results obtained from the sim- level of the users is very low in Middelburg. For Amster-
ulated scenarios discussed in Section 5. Each value point dam, the satisfaction level is still at an acceptable level
in the charts has an error bar which shows the 95% confi- with disaster with a radius of 9000 meters.
dence interval. The potential risks are simulated on every
city, but to decrease the amount of information in the fig- 6.2 Natural disaster with a power outage
ures a set of cities will be removed from the figures, since It was expected that a natural disaster with a power out-
they show similar results to other cities. The simulator age would have a larger impact on the resilience level of
can be found on the git repository [5]. the mobile cellular network. It was also expected that
5(a) Isolated users (a) Isolated users.
(b) Satisfaction level.
(b) Satisfaction level
Figure 3: The impact of increasing severity of malicious
Figure 2: Natural disaster with a power outage attacks
there would be more isolated users than in a natural dis- malicious attacks. Users are still connected but they will
aster without a power outage. When comparing Figure have a lower satisfaction due to the malicious attacks.
1a to Figure 2a it is visible that a natural disaster with a
power outage has significantly more impact on the number 6.4 Increase of requested data rate
of isolated users. Middelburg will be completely isolated In Figure 4 the satisfaction level of the users is provided.
when there is a natural disaster with a power outage with In comparison to a natural disaster Middelburg is perform-
a radius of 5000 meters, while in a natural disaster with- ing relatively the best. The satisfaction level of the users
out a power outage there never was a situation where the remains high compared to the other cities, while Rotter-
whole city was isolated. Even for Amsterdam, the natural dam gets affected more by the increase of requested data
disaster with a power outage had more impact than the rate. We notice that Rotterdam has 25 users per BS. This
natural disaster without a power outage. A disaster with is significantly larger than Middelburg, since Middelburg
a power outage with a radius of 9000 meters would isolate only has 14 users per BS. So there is a relation between
around 35% of the users in Amsterdam. Compared to the the number users connected to the BS and the satisfaction
6% of natural disaster without a power outage, this is a level of the users when there are no failures on the BS.
large increase of isolated users. Due to a large number of
isolated users, the received data rate is also low for most of
the cities, see Figure 2b. The same reason as for disaster
without power outage can be used. Since there are only a
couple of BSs left, the number of connected users to each
BS will increase and the data rate available for each user
will also decrease.
6.3 Malicious attacks
In Figure 3a the number of isolated users is presented. Ac-
cording to the Figure 3a Leeuwarden has the most isolated
users. However this is only 14%. Moreover, Figure 3b
shows that the satisfaction level in the cities are decreas-
ing equally. The satisfaction level of each city decreases
around 0.2 than the starting satisfaction level. So Figure
3a and 3b conclude that a malicious attack does not have
a large impact on the resilience of the network. Addition- Figure 4: The satisfaction level when increasing requested
ally, all cities are resilient at an acceptable level against data rate
67. DISCUSSION 10. REFERENCES
In this seciton, we discuss the shortcomings of our re-
search.
[1] 3GPP. Etsi tr 136942 v10.2.0. May 2011.
First a key shortcoming of our research is that our analy- [2] H. Ahmadi, G. Fontanesi, K. Katzis, M. Z. Shakir,
sis depends on the data retrieved from OpenCellId. Since and A. Zhu. Resilience of airborne networks. Annual
the data is crowd-sourced, the data is not verified by the International Symposium on Personal, Indoorm and
network operators. This can affect the data on the loca- Mobile Radio Communications, pages 1155–1156,
tion and range of the data set. Additionally, the people 2018.
collecting the data for OpenCellId can be not equally dis-
[3] N. Alliance. 5g white paper. Next generation mobile
tributed over the Netherlands. This means that there are
networks, white paper, 2015.
location with more BS and other location with less BS.
Hence, the results of this paper are in favor for the cities [4] S. Dobson, D. Hutchison, A. Mauthe,
where more BS are recorded. A. Schaeffer-Filho, P. Smith, and J. P. Sterbenz.
Self-organization and resilience for networked
Secondly for the simulations, we have made some assump- systems: Design principles and open research issues.
tions which results in less realistic setting. For example, Preceedings of the IEEE, 107(4):819–834, March
the LTE model used in the simulator is less realistic than 2019.
a normal LTE network. It is possible to model the LTE [5] D. D. Janssen.
network so that the requested bandwidth is provided to https://github.com/ddjanssen/resilsimulator. June
the user. When there is not enough bandwidth, users will 2021.
receive less bandwidth, resulting in a lower satisfaction [6] M. Kamola and P. Arabas. Network resilience
level. Moreover this simulation assumes that every BS is analysis: Review of concepts and a country-level.
an eNodeB BS and does not consider GSM or UMTS. This case study. Computer Science, 15(3), 2014.
should be taken into account in future studies.
[7] G. Lio and C. Ji. Scalability of network-failure
Finally, the simulator normally distributes the users over resilience: Analysis using multi-layer probabilistic
the city. Most of the time this is not the case and the graphical models. IEEE/ACM TRANSACTIONS
users are more close to the center of the city. This should ON NETWORKING, 17(1), February 2009.
be taken account in future research. [8] D. Lummen. An analysis of link and node level
resilience on network resilience. 33rd Twente Student
Conference on IT, July 2020.
[9] F. Malandrino and C. F. Chiasserini. Quantifying
8. CONCLUSION and minimizing the impact of disasters on wireless
Since the use of mobile cellular networks has increased sig- communications. I-TENDER 2017 - Proceedings of
nificantly, it is important to understand the resilience of the 2017 1st CoNEXT Workshop on ICT Tools for
mobile cellular networks. This paper uses a literature sur- Emergency Networks and Disaster Relief, 2017.
vey to determine resilience metrics and potential risks for a [10] V. M. Mina Labib and J. H. Reed. Analyzing and
mobile cellular network. Some of the resilience metrics are enhancing the resilience of lte/lte-a systems to rf
Quality of Service, isolated users and the Signal-to-Noise spoofing. 2015 IEEE Conference on Standards for
ratio. The potential risks for a mobile cellular network communications and Networking, CSCN 2015, pages
are natural disaster, natural disaster with a power outage, 315–320, 2016.
malicious attack, socio-political reason and economic risks [11] NumPy. https://numpy.org/. May 2021.
and environmental risks. This paper analyses the poten- [12] Plotly. https://plotly.com/python/. June 2021.
tial risks on cities in the Netherlands using a simulation [13] Python-Software-Foundation.
created in Python [13] using an OpenCellId [18] data set https://www.python.org/. April 2021.
of the base stations. To conclude the results, all cities are [14] T. J. Rouphael. Rf and digital signal processing for
resilient against malicious attacks. Amsterdam has the software-defined radio - chapter 3 - common digital
best resilience of the Netherlands when a natural disaster modulation methods. pages 25–85, 2009.
occurs, due to a large number of base stations and the [15] SciPy. https://www.scipy.org/. May 2021.
large area of Amsterdam. Middelburg is the least resilient [16] P. Smith, D. Hutchison, J. P. Sterbenz, M. Schöller,
of the Netherlands against natural disasters, since it is sig- A. Fessie, M. Karaliopoulos, C. Lac, and B. Plattner.
nificantly smaller and has a smaller number of base station Network resilience: A systematic approach. IEEE
than Amsterdam. However, if there are no failures in the Communications Magazine, 49(7):88–97, July 2011.
network but the requested data rate of the users increases, [17] J. P. Sterbenz, D. Hutchison, E. K. Çetinkaya,
then Middelburg is performing the best and Rotterdam is A. Jabbar, J. Rohrer, M. Schöller, and P. Smith.
performing poorly. This occurs, because Rotterdam has Reilience and survivability in communication
the highest number of connected users per BS and Mid- networks: Strategies principles and survey of
delburg has the lowest. So it can be concluded that there disciplines. Computer networks, 54(8):1245–1265,
is relation between the number of connected users per BS March 2010.
and the satisfaction.
[18] Unwired-labs. https://www.opencellid.org/. April
2021.
[19] Wikipedia.
https://en.wikipedia.org/wiki/signal-to-noise ratio.
9. ACKNOWLEDGEMENTS June 2021.
I would like to thank Suzan Bayhan and Syllas Magalhaes [20] E. K. Çetinkaya and J. P. Sterbenz. a taxonomy of
for being supervisors during this research period. All the network challenges. 2013 9th International
advice that both of my supervisors provided were taken Conference on the Design of Reliable
into account for this research. Communication Networks, DRCN 2013, 2013.
7You can also read