Internet of Things (IOT) Based Weather Monitoring system
←
→
Page content transcription
If your browser does not render page correctly, please read the page content below
IARJSET                                             ISSN (Online) 2393-8021
                                                                                                            ISSN (Print) 2394-1588

             International Advanced Research Journal in Science, Engineering and Technology
                                                 Vol. 8, Issue 3, March 2021

                                            DOI: 10.17148/IARJSET.2021.8305

                       Internet of Things (IOT) Based
                         Weather Monitoring system
                              Mohmadfurkan A. Sabugar1, Asst.Prof Ketan Patel2
   Student of M.E, Computer Engineering Dept, Grow More Faculty of Engineering, Himmatnagar, Gujarat, India 1
          Grow More Faculty of Engineering, Udaipur-Himmatnagar Highway, Himmatnagar, Gujarat, India 2

Abstract: The system proposed in this paper is an advanced solution for monitoring the weather conditions at a
particular place and make the information visible anywhere in the world. The technology behind this is Internet of
Things (IoT), which is an advanced and efficient solution for connecting the things to the internet and to connect the
entire world of things in a network. Here things might be whatever like electronic gadgets, sensors and automotive
electronic equipment. The system deals with monitoring and controlling the environmental conditions like temperature,
relative humidity, light intensity and CO level with sensors and sends the information to the web page and then plot the
sensor data as graphical statistics. The data updated from the implemented system can be accessible in the internet from
anywhere in the world.

Keywords: Internet of Things (IoT) Embedded Computing System; Arduino UNO; Arduino Software, ESP8266,
Smart Environment.

                                                  І. INTRODUCTION
Present innovations in technology mainly focus on controlling and monitoring of different activities. These are
increasingly emerging to reach the human needs. Most of this technology is focused on efficient monitoring and
controlling different activities. An efficient environmental monitoring system is required to monitor and assess the
conditions in case of exceeding the prescribed level of parameters (e.g., noise, CO and radiation levels).

When the objects like environment equipped with sensor devices, microcontroller and various software applications
becomes a self-protecting and self-monitoring environment and it is also called as smart environment.

In such environment when some event occurs the alarm or LED alerts automatically. The effects due to the
environmental changes on animals, plants and human beings can be monitored and controlled by smart environmental
monitoring system. By using embedded intelligence into the environment makes the environment interactive with other
objectives, this is one of the application that smart environment targets.

Human needs demands different types of monitoring systems these are depends on the type of data gathered by the
sensor devices. Event Detection based and Spatial Process Estimation are the two categories to which applications are
classified. Initially the sensor devices are deployed in environment to detect the parameters (e.g., Temperature,
Humidity, Pressure, LDR, noise, CO and radiation levels etc.) while the data acquisition, computation and controlling
action (e.g., the variations in the noise and CO levels with respect to the specified levels). Sensor devices are placed at
different locations to collect the data to predict the behavior of a particular area of interest. The main aim of the this
paper is to design and implement an efficient monitoring system through which the required parameters are monitored
remotely using internet and the data gathered from the sensors are stored in the cloud and to project the estimated trend
on the web browser.

A solution for monitoring the noise and CO levels i.e., any parameter value crossing its threshold value ranges, for
example CO levels in air in a particular area exceeding the normal levels etc., in the environment using wireless
embedded computing system is proposed in this paper. The solution also provides an intelligent remote monitoring for
a particular area of interest. In this paper we also present a trending results of collected or sensed data with respect to
the normal or specified ranges of particular parameters. The embedded system is an integration of sensor devices,
wireless communication which enables the user to remotely access the various parameters and store the data in cloud.

                                          ІІ. EXISTING SYSTEM MODEL
In today’s world many pollution monitoring systems are designed by considering different environmental
parameters.Existing system model is presented in figure 1 uses Zigbee

  Copyright to IARJSET                                     IARJSET                                                        27

                  This work is licensed under a Creative Commons Attribution 4.0 International License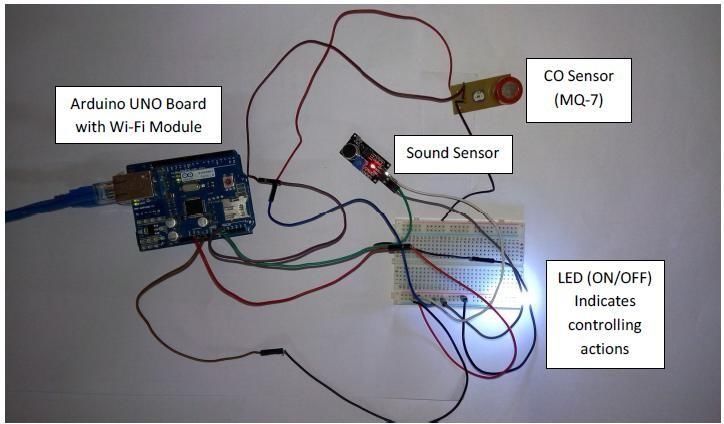
IARJSET                                              ISSN (Online) 2393-8021
                                                                                                           ISSN (Print) 2394-1588

             International Advanced Research Journal in Science, Engineering and Technology
                                               Vol. 8, Issue 3, March 2021

                                           DOI: 10.17148/IARJSET.2021.8305

[3] based wireless sensor networks to monitor physical and environmental conditions with thousands of application in
different fields.

                                            Fig. 1: Existing System Model

The sensor nodes directly communicated with the moving nodes deployed on the object of interest which avoided the
use of complex routing algorithm but local computations are very minimal.

RFID [4] is a means of storing and retrieving data through electromagnetic transmission to an RF compatible integrated
circuit. It is usually used to label and track items in supermarkets and manufactories. RFID systems consist of two main
components: tags and readers. A tag has an identification (ID) number and a memory that stores additional data such as
manufacturer, product type, and environmental factors such as temperature, humidity, etc.. The reader is able to read
and/or write data to tags via wireless transmissions. In a typical RFID application, tags are attached or embedded into
objects that are in need of identification or tracking. RFID tags can be classified into three major categories by their
power source: active tags, passive tags, and semi passive (semi-active) tags.

Mobile phones [5] or smart phones that are enabled with sensors are used for impact on social including how mobile
technology has to be used for environmental protecting, sensing and to influence just-in-time information to make
movements and actions environmental friendly. Mobile phone sensors were deployed and used on urban areas for
monitoring and it was categorized into two major classes, participatory sensing where user is directly involved and
opportunistic sensing where user is not involved, but its limitation includes power and static information processing or
mobility restrictions.

A Wireless Sensor Network [6] consists of many inexpensive wireless sensors, which are capable of collecting, storing,
processing environmental information, and communicating with neighboring nodes. In the past, sensors are connected
by wire lines.

The access method of WSN gateway node is convenient because data can be received from a WSN via the gateway at
any time and any place. The gateway acts as the       network coordinator in charge of node authentication, message
buffering where you can collect, process, analyze, and present your measurement data. Wireless sensor network
management model consists of end device, router, gateway node and management monitoring center. End device is
responsible for collecting wireless sensor network data, and sending them to parent node, then data are sent to gateway
node from parent node directly or by router. After receiving data from wireless sensor network, gateway node extracts
data after analyzing and packaging them into Ethernet format data, sends them to the server.

A server is an instance of a computer program that accepts and responds to requests made by another program; known
as a client. Less formally, any device                that runs server software could be considered a server as well.
Servers are used to manage network resources. The services or information in the servers are provided through the
Internet that are connected through LAN and made available for users via smart phones, web browser or other web
browser devices to make the system more intelligent, adaptable and efficient.

  Copyright to IARJSET                                   IARJSET                                                         28

                  This work is licensed under a Creative Commons Attribution 4.0 International License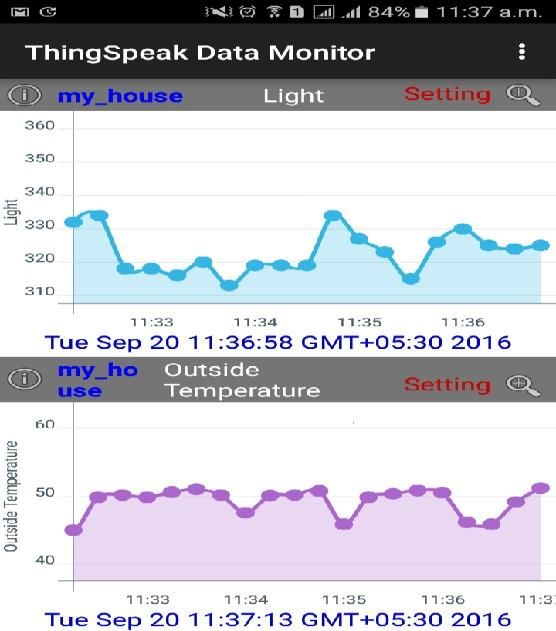
IARJSET                                             ISSN (Online) 2393-8021
                                                                                                           ISSN (Print) 2394-1588

             International Advanced Research Journal in Science, Engineering and Technology
                                                Vol. 8, Issue 3, March 2021

                                           DOI: 10.17148/IARJSET.2021.8305

                                              ІII. PROPOSED MODEL

The proposed Embedded device is for monitoring Temperature, Humidity, Pressure, light intensity, sound intensity
levels and CO levels in the atmosphere to make the environment intelligent or interactive with the objects through
wireless communication. The proposed model is shown in figure 2 which is more adaptable and distributive in nature to
monitor the environmental parameters.
The proposed architecture is discussed in a 4- tier model with the functions of each individual modules developed for
noise and air pollution monitoring. The proposed model consists of 4-tiers. The tier 1 is the environment, sensor devices
in tier 2, sensor data acquisition and decision making in tier 3 and intelligent environment in tier 4.The proposed
architecture is shown in figure 2.

Here, the tier 1 provides information about the parameters under the region which is to be monitored for noise and air
pollution control. Tier 2 deals with the sensor devices with suitable characteristics, features and each of these sensor
devices are operated and controlled based on their sensitivity as well as the range of sensing.

In between tier 2 and tier 3 necessary sensing and controlling actions will be taken depending upon the conditions, like
fixing the threshold value, periodicity of sensing, messages (alarm or buzzer or LED) etc. Based on the data analysis
performed in between tier 2 and tier 3 and also from previous experiences the parameter threshold values during
critical situations or normal working conditions are determined.

Tier 3 describes about the data acquisition from sensor devices and also includes the decision making. Which specify
the condition the data is representing which parameter.

                                                 Fig.2: Proposed model

In the proposed model tier 4 deals with the intelligent environment. Which means it will identify the variations in the
sensor data and fix the threshold value depending on the identified level of CO or noise levels. In this tier sensed data
will be processed, stored in the cloud i.e.in to the Google spread sheets and also it will show a trend of the sensed
parameters with respect to the specified values. The end users can browse the data using mobile phones, PCs etc.

                                   IV.                SYSTEM ARCHITECTURE

The implemented system consists of a microcontroller (ATmega328) as a main processing unit for the entire system and
all the sensor and devices can be connected with the microcontroller. The sensors can be operated by the
microcontroller to retrieve the data from them and it processes the analysis with the sensor data and updates it to the
internet through Wi-Fi module connected to it.

  Copyright to IARJSET                                    IARJSET                                                        29

                  This work is licensed under a Creative Commons Attribution 4.0 International License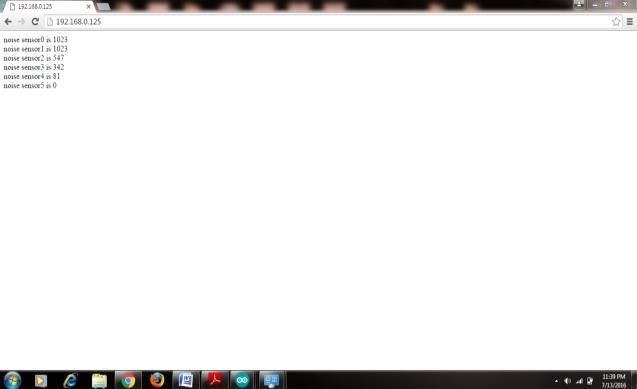
IARJSET                                             ISSN (Online) 2393-8021
                                                                                                           ISSN (Print) 2394-1588

             International Advanced Research Journal in Science, Engineering and Technology
                                                Vol. 8, Issue 3, March 2021

                                           DOI: 10.17148/IARJSET.2021.8305

BLOCK DIAGRAM :

                                          Fig.3. block diagram of the project

Arduino UNO:

Arduino is an open source tool for making computers that can sense and control more of the physical world than your
desktop computer. It's an open-source physical computing platform based on a simple micro-controller board, and a
development environment for writing software for the board. Arduino can be used to develop interactive objects, taking
inputs from a variety of switches or sensors, and controlling a variety of lights, motors, and other physical outputs.
Arduino projects can be stand-alone, or they can communicate with software running on your computer (e.g. Flash,
Processing, MaxMSP). The boards can be assembled by hand or purchased pre-assembled; the open-source IDE can be
downloaded for free.The Arduino programming language is an implementation of Wiring, a similar physical computing
platform, which is based on the Processing multimedia programming environment. It has 14 digital input/output pins
(of which 6 can be used as PWM outputs), 6 analog inputs, a 16MHz ceramic resonator, a USB connection, a power
jack, an ICSP header, and a reset button. It contains everything needed to support the micro-controller; connect it to a
computer with a USB cable or power it with an AC-to-DC adapter or battery to get started. All the modules in the circuit
are connected to Arduino module. Sensors are connected to Arduino UNO board for monitoring, ADC will convert the
corresponding sensor reading to its digital value and from that value the corresponding environmental parameter will be
evaluated.

Thing Speak:
According to its developers, “Thing Speak” is an open source Internet of Things (IOT) application and API to store
and retrieve data from things using the HTTP protocol over the Internet or via a Local Area Network. Thing Speak
enables the creation of sensor logging applications, location tracking applications, and a social network of things with
status updates".

  Copyright to IARJSET                                    IARJSET                                                        30

                  This work is licensed under a Creative Commons Attribution 4.0 International License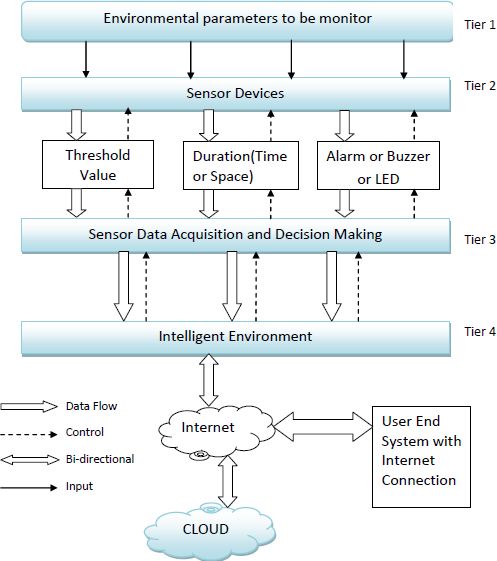
IARJSET                                             ISSN (Online) 2393-8021
                                                                                                           ISSN (Print) 2394-1588

             International Advanced Research Journal in Science, Engineering and Technology
                                                Vol. 8, Issue 3, March 2021

                                            DOI: 10.17148/IARJSET.2021.8305

Thing Speak has integrated support from the numerical computing software MATLAB from MathWorks allowing
Thing Speak users to analyze and visualize uploaded data using Matlab without requiring the purchase of a Matlab
license from Mathworks.

Wi-Fi Module

Here we used ESP8266 Wi-Fi module which is having TCP/IP protocol stack integrated on chip. So that it can provide
any microcontroller to get connected with Wi-Fi network. ESP8266 is a preprogrammed SOC and any microcontroller
has to communicate with it through UART interface. It works with a supply voltage of 3.3v. The module is configured
with AT commands and the microcontroller should be programmed to send the AT commands in a required sequence
to configure the module in client mode. The module can be used in both client and server modes.

Sensors: The system consists of temperature sensor, LDR, sound and CO sensor[4]. These 4 sensors will measure the
primary environmental factors light intensity, temperature, CO levels and sound intensity relative respectively. All this
sensors will gives the analog voltage representing one particular weather factor. The microcontroller will converts this
analog voltage into digital data.

Temperature Sensor

The LM35 is an integrated circuit sensor that can be used to measure temperature with an electrical output proportional
to the temperature (in oC). If the temperature is high then the fan will on and vice versa.., The Temperature Sensor is
shown in Fig3. The scale factor is
.01V/oC. The LM35 does not require any external calibration or trimming and maintains an accuracy of +/- 0.4oC at
room temperature and +/- 0.8oC over a range of 0 oC to +100oC.

CO Sensor

Carbon Monoxide (CO) sensor, suitable for sensing CO concentrations in the air. The MQ-7 can detect CO-gas
concentrations anywhere from 20 to 2000ppm.This sensor has a high sensitivity and fast response time. The sensor’s
output is an analog resistance. The drive circuit is very simple; all you need to do is power the heater coil with 5V, add
a load resistance, and connect the output to an ADC.

  Copyright to IARJSET                                    IARJSET                                                        31

                  This work is licensed under a Creative Commons Attribution 4.0 International License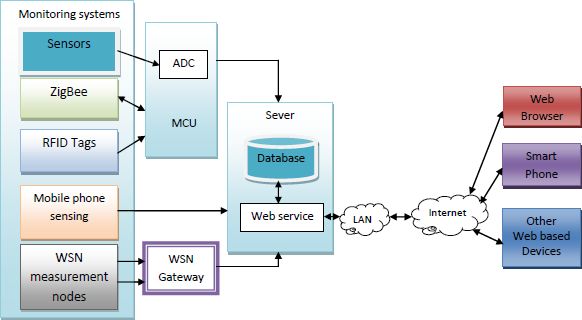
IARJSET                                             ISSN (Online) 2393-8021
                                                                                                            ISSN (Print) 2394-1588

              International Advanced Research Journal in Science, Engineering and Technology
                                                 Vol. 8, Issue 3, March 2021

                                             DOI: 10.17148/IARJSET.2021.8305

Sound Sensor

The Sound Sensor detects the decibel level: the softness or loudness of a sound[5]. The Sound Sensor detects both dB
and dBA. dBA: the sounds human ears are able to hear. dB: all actual sound, including sounds too high or low for the
human ear to hear. The Sound Sensor can measure sound pressure levels up to 90 dB – about the level of a lawnmower.
For comparison, 4-5% is like a silent living room and 5-10% is about the level of someone talking some distance away.
From 10-30% is normal conversation close to the sensor or music played at a normal level and 30-100% represents a
range from people shouting to music playing at high volumes. These ranges are assuming a distance of about 1 meter
between the sound source and the Sound Sensor.

LDR Light-Dependent Resistor

An LDR is a component that has a (variable) resistance that changes with the light intensity that falls upon it[3]. This
allows them to be used in light sensing circuits. A light- dependent resistor (LDR) is a light-controlled variable resistor.
The resistance of this decreases with increasing incident light intensity; in other words, it exhibits photo- conductivity.
An LDR can be applied in light-sensitive detector circuits, and light- and dark-activated switching circuits. An LDR is
made of a high resistance semiconductor. In the dark, an LDR can have a resistance as high as a few mega ohms (MΩ),
while in the light, an LDR can have a resistance as low as a few hundred ohms. If incident light on an LDR exceeds a
certain frequency, photons absorbed by the semiconductor give bound electrons enough energy to jump into the
conduction band.

The resulting free electrons (and their whole partners) conduct electricity, thereby lowering resistance. The resistance
range and sensitivity of an LDR can substantially differ among dissimilar devices

             V.           COMPUTATIONAL ANALYSIS ON ENVIRONMENTAL PARAMETERS

Here we include some basic analytics methods to calculate the pollution parameters, like noise levels and CO levels in
the surrounding environment.
The common unit of measurement for sound is decibel, dB and its intensity is measured in Sound Pressure Level (SPL).
The noise levels are measured in the A–weighted (low-level sensitivity) SPL, abbreviated as dB (A). Sound of
frequencies from 800 to 3000Hz is covered by the A– weighted scale.

If the SPL, L1 in dB is measured at r1 meters, then SPL, L2 in dB at r2 meters is given by
L2 = L1 - 20 log10 (r2/r1)
Day – Night equivalent noise levels (Ldn ) of a community can be expressed as
                           Ldn , dB(A) = 10 * log10[ 15/24(10Ld /10 ) + 9/24(10(Ln +10)/10 ) ]

Where,
Ld= day- equivalent noise levels (from 7AM – 10PM), dB(A)

  Copyright to IARJSET                                     IARJSET                                                        32

                   This work is licensed under a Creative Commons Attribution 4.0 International License
IARJSET ISSN (Online) 2393-8021
ISSN (Print) 2394-1588
International Advanced Research Journal in Science, Engineering and Technology
Vol. 8, Issue 3, March 2021
DOI: 10.17148/IARJSET.2021.8305
Ln = night-equivalent noise levels (from 10PM – 7AM), dB(A)
Based on intensity, the sound intensity may be expressed in decibels above the standard threshold of hearing I0. The
expression is
I(dB) = 10 log10[I I0] intensity in decibels Table : Standard for noise values
Night (10pm- Day (7am-10pm) Type of region
7am) Unit in decibels Unit in decibels
45 55 Residential
40 60 Residential -
commercial
55 65 commercial
60 70 Residential-
industry
65 75 industry
The usual reference method for the measurement of carbon monoxide concentration in air is based on the absorption of
infrared radiation by the gas in a non- dispersive photometer. This method is suitable for stable installations at fixed-
site monitoring stations. More recently, portable carbon monoxide analyzers [9] with automated data-logging have
become available for personal exposure monitoring. These measurements are based on the electrochemical reactions
between carbon monoxide and de-ionized water, which are detected by specially designed sensors. Nowadays the
resolution, stability and sensitivity of the electrochemical analyzers are within the specifications of the reference
method and, together with the data-logging systems, they fit into a small rucksack or even a pocket.
Conversion factors
1 ppm = 1.145 mg/m3
3
1 mg/m = 0.873 ppm
Using the Table 1 and values obtained from above calculations, the threshold value can be set to the requirements
dynamic nature of the environment and to monitor the parameters data through sensors.
VI. IMPLEMENTATION
Based on the framework shown in figure 2, we have identified a suitable implementation model that consists of
different sensor devices and other modules, their functionalities are shown in figure 3.In this implementation model we
used Arduino UNO board with Wi-Fi module is as embedded device for sensing and storing the data in cloud. Arduino
UNO board consist of analog input pins (A0-A5), digital output pins (D0-D13), inbuilt ADC and Wi-Fi module
connects the embedded device to internet. Sensors are connected to Arduino UNO board for monitoring, ADC will
convert the corresponding sensor reading to its digital value and from that value the corresponding environmental
parameter will be evaluated.
Flowchart:
Copyright to IARJSET IARJSET 33
This work is licensed under a Creative Commons Attribution 4.0 International LicenseIARJSET ISSN (Online) 2393-8021
ISSN (Print) 2394-1588
International Advanced Research Journal in Science, Engineering and Technology
Vol. 8, Issue 3, March 2021
DOI: 10.17148/IARJSET.2021.8305
The Wi-Fi connection has to be established to transfer sensors data to end user and also send it to the cloud storage for
future usage.
Fig. 4: Schematic diagram of implementation model
An embedded system designed for environmental monitoring and its components are shown in figure 5.The embedded
device is placed in particular area for testing purpose. The sound sensor detects sound intensity levels in that area and
Carbon Monoxide (CO) sensor MQ-9 will record the air quality in that region, if the threshold limit is crossed the
corresponding controlling action will be taken (like issuing message alarm or buzzer or LED blink).All the sensor
devices are connected to internet through Wi-Fi module.
Fig. 5: Noise and air pollution monitoring embedded system with its components
Figure 5 shows the embedded system with its components for reading and to store the pollution parameters in cloud.
After successful completion of sensing, the data will be processed and stored in database for future reference. After
completing the analysis on data the threshold values will be set for controlling purpose.
Copyright to IARJSET IARJSET 34
This work is licensed under a Creative Commons Attribution 4.0 International LicenseIARJSET ISSN (Online) 2393-8021
ISSN (Print) 2394-1588
International Advanced Research Journal in Science, Engineering and Technology
Vol. 8, Issue 3, March 2021
DOI: 10.17148/IARJSET.2021.8305
VІI. SIMULATION RESULTS
After sensing the data from different sensor devices, which are placed in particular area of interest. The sensed data will
be automatically sent to the web server, when a proper connection is established with sever device.
Fig. 6: web server page
The figure 6 shows the web server page which will allow us to monitor and control the system. By entering IP address
of server which is placed for monitoring we will get the corresponding web page. The web page gives the information
about the intensity of sound and the CO level variations in that particular region, where the embedded monitoring
system is placed.
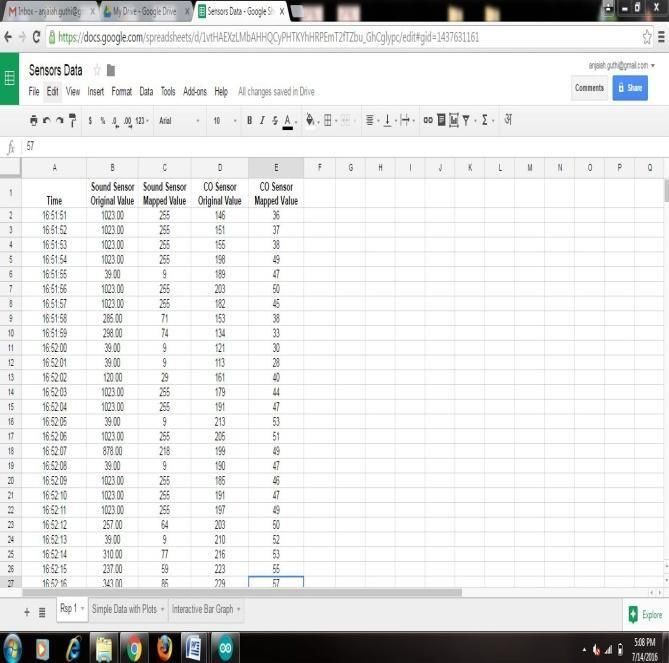
Fig. 7: Cloud storage (Google Spread Sheets) for sensors data.
The sensed data will be stored in cloud (Google Spread Sheets). The data stored in cloud can be used for the analysis of
the parameter and continuous monitoring purpose. The figure 7 shows the noise intensity levels and CO levels in air at
regular time intervals. All the above information will be stored in the cloud, so that we can provide trending of noise
intensity and CO levels in a particular area at any point of time.
Copyright to IARJSET IARJSET 35
This work is licensed under a Creative Commons Attribution 4.0 International LicenseIARJSET ISSN (Online) 2393-8021
ISSN (Print) 2394-1588
International Advanced Research Journal in Science, Engineering and Technology
Vol. 8, Issue 3, March 2021
DOI: 10.17148/IARJSET.2021.8305
Fig. 8(a)
Fig. 8(b)
Fig. 8(c)
The graph in figure 8 (a) shows the sound intensity levels during day time at regular time intervals. The graph 8 (b)
shows the sound intensity levels during night time. The graph 8(c) shows the average sound intensity levels during
entire day. Depending on the average value, threshold value will be decided.
Copyright to IARJSET IARJSET 36
This work is licensed under a Creative Commons Attribution 4.0 International LicenseIARJSET ISSN (Online) 2393-8021
ISSN (Print) 2394-1588
International Advanced Research Journal in Science, Engineering and Technology
Vol. 8, Issue 3, March 2021
DOI: 10.17148/IARJSET.2021.8305
Fig. 9(a)
Fig. 9(b)
Fig. 9(c)
The graph in figure 9(a) shows the CO levels in city environment with full traffic at regular time intervals. The graph
9(b) shows the CO levels in city environment without traffic. The graph 9(c) shows the average CO levels during entire
day. After completing the analysis on sensed data, the threshold value will be set for necessary controlling actions.
Copyright to IARJSET IARJSET 37
This work is licensed under a Creative Commons Attribution 4.0 International LicenseIARJSET ISSN (Online) 2393-8021
ISSN (Print) 2394-1588
International Advanced Research Journal in Science, Engineering and Technology
Vol. 8, Issue 3, March 2021
DOI: 10.17148/IARJSET.2021.8305
Fig.10.Temperature and Light intensity
VІІI. CONCLUSION
By keeping the embedded devices in the environment for monitoring enables self protection (i.e., smart environment) to
the environment. To implement this need to deploy the sensor devices in the environment for collecting the data and
analysis. By deploying sensor devices in the environment, we can bring the environment into real life i.e. it can interact
with other objects through the network. Then the collected data and analysis results will be available to the end user
through the Wi-Fi. The smart way to monitor environment and an efficient, low cost embedded system is presented
with different models in this paper.
In the proposed architecture functions of different modules were discussed. The noise and air pollution monitoring
system with Internet of Things (IoT) concept experimentally tested for monitoring two parameters. It also sent the
sensor parameters to the cloud (Google Spread Sheets). This data will be helpful for future analysis and it can be easily
shared to other end users.
This model can be further expanded to monitor the developing cities and industrial zones for pollution monitoring. To
protect the public health from pollution, this model provides an efficient and low cost solution for continuous
monitoring of environment
REFERENCES
[1]Sarabjeet Singh, “IOT Based Weather Monitoring System” International Journal of Research in Computer science.
[2]I. J. Cox, M. L. Miller and J. A. Bloom, “IOT Based Weather Monitoring System”, Morgan Kaufman Publishers, 2002.
[3] P. Siva, “IOT Based Weather Monitoring System”, University of Waterloo: Work Term Report, 2002.
[4]Saraju P. Mohnty, “IOT Based Weather Monitoring System”, Dept of Computer Science and Engineering, University of South Florida.
[5]P. Siva, “IOT Based Weather Monitoring System”, University of Waterloo: Work Term Report, 2002.
[6]Lin Liu, “A Survey of IOT Based Weather Monitoring System”
[7]Mei Jiansheng and Li Sukang, “IOT Based Weather Monitoring System”, International Symposium on Web Information System and Application
ISBN 978-952.
[8]GhoutiL, BouridaneA and Ibrahim MK, “IOT Based Weather Monitoring System” , IEEE Transactions on Signal Processing, 54(4), pp. 1519-
1536, 2006.
[9] Reddy AA, Chatterji BN, “A new wavelet based logo watermarking scheme”, Conf. Pattern Recognition letters, 26(7), pp. 1019-1027, 2005.
[10] S.Craver,”Can Invisible Watermarks Resolve Rightful Ownership?” IBM Research Report, RC205209, July25 1996.
[11] S. Craver,”Resolving Rightful Ownerships with Invisible Watermarking Techniques: Limitations, Attacks and Implications”, IEEE Journal, On
Selected Areas in Communications, Vol.16, No.4, May 1998, pp.573-586 [12] Kunal Megha, S. M. Shah,” IOT Based Weather Monitoring
System” International Journal of Engineering Research and Technology, Vol 1, Nov 2012 [13]http://www.iotsensor/data
14]http://www.altern.org/iot/sensor [15]http://www.cl.cam.ac.uk/µ [16]http://nif.www.media.mit.edu/DataHiding
[17]http://www.intertrust.com
Copyright to IARJSET IARJSET 38
This work is licensed under a Creative Commons Attribution 4.0 International LicenseYou can also read