An Autoencoder Based Approach to Simulate Sports Games
←
→
Page content transcription
If your browser does not render page correctly, please read the page content below
An Autoencoder Based Approach to Simulate
                                                          Sports Games

                                             Ashwin Vaswani∗1 , Rijul Ganguly∗1 , Het Shah∗1 , Sharan Ranjit S∗1 , Shrey
                                                                Pandit1 , and Samruddhi Bothara1
                                                  1
                                                      Birla Institute of Technology and Science Pilani, K. K. Birla Goa Campus
arXiv:2007.10257v1 [cs.AI] 16 Jul 2020

                                                      Abstract. Sports data has become widely available in the recent past.
                                                      With the improvement of machine learning techniques, there have been
                                                      attempts to use sports data to analyze not only the outcome of individ-
                                                      ual games but also to improve insights and strategies. The outbreak of
                                                      COVID-19 has interrupted sports leagues globally, giving rise to increas-
                                                      ing questions and speculations about the outcome of this seasons leagues.
                                                      What if the season was not interrupted and concluded normally? Which
                                                      teams would end up winning trophies? Which players would perform the
                                                      best? Which team would end their season on a high and which teams
                                                      would fail to keep up with the pressure? We aim to tackle this problem
                                                      and develop a solution. In this paper, we propose UCLData, which is
                                                      a dataset containing detailed information of UEFA Champions League
                                                      games played over the past six years. We also propose a novel autoen-
                                                      coder based machine learning pipeline that can come up with a story on
                                                      how the rest of the season will pan out.

                                                      Keywords: Sports Analytics · Machine Learning · Data Mining · Auto-
                                                      encoder.

                                         1        Introduction
                                         Sports analytics has received extensive attention over the past few years. While
                                         a lot of work in sports analysis emphasizes on visual [1,2] and tactical analysis
                                         [3], there have been recent attempts to predict the outcome of individual games
                                         and entire seasons. However, most of these attempts only predict the outcome
                                         without providing insights or internal statistics to corroborate their results. An-
                                         other issue is the lack of large clean datasets for this task. While most of the
                                         existing datasets provide data summarising matches, there is little focus on the
                                         little intricacies of matches that might be of interest. To tackle this, our pro-
                                         posed UCLData dataset consists of both match and individual statistics from
                                         Champions League matches played over the past six years. Further, we handle
                                         dataset size issues with the help of some intuitive priors or handcrafted features
                                         which make our model robust and realistic.
                                              In this work, our proposed novel autoencoder based architecture not only
                                         predicts the outcome of a game but also predicts its internal statistics, to give a
                                              ∗
                                                  Equal contribution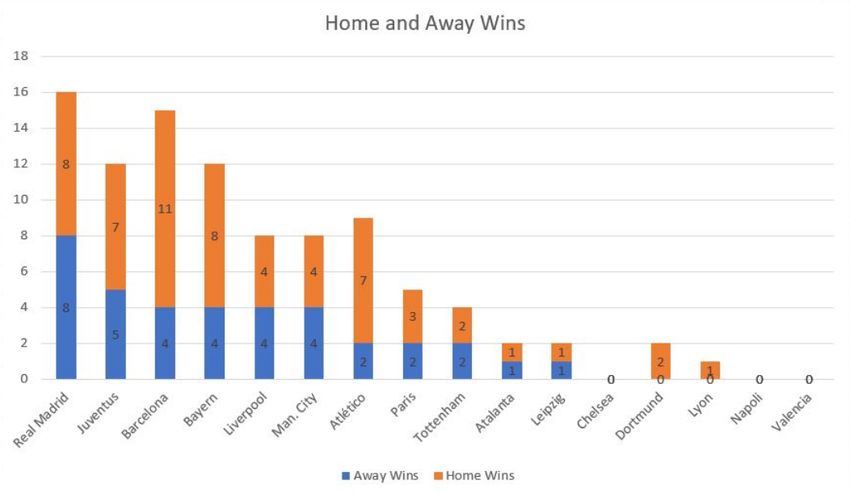
more holistic picture of how a match is expected to pan out. Moreover, apart from
match-wise statistics, we also present player-wise statistics to provide details
about the contribution of each player and minor details about a match which
are generally ignored. The code for our work is made publicly available.†

2       Related Work
Most of the previous approaches based on machine learning for predicting results
of sports games aim to predict simply the outcome of matches, instead of running
a simulation predicting all match-related statistics.
    Kampakis et al.[4] used both player and team data for cricket matches to
predict the performance of teams based on different features. A study by Rot-
shtein et al.[5] used several predictive models to predict outcomes in the English
Premier League and the Premiership Rugby in England. There are various works
based on Bayesian models [6,7,8], but these limit themselves to predicting the
outcomes of individual football matches instead of running simulations. A work
based on the Gaussian Process model by L. Maystre et al.[9] attempts to learn
the strengths and traits of a team by player wise contributions. This is an inspi-
ration for our present study.
    Huang et al.[10] focus on using neural networks to predict the results of the
2006 Football World Cup and this is the most similar to what we have tried to
achieve in this paper. They achieved an accuracy of 76.9% on the games’ results,
having special difficulty in predicting draws. Hucaljuk et al.[11] incorporated
expert opinion into Champions League matches, but in this case, there was no
increase in accuracy in their prediction of game scores. S. Mohammad Arabzad et
al. [12] incorporated the use of neural networks for the Iranian premier league.
Flitman et al. [13] developed a model that will readily predict the winner of
Australian Football League games together with the probability of that win. This
model was developed using a genetically modified neural network to calculate
the likely winner, combined with a linear program optimisation to determine
the probability of that win occurring in the context of the tipping competition
scoring regime.

3       Dataset
The following section details our approach for creating a dataset from which we
can derive meaningful predictions.

3.1      Data Collection
We scrape data from the official UEFA Champions League website to build our
dataset. Data from the years 2014 to 2020 is used. Overall we collect the data
for 157 knockout stage matches. We do not collect data for group stage matches
    †
        https://github.com/ashwinvaswani/whatif

                                          2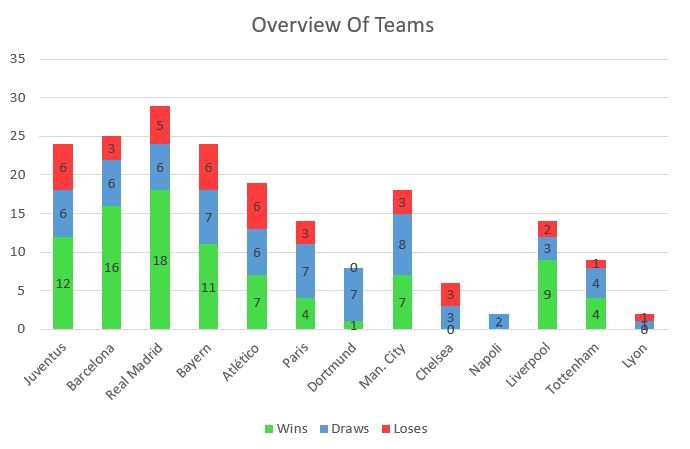
Fig. 1: Overview of Dataset

because our predictions will be on the knockout stage games of the 2019 − 20
season of the Champions League, and hence we did not want the context of
group stage matches misleading our model.
    To scrape the data, we use the Python library Beautiful Soup [14], which
assists us to take the data directly from the relevant websites. We divide our
data into two categories - team data and player data. Team data contains the
statistics for the entire team playing in the match on both sides, while player
data includes the statistics of the teams’ individual players.
    To obtain team data, we use the official UEFA website for the individual
matches. However, the official website does not contain the statistics for individ-
ual players. Hence, we extract individual player data from the FBref website [15]
and the Global Sports Archive website [16]. Table 1 summarises the attributes
we considered for our dataset.

             Attributes
Team         Total goals, total attempts, attempts on and off target, blocked shots,
             shots which hit the woodwork, corners, off-sides, amount of possession,
             total passes, passing accuracy, completed passes, distance covered,
             number of balls recovered, tackles, clearances, blocks, yellow and
             red cards, fouls.
Individual   Goals scored, total shots, shots on target, assists, interceptions, crosses,
             fouls committed, player off-sides, total time played

              Table 1: List of attributes for a team and an player

                                           3
3.2 Data Pre-processing
Our data in its raw form contains numbers spanning a wide range - from hun-
dreds in the fields such as passes completed to only one or two in areas such as
goals. Passing such fields without any pre-processing would lead to our proposed
model not accurately capturing this wide range. Hence we normalize our data
to the range of zero to one using MinMax Scaling. This ensures that our model
does not give any undue importance to any fields because of scaling issues. After
pre-processing, we create embeddings from our normalized data.
3.3 Creation of Embeddings
There are some problems with using individual match data throughout. First,
information from earlier matches cannot be used efficiently. This argument can
be demonstrated with the help of an example. Let us say two teams A and
B play against each other in years Y1 and Y2. Now, these two games are not
independent as the two sides have played multiple other teams in this period and
improved their game-play. Thus, it is not ideal to directly use individual match
stats without capturing this context. Another issue is regarding players switching
teams, which is quite common in sports. If a player plays in team A in year Y1
and switches to team B in year Y2, we need a way to represent it so that their
individual information is maintained. We solve these problems with the use of
embeddings. We create embeddings for each team and each player so that when
two teams are matched up, these representations can capture the interactions
with other teams and players and can preserve contextual information from
previous data.
4 Methodology
4.1 Handling problem of Data bias
Our data consists of matches from the last six years of Champions League games.
Although we found this data sufficient to capture relationships between teams
and players, there were a few issues due to imbalance. Some teams, not being
Champions League regulars, had fewer data points. We find that our initial
results were biased towards the lower number of data points of these teams
and lacked generalization. We attempted to overcome this issue with the help
of prior information, which is important in the field of football analysis. We
propose three additional hand-crafted features which are crucial in the context
of a game. We also infer that regularisation and dropout help in solving some of
these problems. We show in the following sections how the addition of each of
these features helps in making our results more robust.
Home / Away status: An important feature of Champions League knockout
stages is the Home / Away concept. A fixture consists of two games wherein
4(a) Home / Away wins (b) Outcome vs Form - Colour
intensity represents higher con-
centration of matches with a par-
ticular outcome.
Fig. 2: Home / Away wins and Outcome vs Form
each game is played at the home ground of the two teams. The Figure 2(a)
shows some analysis of the importance of the location of the fixture. It can be
seen that there is a general trend for most teams to perform better at home
than while away, which is quite intuitive. We attempt to use this information
by adding an extra flag to indicate the team is playing at home apart from our
embeddings while giving input to the model.
Form Index: Another essential feature, relevant to the context of a match, is
the form of the two teams playing. It can be seen in Figure 2(b) that at lower
values of the form(< 7), teams are less likely to win whereas, in the middle range,
it’s difficult to predict with just form. We used the recent results of each team
(Results from the five most recent games before the fixture) to generate a form
index by giving a score of three points to a Win, one to a Draw, and zero to a
Loss. This additional information helped in improving results of certain matches
as a team would rather go into a game with a form of 15(five straight wins) than
0(five straight losses).
Experience: Figure 1 shows that some teams such as Real Madrid, being Cham-
pions League regulars have plenty of data points. In contrast, teams like Ata-
lanta, who are new to the Champions League, have few data points. Hence,
results of matches involving Atalanta were biased to the data from these limited
games resulting in Atalanta performing exceptionally well against the odds in
our initial experiments. While this can be considered a case of an ”upset” or
Atalanta being ”dark horses”, we wanted to improve our results and make our
predictions robust. A critical factor is a team’s experience in the Champions
5League, due to the pressure of playing in such a high-profile platform. We ac-
cumulated total matches played by every team in our data to account for this
experience factor, which helped in solving the issue of predictions being biased
because of limited data.
4.2 Details of the Model
(a) Teams Model
(b) Players Model
Fig. 3: Details of the models used
Our network is based on the idea of autoencoders[17] which are widely used
for data compression. The aim of our training process is to learn about the
various features of the team and the players. To achieve this we aim to learn an
embedding in latent dimension. We also want this data in latent dimension to
be robust from other factors which cannot always be predicted from the data.
The model architectures are as shown in Figure 3. We add a Gaussian noise to
this in order to create a ”noisy” embedding. This is given as an input to the
network. The intuition for adding Gaussian noise is that it will help take into
consideration some factors which are not consistent with the data (example a
player having a lucky day or an off day/weather conditions which affect the play).
We use the embedding without Gaussian noise as our ground truth labels. The
schematic of the training process is given in the Figure 4. So, after the training
process, the model learned some important insights about the team’s/player’s
performance, which is later helpful during the playoffs to decide the winner of a
particular match. For training, the loss is taken to be mean squared error, and
the metric that we have considered is the root mean squared error (RMSE).
We used Adam Optimizer with a learning rate of 0.01 and the batch size was
10 embeddings, for both our models. The RMSE values in the training and
validation process are not metrics of performance of the model on new matches,
rather they are indicators of the models efficiency in learning the embedding.
The training RMSE value for the team model is 0.1380, and for players model is
0.1127. The validation RMSE values for both the models are pretty close to the
training models at 0.1379 for the team model and 0.1126 for the players’ model.
The overall summary of our pipeline can be seen in Figure 4.
6Fig. 4: Summary of our pipeline
5 Results and Observations
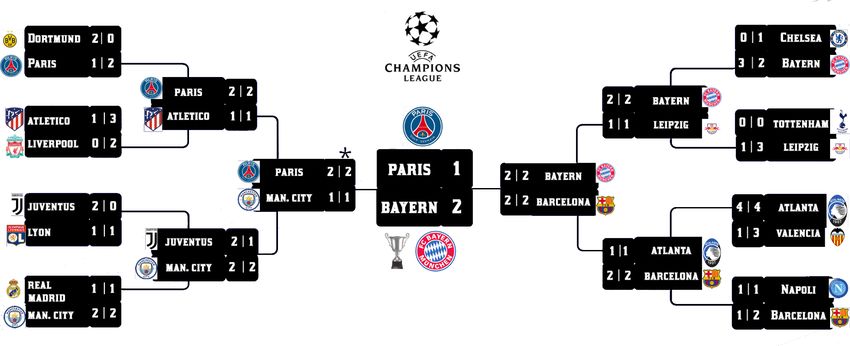
Fig. 5: Overview of Simulation
Figure 5 gives an overview of the simulation of the interrupted knockout
stages of Champions League 2019-20. Our model predicts both match(Total
Goals, Total Passes, Possession, Blocks, Corners, etc.) and player statistics(Who
scored the goals, Assists, Shots, Crosses, etc.) for the two teams in the fixture.
The winner(team with a higher aggregate score over two legs) proceeds to the
next round. In the case of a draw in the overall fixture (equal aggregate score from
home/away legs), the team with the highest number of shots on target qualifies.
We picked Shots on target as a decider, as it has the highest correlation with
goals, which can be seen in Figure 6(a).
The first simulation is between Bayern Munich and Chelsea(2nd Leg). Bay-
ern Munich beat Chelsea comprehensively in the first leg fixture, which was
conducted before the season was interrupted. Bayern entered the game with a
7(a) Correlation with goals (b) Average Goals per team
Fig. 6: (a) Shows high correlation between goals and shots on target (b) Identifies
high / low scoring teams
form of five wins in its last five games, whereas Chelsea had mixed results re-
cently. The odds favored Bayern to win this tie, which is also backed up by
our results. Bayern beat Chelsea comfortably with a scoreline of 2-1 dominating
the possession(57%) and total passing(597) stats. These stats are also backed
up, as our data shows that Bayern Munich is one of the best teams in Europe
in terms of passing and possession stats, which can be seen in Figure 7(1a)
and Figure 7(2a). The goal scorers for Bayern were Robert Lewandowski and
Jerome Boateng. Jorginho was the lone scorer for Chelsea. Our analysis shows
Lewandowski as one of the most prolific goal scorers in Europe over the past few
years, which is backed up by these results.
A similar result was found in the simulation of the game between Barcelona
and Napoli. Barcelona being European giants and one of the best passers in
Europe dominated the passing(571) and possession(56%) stats and won with
a scoreline of 2 − 1 at home with Rakitic scoring for Barcelona. Rakitic has a
good record of scoring in Champions League knockouts, which is an interesting
observation that our model is able to capture. Also, Barcelona has a great home
record, as can be seen in Figure 1, which is also corroborated by our results.
In another match, Paris (PSG) beat Atltico by two goals to one in both fix-
tures. Our analysis shows that Paris, a team with a good scoring record (from
Figure 6b), have a tendency to perform better against more defensive teams like
Atltico. Cavani, who is one of the most prolific scorers, scored in the fixture- thus
validating our results. Another big fixture was the game between Juventus and
Man. City in which Ronaldo scored one goal, and Dybala scored two goals. How-
ever, their efforts were in vain, as Laporte scored two headed goals off corners,
and Gabriel Jesus scored one to take Manchester City to the semi-finals against
Paris. Paris, being the in-form team in the semi-finals, beat Manchester City
by dominating them in terms of both possession(58%) and passing stats, where
8(1a) Passes (2a) Possession (3a) Corners
(1b) Simulation of Passes (2b) Simulation of Possession (3b) Simulation of Corners
Fig. 7: Distribution of Passes, Possession and Corners in training data and in
our simulations. The similarity between the plots show that our model is able
to learn the distribution effectively. Figure (1a) and (1b) are Passes vs Teams,
Figure (2a) and (2b) are Possession vs Teams and Figure (3a) and (3b) are
Corners vs Teams
Cavani and Peredes scored. This fixture at Manchester City’s home ground was
level in terms of possession(50%) and passing statistics which can be explained
by Man. City’s strong record at home, wherein they lost only 3 out of 18 games
as seen in Figure 1. These results validate our model’s ability to learn about
interactions between features.
The other semi-final was a close fixture between Bayern Munich and Barcelona.
Both teams, being two of the favorites, dominated the stats at home. They es-
tablished a strong home record and the match ended in a draw, with Bayern
decided as winners on the basis of the highest number of shots on target (as per
our chosen method). Another interesting observation was that our model could
not decide the winner in this fixture over both legs, which is expected since
Bayern and Barcelona were favorites to win the competition.
The final was played between Bayern Munich and Paris, where Bayern Mu-
nich emerged victorious. Few exciting observations from this simulation are dis-
cussed as follows: Lewandowski scored two goals for Bayern Munich, making
a substantial contribution to Bayern’s success. Bayern Munich had the highest
9blocks per game in the simulations, which can be explained by Manuel Neuer’s
brilliant performances over the last few years. Finally, the results of our model
are also backed up by the fact that Bayern Munich is one of the strongest teams
in the competition, and had the best form leading up to the knockout stages.
Our model can not only be used for predicting match statistics, but also for
tactical analysis to help teams prepare better. We have shown that our model can
make optimal predictions, and thus teams can use these predictions to be better
prepared against their opposition. For example, in the simulation of a game
between Bayern and Chelsea, our model predicted a significantly large number
of crosses from Bayern, which matches their playing style and also reflects how a
team is likely to play against another. Such analysis can help teams to plan better
by focusing more on defending crosses if it is the opposition team’s expected
mode of attack. In addition, masked relations such as the performance of a
team against relatively aggressive/defensive teams can be analysed and used to
alter tactics accordingly. Finally, in order to verify the robustness of our model,
we present some visualizations in Figure 7. We show the distributions of Passes,
Possession, and Corners in the training data and their distributions in predictions
of our simulation. It is seen that Barcelona and Bayern lead most of these stats
in the training plots, and similar distributions can be seen in the simulations. It
is evident from the plots in Figure 7 that our model is robust and can capture
the information and interactions among features very well.
6 Conclusion and Future Work
Inspired by the recent focus on sports analytics, and curiosity among the commu-
nity on how the current seasons would have concluded, we conducted a simulation
to find out how the rest of the season would pan out. We present UCLData,
which contains data from the UCL games between the seasons 2014-2020. We
also propose a novel architecture that can efficiently capture the information
and interactions within this data and make robust predictions on how individ-
ual matches of the season will pan out. We also propose solutions to handle
some common problems related to data bias. Finally, we predict the results of
the remaining Champions League games and thus predict the winners of this
year’s Champions League.
Future work can focus on giving weightage to the time of the matches, i.e.
older matches will have a lower weightage as compared to the newer ones in
the embedding. Although our model seems to work great on UCLData, it would
be interesting to assess its learning capabilities on future football events and
data from other leagues as well. Our methodology can be extended to predict
other specific statistics such as the exact time of goals. Also, in the cases of a
tied fixture over both legs, a penalty shootout simulation can also be added.
In addition we would like to extend this work to more sporting events in the
future.
10References
1. Roman Voeikov, Nikolay Falaleev, and Ruslan Baikulov. Ttnet: Real-time tem-
poral and spatial video analysis of table tennis. In Proceedings of the IEEE/CVF
Conference on Computer Vision and Pattern Recognition Workshops, pages 884–
885, 2020.
2. H. Shih. A survey of content-aware video analysis for sports. IEEE Transactions
on Circuits and Systems for Video Technology, 28(5):1212–1231, 2018.
3. Robert Rein and Daniel Memmert. Big data and tactical analysis in elite soccer:
future challenges and opportunities for sports science. SpringerPlus, 5, 12 2016.
4. Stylianos Kampakis and William Thomas. Using machine learning to predict
the outcome of english county twenty over cricket matches. arXiv preprint
arXiv:1511.05837, 2015.
5. Alexander P Rotshtein, Morton Posner, and AB Rakityanskaya. Football predic-
tions based on a fuzzy model with genetic and neural tuning. Cybernetics and
Systems Analysis, 41(4):619–630, 2005.
6. Anito Joseph, Norman E Fenton, and Martin Neil. Predicting football results using
bayesian nets and other machine learning techniques. Knowledge-Based Systems,
19(7):544–553, 2006.
7. Lucas Maystre and Victor Kristof. Kickoff.ai uses machine learning to predict the
results of football matches.
8. Anito Joseph, Norman E Fenton, and Martin Neil. Predicting football results using
bayesian nets and other machine learning techniques. Knowledge-Based Systems,
19(7):544–553, 2006.
9. Lucas Maystre, Victor Kristof, Antonio J González Ferrer, and Matthias Gross-
glauser. The player kernel: learning team strengths based on implicit player con-
tributions. arXiv preprint arXiv:1609.01176, 2016.
10. Kou-Yuan Huang and Wen-Lung Chang. A neural network method for prediction
of 2006 world cup football game. In The 2010 international joint conference on
neural networks (IJCNN), pages 1–8. IEEE, 2010.
11. Josip Hucaljuk and Alen Rakipović. Predicting football scores using machine learn-
ing techniques. In 2011 Proceedings of the 34th International Convention MIPRO,
pages 1623–1627. IEEE, 2011.
12. S Mohammad Arabzad, ME Tayebi Araghi, S Sadi-Nezhad, and Nooshin Ghofrani.
Football match results prediction using artificial neural networks; the case of iran
pro league. Journal of Applied Research on Industrial Engineering, 1(3):159–179,
2014.
13. Andrew M Flitman and Enn S Ong. Using neural networks to predict afl game
outcomes. In IEEE Conference on Computational Intelligence and Multimedia
Applications, pages 291–295. Griffith, 1997.
14. Leonard Richardson. Beautiful soup documentation. April, 2007.
15. Sean Forman and Mike Kania. Football statistics and history. https://fbref.
com/en/.
16. Global sports archive. https://globalsportsarchive.com.
17. David E Rumelhart, Geoffrey E Hinton, and Ronald J Williams. Learning internal
representations by error propagation. Technical report, California Univ San Diego
La Jolla Inst for Cognitive Science, 1985.
11You can also read