Ultra-low surface temperatures in East Antarctica from satellite thermal infrared mapping: the coldest places on Earth
←
→
Page content transcription
If your browser does not render page correctly, please read the page content below
Ultra-low surface temperatures in East Antarctica from satellite thermal infrared
mapping: the coldest places on Earth

T. A. Scambos1, G. G. Campbell1, A. Pope1, T. Haran1, A. Muto2
M. Lazzara3, C. H. Reijmer4 and M. R. van den Broeke4

1
 National Snow and Ice Data Center, University of Colorado at Boulder, Boulder CO 80303
USA. 2 Department of Earth and Environmental Science, Temple University, Philadelphia,
PA 19122 USA. 3 Antarctic Meteorological Research Center, University of Wisconsin-
Madison and Madison Area Technical College, Madison, WI 53706 USA. 4 Institute for
Marine and Atmospheric Research, Utrecht University, Utrecht NL-3584, Netherlands
Corresponding author: Ted Scambos (teds@nsidc.org)

Key Points:
• surface temperatures below the Vostok record low 2 m air temperature are observed at
multiple sites near the East Antarctic ice divide
• lowest surface temperatures, ~-98°C, are in high-elevation shallow topographic depressions,
with inferred 2m air temperatures of ~-94±4°C
• clear-air downwelling thermal emission and heat conduction from sub-surface snow appear
to control the low-temperature limit

This article has been accepted for publication and undergone full peer review but has not been
through the copyediting, typesetting, pagination and proofreading process which may lead to
differences between this version and the Version of Record. Please cite this article as doi:
10.1029/2018GL078133

                                    © 2018 American Geophysical Union. All rights reserved.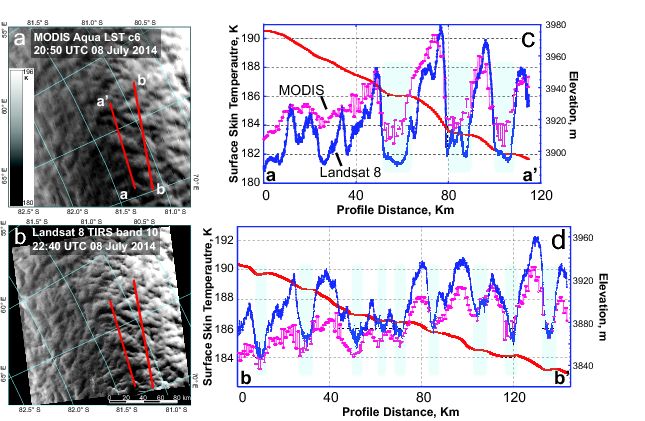
Abstract
We identify areas near the East Antarctic ice divide where
heat exchange. A steep thermal gradient is also produced in the near-surface snow and firn
layer by the surface radiative cooling (Weller & Schwerdtfeger, 1977; King et al., 1996),
driving intense vapor transport and recrystallization in the upper snow layers (Albert et al.,
2004).
Extensive literature has described the formation of temperature inversions over ice sheets
(Philpot & Zillman, 1970; Hudson & Brandt, 2005), but only a few studies describe the
meteorology and other conditions of the very coldest events (Stepanova, 1963; Turner et al.,
2009). An earlier study identified the highest surface temperatures on Earth (three sites are
essentially tied, two in Iran and one in Algeria; Mildrexler et al., 2006), but concerns about
cloud contamination limited attempts to identify record low temperature sites from satellite
data over ice sheets. The recognition here that the coldest Antarctic conditions occur under a
clear atmospheric column allows us to explore the climate, geography, and near-surface
conditions at the coldest places on Earth.
2 Methods and Data
Satellite-derived thermal emission temperature data from Moderate-resolution
Spectroradiometer (MODIS) Land Surface Temperature data (LST); both MOD11 (from
Terra) and MYD11 (from Aqua) data sets) were used to evaluate the location and frequency
of very low temperatures in Antarctica (Figure 1; Figure S1a). A pilot study using Advanced
Very High Resolution Radiometer data (AVHRR) confirmed the general locations and value
of very low surface temperatures (Figure S1b). We extracted minimum temperatures in the
LST satellite swath data south of 70°S (gridded to a 1-km polar stereographic projection)
between 15 June to 15 September for a 12-year period (2004-2016; MOD11 Collection 6, and
MYD11, Collections 5 and 6; Wan, 2006; Wang et al., 2013). The 2004 winter was the earliest
MODIS Collection 6 data available at the time we began our analysis. We used the LST cloud
mask, although this by itself is only partially effective. Terra MOD11 Collection 5 (hereafter,
MOD11 c5) does not contain surface temperatures below 200 K (-73.15°C) because they were
assumed to be cloud-contaminated. This was adjusted in MOD11 c6. Aqua MYD11 reports
lower temperature values in c5 because problems with the Aqua MODIS band 6 (1640 nm)
compromised high cloud detection. The Terra MOD11 cloud mask, using a functioning band
6, also masked clear-sky observations of very low surface temperatures. The Aqua MYD11
masking protocol did not mask observations of the lowest surface temperatures (Gladkova et
al., 2013) and we show that many of these are cloud-free (Figure S1 and S2). Initial assessments
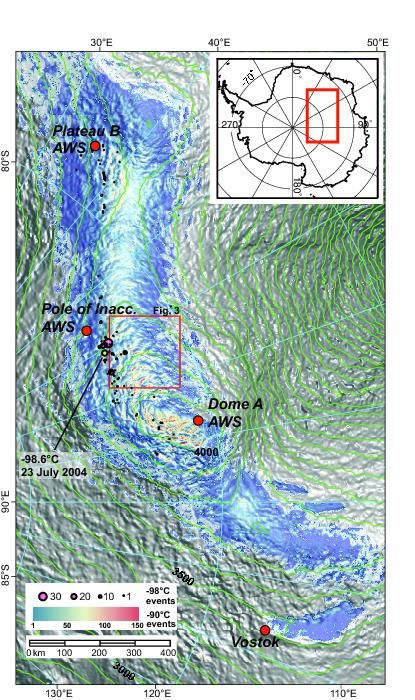
© 2018 American Geophysical Union. All rights reserved.using MYD11 c5 data produced results similar to MOD11 c6, but masking of temperatures below 180 K (-93.15°C) in MYD11c5 eliminated the very lowest values. The extracted grids of minimum 1982-2000 and 2004-2016 temperatures (AVHRR and MODIS) reveal that above ~3250 m elevation, the spatial pattern of the lowest temperatures represents an image of the local surface topography interacting with the near-surface air inversion, and is not perceptibly obscured or modified by cloud thermal patterns. This was confirmed by comparison with the visible-band MODIS Mosaic of Antarctica (MOA2009; Haran et al., 2014), and a satellite-derived digital elevation model (Bamber et al., 2009; Figure S2). The high correlation with surface morphology indicates that the lowest temperatures occur under clear-sky conditions and are colder than any discernable clouds. The lowest surface snow temperature in the MYD11 and MOD11 c6 data spanning 2004-2016 is -98.6°C (Figure 2a: 22 July, 2004; 82.07°S, 60.72°E). However, temperatures ranging between -98.0°C and -98.6°C were recorded at ~100 sites during the study period (MYD11 c6 data; Figure 1). Elevation and minimum surface temperature profiles in the region of the cold sites show that the highest number of low temperature observations (
temperature at Vostok during our 2004-2016 LST data analysis period occurred on 15
September 2012, at -83.3°C. Four surface snow temperature events of
good observational geometry). The difference between air temperatures in the lowest 2 to 4 m
and local surface snow temperatures under cold conditions is approximately 1 to 2°C m-1,
except for Dome A AWS where the mean gradient is 2 to 11°C m-1 for the multiple air
temperature sensor heights (~4.4 m to 0.1 m; Table 1 and S1).

The air temperature profile can be used as an independent estimate of surface temperature for
comparison with LST temperatures, assuming that at the exact surface, air temperature and
snow temperature are identical. Although the data show that the vertical temperature profile
can be significantly non-linear, it is highly variable, primarily in the last few decimeters. We
use a linear extrapolation to arrive at a surface (0 m) air temperature estimate (Table S1). The
weighted mean linear air-to-surface air temperature gradient in the lowest ~3.4 meters is 2.7°C
m-1, ranging between 1.8 and 3.7°C m-1. Comparing a surface temperature extrapolated from
the mean air temperature gradient to the LST surface thermal emission temperatures under
similar conditions (Table 1, Dome A values) indicates that the MODIS-based LST c6 data is
approximately 0.4°C to 2.8°C degrees lower than the extrapolated air temperature. Given the
uncertainty of this estimate, and the wide range of possible near-surface air temperature
gradients, and the selected LST error of
flank or dome sites, since air drainage is reduced.

4 Results
Figure 1 shows that a broad area along the main ice divide of the East Antarctic Plateau above
~3500 m has had mid-winter surface snow thermal emission temperatures (as measured by
MODIS LST) below -90°C as often as 150 times over the 2004-2016 study period. Sites of
frequent -90°C and lower temperatures are always flat or shallow depressions (few meters
closure) on the flanks of the ice divide (Figure 1, S2, and S3). The lowest temperature observed
in the data set is -98.6°C, on 23 July 2004. Several small (~10 to 200 km2) closed basins near
the Pole of Inaccessibility have up to thirty -98°C events in the 2004-2016 LST record.
However, ~100 distinct sites (separate clusters of grid cells) in our 2004-2016 compilation
show reported surface temperatures of -98°C or less. With our estimated error and analysis of
the near-surface air temperature gradient, this implies a large number of sites have reached
approximately -94 ±4°C air temperatures at 2 m above the surface, in some cases, more than
ten times.

Surface snow temperature patterns near the region of very low temperatures were examined in
greater spatial detail using Landsat-8 Thermal Infrared Sensor (TIRS) data (Roy et al., 2014;
Figure 3). Forty-six TIRS images covering the East Antarctic Dome A to Dome F region (the
East Antarctic ice divide) were acquired during the 2013, 2014, and 2015 austral winters. TIRS
produces gridded thermal image data at ~100 m spatial resolution and 12-bit radiometric
resolution. Calibration of TIRS is still ongoing, and there are several issues with the sensor (we
used data corrected by the processing described in Gerache and Montanaro, 2017). We used
the TIRS 10 µm sensor (band 10) as a relative thermal emission temperature mapper only,
calibrating the reported thermal radiances to temperatures that regionally matched MODIS LST
data.

The MODIS-adjusted TIRS data indicate that very strong thermal gradients exist at the
boundaries of ultra-cold pocket areas (>6°C km-1 horizontally; >4°C m-1 vertically, using
Bamber et al. 2009 DEM, and airborne elevation profiles from Bell et al., 2011). The TIRS
data also reveal the cold pocket areas have a more uniform low temperature (±1 °C) across the
topographic lows (5 to 15 km across) than seen in MODIS LST data. Thermal gradients are
largest on the uphill sides of the topographic depressions (Figure 3c, 3d; Figure S3).

                                     © 2018 American Geophysical Union. All rights reserved.
The total areal extent of very low surface temperatures on the East Antarctic Plateau is observed to vary greatly from year to year in our 2004-2016 winter months data set. We summed the total LST grid cell areas that reached -83°C or below, and -90°C or below for July and August over the study period. The years with the highest total area for these temperature ranges were 2004, 2008, and 2015, with ~250 to 310 x103 km2-days reaching -83°C or below each month in each those years, and up to 22 x103 km2-days reaching -90°C or below. The years 2007, 2009, and 2011 had very low totals, less than 20 x103 km2-days of -83°C or below, and just a few grid cells (
controlled by the presence of stratospheric ice clouds, which constitute a fraction of PSCs. Ice
PSC cloud fractions are 0.05 to 0.15 for 2006-2014, and have an opacity of 0.4 to 0.9 (Pitts et
al., 2009; Pitts and Poole, 2015). Atmospheric profiles for the East Antarctic troposphere and
stratosphere from balloon-borne rawinsonde data from Amundsen-Scott South Pole Station
(https://www.esrl.noaa.gov/gmd/dv/spo_oz/movies/index.html) indicate that the annual
minimum temperature in the upper atmosphere (18 to 23 km) is ~-92 to -95°C, and is typically
reached in mid- to late July. CALIPSO observations show the minimum observed temperature
of PSCs is ~-90°C (Pitts et al., 2009). These temperatures are similar to or slightly above our
estimate of the corrected minimum surface temperatures for the -98°C LST observations. Ice
clouds as observed by CALIPSO would likely constrain cooling of the surface as the surface
approached the temperature of the clouds. However, the low frequency of occurrence of ice
PSCs means that any moderation of surface temperature evolution would be intermittent and
infrequent.
We next consider the thermal emission balance of the polar snow surface under clear night
skies as temperatures approach the lowest values (Figure S6). Radiance of the snow surface
upward is essentially that of a black-body (= 0.997 to 0.999). At surface snow temperatures
above about -55°C, much of the spectrum of thermal emission is within the broad high-
transmittance range for the atmosphere between 7 and 13µm wavelength (-55°C peak emission
is 13.3µm). At temperatures of -75°C and below, the peak emission shifts into a CO2 absorption
band between 13.5 and 17.5µ wavelength (-75°C peak emission is 14.6 µm; -95°C peak is 16.3
μm). In this range, much of the emitted thermal radiation from the surface is absorbed by CO2
in the near-surface atmosphere and re-radiated downward. This slows the rate of surface
cooling, as observed in the time-series LST data in Figures 2 and S4.
Under typical conditions, water vapor in the air column absorbs radiation at wavelengths longer
than the CO2 band (i.e., in the far infrared). However, during much of the polar winter, the East
Antarctic Plateau experiences extremely low levels of precipitable water, generally below 0.5
mm (Thomas et al., 2011) and in the East Antarctic ice divide region, often below 0.2 mm,
with periods as low as 0.04 mm (Yang et al., 2010). These periods of atmospheric clarity and
extremely dry air permit further radiative emission loss from the 17.5 µm and higher
wavelength regions. Models of atmospheric transmissivity and emissivity under these
conditions (e.g., Berk et al., 2014) show that clear-air downwelling radiation is strongly
© 2018 American Geophysical Union. All rights reserved.dependent on water vapor. Examining several model runs of MODTRAN® using conditions
similar to those observed for the ultra-cold sites (Figure S6) shows that net differences in
upwelling and downwelling radiation become very small, e.g., 10.4 W/m2 for -95°C near-
surface air temperature (with an air column temperature profile similar to the annual minimum
at South Pole), -95°C surface snow temperature, and ~0.1 mm precipitable water (10 atm-cm).
A model of the subsurface snow and firn temperature profile, snow surface emissivity, and
snow thermal conductivity under these emission conditions (adapted from Muto et al., 2011),
using an initial snow surface temperature of -75°C, showed that the surface temperature reaches
-97°C after 5 days. However, at that point, cooling rates of the surface are ~0.02°C/hour and
decreasing with time, essentially setting a low temperature limit. Higher levels of water vapor
in the air column prevent the surface from reaching -95°C in the model, even with low air
temperatures. Both downwelling radiation and heat conduction from the upper firn limits the
pace of surface cooling.
5 Conclusion
A broad area of the upper East Antarctic ice divide regularly experiences surface snow
temperatures of -90°C and below, with isolated topographic lows along the uppermost south
side of the divide crest reaching observed temperatures (recorded in MODIS LST data) of -
98.0 to -98.6 ±1 °C. Comparison with the nearest AWS and station data imply near-surface (2
m) air temperatures of -94±4°C at the ultra-cold sites after applying estimated corrections for
MODIS LST bias and near-surface air temperature gradients. Ultra-low temperature events in
Antarctica are more common during strong circumpolar circulation periods (and thus positive
SAM index).
Our conceptual model for the record-setting surface temperatures (Figure S7) starts with strong
radiative cooling of the snow surface and a strong surface-based temperature inversion, leading
to downhill drainage of a near-surface air layer. The cold air collects in local topographic lows,
allowing the surface snow in these sites to cool still further by reducing the advection
(downward or laterally) of less chilled air. We suspect that the near-surface air temperature
gradient may be less steep within the topographic lows, making it likely that these record low
snow temperatures underlie record cold air at 2 m. Adjacent higher-elevation dome and flank
areas of the ice surfacer are not able to cool as much because divergent drainage of the near-
surface air leads to subsidence, exposing the surface to warmer air from higher in the inversion
© 2018 American Geophysical Union. All rights reserved.layer. Cooling proceeds as long as clear atmospheric and low wind speed conditions remain,
but cooling to ~-98°C requires light winds, clear skies and very low atmospheric water vapor
(~0.1 mm precipitable water) to persist for several days. Surface snow cooling rates are near-
zero (~0.02°C hour-1) as this limit is approached.
The radiative processes that control record low surface and air temperatures, and the changing
composition of the atmosphere, imply that in the future we may see fewer extreme low
temperature events. This is due to the ongoing increase in gases such as CO2 , and to increased
water vapor in the Antarctic atmosphere as a secondary effect.
Acknowledgements
Land surface thermal emission data used in this study (MOD11 and MYD11, collection 6) are
available from, e.g., https://modis.gsfc.nasa.gov/data/dataprod/mod11.php. Weather station
data used here is available from Institute for Marine and Atmospheric Research, Physics and
Astronomy Department, Utrecht University, the National Center for Environmental
Information, and the Australian Antarctic Data Centre at
https://data.aad.gov.au/metadata/records/ DomeA_AWS. Landsat imagery is available from
https://earthexplorer.usgs.gov. This research was supported by USGS award G12PC00066 and
NASA awards NNX14AM54G and NNX14AH79G to TAS, and NSF ANT-154335 to MAL.
We thank Craig Kulessa and Michael Ashley for informative discussions based on their data
from Ridge A in East Antarctica.
References
Adolph, A. C., Albert, M. R., & Hall, D. K. (2018), Near-surface temperature inversion during
summer at Summit, Greenland, and its relation to MODIS-derived surface temperature. The
Cryosphere, 12, 907-920, doi:10.5194/tc-12-907-2018
Albert, M. R., Shuman, C. A., Courville, Z., Bauer, R., Fahnestock, M. A., & Scambos, T.
(2004), Extreme firn metamorphism: impact of decades of vapour transport on near-surface
firn at a low-accumulation glazed site on the East Antarctic plateau. Annals of Glaciolgy 39(1),
73-78, doi: 10.3189/172756404781814041
Bamber, J. L., Gomez-Dans, J. L., & Griggs, J. A. (2009), A new 1 km digital elevation model
of the Antarctic derived from combined satellite radar and laser data–Part 1: Data and methods.
The Cryosphere, 3(1), 101-111, doi:10.5194/tc-3-101-2009
Bell, R. E., Ferraccioli, F., Creyts, T. T., Braaten, D., Corr, H., Das, I., ... & Wolovick, M.
© 2018 American Geophysical Union. All rights reserved.(2011), Widespread persistent thickening of the East Antarctic Ice Sheet by freezing from the
base. Science, 331(6024), 1592-1595, doi:10.1126/science.1200109
Berk, A., Conforti, P., Kennett, R., Perkins, T., Hawes, F. & van den Bosch, J. (2014),
MODTRAN® 6: A major upgrade of the MODTRAN® radiative transfer code. In
Hyperspectral Image and Signal Processing: Evolution in Remote Sensing (WHISPERS), 2014
6th Workshop on (1-4). IEEE, doi:10.1109/WHISPERS.2014.8077573
Campbell, G. G., Pope, A., Lazzara, M., & Scambos, T. A. (2013), The coldest place on Earth:
-90°C and below in East Antarctica from Landsat 8 and other thermal sensors, Abstract C21D-
0678 presented at the 2013 Fall Meeting, AGU, San Francisco, CA, 9-13 Dec.
Dozier, J. & Warren, S., G. (1982), Effect of viewing angle on the infrared brightness
temperature of snow. Water Resources. Research, 18(5), 1424–1434,
doi:10.1029/WR018i005p01424
Hall, D., Comiso, J. C., DiGirolamo, N. E., Shuman, C. A., Box, J. E., & Koenig, L. (2013),
Variability in the surface temperature and melt extent of the Greenland ice sheet from MODIS.
Geophysical Research Letters, 40, doi:10.1002/grl.50240
Haran, T. M., Bohlander, J. C., Scambos, T. A., Painter, T., & M. Fahnestock (2005, updated
2013), MODIS Mosaic of Antarctica 2003-2004 (MOA2004) Image Map, Version 1. Boulder,
Colorado USA. National Snow and Ice Data Center. doi:10.7265/N5ZK5DM5
Hudson, S. R., & Brandt, R. E. (2005), A look at the surface-based temperature inversion on
the Antarctic Plateau, Journal of Climate, 18(11), 1673-1696, doi:10.1175/jcli3360.1
Gerace, A., & Montanaro, M. (2017), Derivation and validation of the stray light correction
algorithm for the thermal infrared sensor onboard Landsat 8. Remote Sensing of
Environment, 191, 246-257, doi:10.1016/j.rse.2017.01.029
Gladkova, I., Shahriar, F., Grossberg, M., Frey, F., & Menzel, W. P. (2013), Impact of the
Aqua MODIS band 6 restoration on cloud/snow discrimination. Journal of Atmospheric and
Oceanic Technology, 30(12), 2712-2719. doi:10.1175/JTECH-D-13-00066.1
King, J. C., Anderson, P., Smith, M., & Mobbs S. (1996), The surface energy and mass balance
at Halley, Antarctica during winter. Journal of Geophysical Research Atmospheres (1984–
2012), 101(D14), 19119-19128, doi:10.1029/96JD01714
Marshall G. J. (2003), Trends in the Southern Annular Mode from observations and reanalyses.
Journal of Climate, 16: 4134‒4143, doi:10.1175/1520-0442(2003)016
Marshall, G. and National Center for Atmospheric Research Staff (Eds). Last modified 10 Jun
2016. "The Climate Data Guide: Marshall Southern Annular Mode (SAM) Index (Station-
based)." Retrieved from https://climatedataguide.ucar.edu/climate-data/marshall-southern-
annular-mode-sam-index-station-based
Mildrexler, D. J., Zhao, M., & S. W. Running (2006), Where are the hottest spots on Earth?
Eos 87(43), 461-467, doi:10.1029/2006EO430002
Muto, A., Scambos, T.A., Steffen, K., Slater, A.G. & Clow, G.D. (2011), Recent surface
temperature trends in the interior of East Antarctica from borehole firn temperature
measurements and geophysical inverse methods. Geophysical Research Letters, 38(15),
doi:10.1029/2011GL048086
Parish, T. R., & Bromwich, D. H., (1987), The surface windfield over the Antarctic ice sheets.
Nature 328(6125), 51-54, doi:10.1038/328051a0
© 2018 American Geophysical Union. All rights reserved.Phillpot, H. R., & Zillman, J. W. (1970), The surface temperature inversion over the Antarctic
continent. Journal of Geophysical Research 75(21), 4161-4169, doi:
10.1029/JC075i021p04161
Pitts, M. C., Poole, L. R., & Thomason, L. W. (2009), CALIPSO polar stratospheric cloud
observations: second-generation detection algorithm and composition discrimination.
Atmospheric Chemical Physics 9, 7577-7589, doi:10.5194/acp-9-7577-2009
Pitts, M.C. and Poole, L.R. (2015), CALIPSO Polar Stratospheric Cloud Observations from
2006-2015; (2015), European Geosciences Union General Assembly; 12-17 Apr. 2015;
Vienna; Austria, Abstract AS3.12-5899; NASA Technical Report NF1676L-21147
Roy, D.P., Wulder, M.A., Loveland, T.R., Woodcock, C.E., Allen, R.G., Anderson, M.C.,
Helder, D., Irons, J.R., Johnson, D.M., Kennedy, R. & Scambos, T.A. (2014), Landsat-8:
Science and product vision for terrestrial global change research. Remote Sensing of
Environment, 145, 154-172, doi:10.1016/j.rse.2014.02.001
Salisbury, J., D’Aria, D. M., & Wald, A. (1994), Measurements of thermal infrared spectral
reflectance of frost, snow, and ice. Journal Geophysical Research 99(B12), 24,235-24,240,
doi:10.1029/94JB00579
Scambos, T. A., Haran, T. M., & Massom, R. A. (2006), Validation of AVHRR and MODIS
ice surface temperature products using in situ radiometers. Annals of Glaciology, 44(1), 345-
351, doi:10.3189/172756406781811457
Shuman, C. A., Hall, D. K., DiGirolamo, N. E., Mefford, T. K., & Schnaubelt, M. J. (2014),
Comparison of near-surface air temperatures and MODIS Ice Surface Temperatures at Summit,
Greenland (2008-13). Journal of Applied Meteorology and Climatology, 53, 2171-2180,
doi:10.1175/JAMC-D-14-0023.1
Stepanova, N. A., (1963), The world’s lowest temperature record. Weatherwise, 16(6), 268-
269, doi:10.1080/00431672.1963.9930038
Thomas, I.D., King, M.A., Clarke, P.J., & Penna, N.T. (2011), Precipitable water vapor
estimates from homogeneously reprocessed GPS data: An intertechnique comparison in
Antarctica. Journal of Geophysical Research: Atmospheres, 116(D4),
doi:10.1029/2010JD013889
Turner, J., Anderson, P., Lachlan‐Cope, T., Colwell, S., Phillips, T., Kirchgaessner, A.,
Marshall, G.J., King, J.C., Bracegirdle, T., Vaughan, D.G. & Lagun, V. (2009), Record low
surface air temperature at Vostok station, Antarctica. Journal of Geophysical Research 114,
D24102, doi:10.1029/2009JD012104
Van den Broeke, M. R. and N. P. M. van Lipzig, 2003: Factors controlling the near-surface
wind field in Antarctica, Monthly Weather Review 131, 733-743.
Wan, Z. (2006), MODIS Land Surface Temperature Products User’s Guide”, Santa Barbara,
CA, http://www.icess.ucsb.edu/modis/LstUsrGuide_v5/
MODIS_LST_products_Users_guide.pdf.
Wan, Z. (2014), New refinements and validation of the collection-6 MODIS land surface
temperature/emissivity product. Remote Sensing of Environment, 140, 36-45. doi:
10.1016/j.rse.2013.08.027
Wang, X. & Key, J. (2005), Arctic surface, cloud, and radiation properties based on the
AVHRR Polar Pathfinder data set. Part I: Recent trends. Journal of Climate, 18(14), 2575-
2593, doi: 10.1175/JCLI3438.1
© 2018 American Geophysical Union. All rights reserved.Wang, Y., Wang, M., & Zhao, J. (2013), A comparison of MODIS LST retrievals with in situ
observations from AWS over the Lambert Glacier basin, East Antarctica. International Journal
of Geosciences 4, 611-617, doi:10.4236/ijg.2013.43056.
Weller, G. & Schwerdtfeger, P. (1977), Thermal Properties and Heat Transfer Processes of
Low-Temperature Snow. In Meteorological Studies at Plateau Station, Antarctica, P. C.
Dalrymple, A. J. Riordan, A. Riordan, A. J. Riordan, G. Weller, H. H. Lettau, H. Lettau, L. A.
Stroschein, L. S. Kundla, L. A. Stroschein, M. Kuhn, P. Schwerdtfeger, R. C. Lile and U. Radok
eds, American Geophysical Union, Washington, D. C., pp. 27-34, doi:
10.1002/9781118664872.ch3.
Yang, H., Kulesa, C.A., Walker, C.K., Tothill, N.F., Yang, J., Ashley, M.C., Cui, X., Feng, L.,
Lawrence, J.S., Luong-Van, D.M. & McCaughrean, M.J. (2010), Exceptional terahertz
transparency and stability above Dome A, Antarctica. Publications of the Astronomical Society
of the Pacific, 122(890), 490-494, doi:10.1086/652276.
© 2018 American Geophysical Union. All rights reserved.Figure 1 . Shaded relief map of the Dome Fuji – Dome Argus region of the East Antarctic plateau with red-yellow-blue color scale indicating occurrences of thermal emission surface temperatures
Figure 2. MODIS LST time-series data for single grid cells from swath data for selected ultra-
cold events on the East Antarctic Plateau. Upper part of the panels show MODIS LST grid cell
time-series of surface temperature versus time in hours. ‘LST A 005’ refers to MYD11 c5 data
in the panels; the other data are LST c6. Lower section of the panels indicate off-nadir viewing
angle for the MODIS LST swaths. Error bars for the LST data set are based on viewing
parameters and estimated water vapor in the view path.

                                    © 2018 American Geophysical Union. All rights reserved.
Figure 3. Comparison of mid-winter Aqua MODIS LST c6 (a) and Landsat 8 TIRS band 10
(b) image data adjusted to match MODIS LST regionally, under clear sky and low
temperature conditions; c and d, MODIS LST (pink line) and Landsat 8 TIRS (blue line)
temperatures and elevation (red line) profiles (a-a’ and b-b’ in image panels; elevation for a-
a’ from Bamber et al., 2009; for b-b’, Bell et al., 2011). Light blue shaded regions mark areas
of flat or reverse slope.
© 2018 American Geophysical Union. All rights reserved.Table 1. Winter Air Temperaturea and Surface Snow Temperatureb Measurements 2008-2015
Vostok Plateau B Pole Inacc. Dome Ac
78.45°S, 106.83°E 78.65°S, 35.64°E 82.11°S, 55.03°E 80.37°S, 77.37°E
3488 m 3620 m 3730 m 4084 m
2008-2015 2008-2015 2008-2015 high 2008-2014 low
Air temperature mean height, m: 2.0 4.08 4.13 3.42 1.42 0.42
Air temperature height range, m: - (4.4-3.7) (4.4-3.7) (3.6-3.1) (1.6-1.1) (0.59-0.09)
d
Lowest air temperature -83.3 -84.1 -84.6 -77.0 -78.3 -79.1
Lowest surface temperaturee -85.1 -89.9 -88.3 -88.0 -88.0 -86.8
Mean Air Temperature, °C
during MODIS Aqua passes: -74.1 (171) -74.3 (1736) -74.2 (2942) -68.4 (1999) -70.3 (2507) -73.5 (1589)
during MODIS Terra passes: -73.8 (163) -73.6 (916) -72.9 (1159) -68.5 (1312) -70.4 (1604) -73.3 (1630)
Mean LST Temperature, °C
during MODIS Aqua passes: -78.2 -79.9 -79.1 -78.4 -78.9 -78.1
during MODIS Terra passes: -76.9 -77.8 -76.8 -76.5 -76.5 -76.5
Mean Air - LST gradientf, °C m-1
AWS -- MODIS Aqua: 2.05 1.36 1.21 2.92 6.06 10.95
AWS -- MODIS Terra: 1.52 1.03 0.93 2.34 4.30 7.62
a
Extracted from AWS and station data, 15 June – 15 September, for air temperaturesYou can also read