1H17 HALF-YEAR RESULTS - 24 FEBRUARY 2017 - NEXTDC

Page created by Elaine Erickson
 
CONTINUE READING
1H17 HALF-YEAR RESULTS - 24 FEBRUARY 2017 - NEXTDC
1H17 HALF-YEAR RESULTS
24 FEBRUARY 2017         NEXTDC LIMITED ACN 143 582 521
1H17 HALF-YEAR RESULTS - 24 FEBRUARY 2017 - NEXTDC
1H17 HIGHLIGHTS

              REVENUE        EBITDA          UTILISATION

        $58.7m             $23.9m           30MW
               +39%         +110%             +32%

           CUSTOMERS        PARTNERS      INTERCONNECTIONS

                699         300+             5,472
               +23%       50+ NETWORKS        +42%

NEXTDC 1H17 Results                                          2
1H17 HALF-YEAR RESULTS - 24 FEBRUARY 2017 - NEXTDC
1H17 highlights (cont)

                                   Revenue from continuing operations up $16.6m1 (39%)1 to $58.7m
                      Solid
                      revenue      Contracted utilisation up 7.2MW2 (32%)2 to 30.0MW
                      growth
                                   Interconnection up 1,6292 (42%)2 to 5,472, representing 5.5% of recurring revenue

                                   EBITDA up $12.5m1 (110%)1 to $23.9m
                      Strong
                      operating    Operating cash flow up $19.5m1 to $25.4m
                      leverage
                                   Profit before tax up $7.4m1 to $8.0m

                                   $75.7m of capital invested in 1H17
                      Network
                      expansion    B2 and M2 on track to achieve practical completion towards the end of 2H17
                      on target
                                   S2 site under contract with development approvals in progress

    1.   Compared to 1H16
    2.   Since 31 December 2015

NEXTDC 1H17 Results                                                                                                     3
1H17 HALF-YEAR RESULTS - 24 FEBRUARY 2017 - NEXTDC
Agenda
 1H17 Financial results
 1H17 Business performance
 FY17E Outlook
 Appendices

                              4
1H17 HALF-YEAR RESULTS - 24 FEBRUARY 2017 - NEXTDC
FY17
     Half-Year Results

Financial results

                         5
1H17 HALF-YEAR RESULTS - 24 FEBRUARY 2017 - NEXTDC
1H17 profit and loss summary
                                                                                         1H17         1H16       Change

     Statutory financial results:                                            Note         ($m)        ($m)          ($m)

     Revenue from continuing operations:

     Data centre services revenue                                                         56.0         41.3          14.7                   Data centre services
     Other revenue                                                                          2.8         0.8           1.9

     Total revenue from continuing operations                                             58.7         42.1          16.6
                                                                                                                                                 REVENUE
     Profit before tax                                                                      8.0         0.6           7.4
                                                                                                                                                   36%
     Profit after tax attributable to members                                  1          19.3          0.6          18.6

                                                                                                                                             110% EBITDA growth on 36%
     Non-statutory financial highlights include:                               2                                                              increase in data centre services
                                                                                                                                              revenue
     EBITDA                                                                    3          23.9         11.4          12.5
                                                                                                                                             Direct costs (predominantly
     EBIT                                                                                 13.1          3.8           9.2
                                                                                                                                              power) continue to rise in line
                                                                                                                                              with the take-up of contracted
                                                                                                                                              customer capacity
     Operating costs

     Direct costs (power and consumables)                                                   7.0         3.7           3.4                    Expect a modest increase in the
                                                                                                                                              cost base in 2H17 as the
     Facility costs (data centre rent, property costs, maintenance,                       13.2         13.2         (0.0)                     company continues to invest in
     facility staff, other)                                                                                                                   business transformation
     Corporate overheads                                                       4          12.3         13.1         (0.8)                     projects and brings operational
                                                                                                                                              staff into the new facilities
     Total operating costs                                                                32.5         29.9           2.6

1.     Profit after tax includes an income tax benefit of $11.3 million associated with the recognition of deferred tax assets, which resulted in a one-off increase in profit after tax
2.     Non-statutory financial metrics have been extracted from the reviewed accounts
3.     EBITDA is a non-statutory metric representing earnings before interest, tax, depreciation and amortisation
4.     Corporate overhead includes costs related to all sales and marketing, centralised customer support, project management and product development, site selection due diligence
       and sundry project costs, provisions, as well as investments in growth initiatives including partner development, customer experience and systems

NEXTDC 1H17 Results                                                                                                                                                                        6
1H17 HALF-YEAR RESULTS - 24 FEBRUARY 2017 - NEXTDC
Strong asset base

                                                   31 December 2016             30 June 2016
                                                                   ($m)                   ($m)      Cash flow profile
 Cash and term deposits                                           276.5                  191.4                                           $146.1m          $86.4m

 Property, plant, equipment                                       365.9                  302.7

 Net assets                                                       501.8                  333.1                                                                                $276.5m

                                                                                                                         $25.4m
                                                                                                        $191.4m

   Operating cash flow of $25.4m achieved in 1H17
   Raised $150m of equity (before transaction costs) for S2
    development                                                                                     Cash and term Cash flow from        Financing
                                                                                                                                                     1
                                                                                                                                                         Investing
                                                                                                                                                                      2
                                                                                                                                                                           Cash and term
                                                                                                    deposits as at 1 operations         activities       activities       deposits as at 31
   $100m senior debt facility with NAB remains undrawn                                               July 2016                                                           December 2016
   Option to refinance $160m Notes I and II in June 2017 and every
    six months thereafter

    1.   Cash flows from financing activities include proceeds the issue of shares less transaction costs, other costs relating to finance facilities and finance lease payments
    2.   Adjusted for payments for term deposits of $146.5m

NEXTDC 1H17 Results                                                                                                                                                                           7
1H17 HALF-YEAR RESULTS - 24 FEBRUARY 2017 - NEXTDC
Continued sales momentum drives revenue and EBITDA growth

                36% revenue growth on 1H16                                                                        110% EBITDA growth on 1H16

  Recurring and project revenue1                                                                      EBITDA3                                                                $23.9m
                                                                               $56.0m
         Project revenue2                                                                                EBITDA
         Recurring revenue

                                                                     $48.0m
                                                                                                                                                                    $16.4m

                                                          $41.3m

                                                                                                                                                           $11.4m

                                                $31.9m

                                                                                                                                                  $5.0m
                                      $26.7m
                                                                                                                                       $3.0m

                             $18.9m

                   $11.4m

                                                                                                                             ($6.0m)
     $5.2m

                                                                                                                  ($10.1m)
                                                                                                       ($11.5m)
     2H13          1H14      2H14     1H15       2H15      1H16      2H16       1H17                    2H13       1H14      2H14      1H15       2H15      1H16    2H16     1H17

    1.      Data centre services revenue excludes interest and data centre development revenue
    2.      Project revenue includes one-off setup costs for new customer fit outs, standard establishment fees for new services, remote hands and other services
    3.      FY13 and FY14 EBITDA excludes building development profit, APDC distributions and fund raising advisory fees

NEXTDC 1H17 Results                                                                                                                                                                   8
1H17 HALF-YEAR RESULTS - 24 FEBRUARY 2017 - NEXTDC
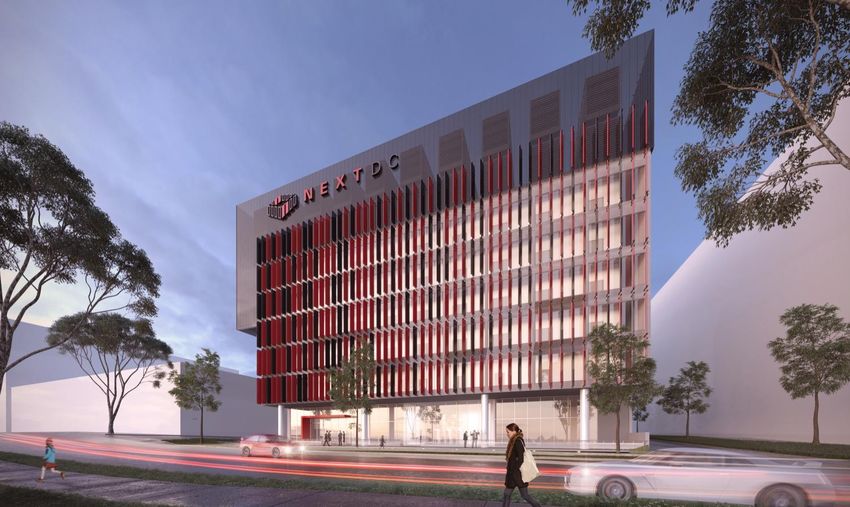
Revenue per unit metrics

                            Annualised revenue per square metre ($)1
                                                                                                          8,837
                                                                                           8,472                                  Demonstrates ongoing growth
                                                                            8,359
                                                                                                                                   in revenue per square metre,
                                                             7,991
                                                                                                                                   noting the deployment of large,
                                             7,452                                                                                 high density, ecosystem
                              7,205
                                                                                                                                   enhancing deals over time
               6,606
                                                                                                                                  New facility developments
                                                                                                                                   designed to take advantage of
                                                                                                                                   industry movements toward
                1H14           2H14           1H15           2H15           1H16            2H16           1H17
                                                                                                                                   higher density requirements

                                                                                                                                  Channel partner engagement
                                                                                                                                   continues to drive higher
                                   Annualised revenue per MW ($m)2                                                                 margin rack ready deployments

                4.49                                                        4.45                                                  Revenue derived from larger
                                                             4.26                                                                  ecosystem enhancing customer
                                                                                            3.98           3.99                    deployments tends to increase
                                              3.90
                               3.73                                                                                                over time as they mature, due
                                                                                                                                   to higher usage of contracted
                                                                                                                                   power capacity, increased
                                                                                                                                   demand for interconnection,
                                                                                                                                   and the use of ancillary services

                1H14           2H14           1H15           2H15           1H16           2H16            1H17

    1.   Revenue reflects data centre services revenue less project revenue. Square metres are the total weighted average square metres utilised during the period
    2.   Revenue reflects data centre services revenue less project revenue. Megawatts reflects the total weighted average megawatt months billed over the period

NEXTDC 1H17 Results                                                                                                                                                    9
1H17 HALF-YEAR RESULTS - 24 FEBRUARY 2017 - NEXTDC
Strong growth in earnings metrics

                            EBITDAR / Data Centre Services Revenue1,2
                                                                                                           57%
                                                                                            51%                    EBITDAR margin is a
                                                                             47%
                                              40%             40%                                                   property-agnostic
                                                                                                                    indicator of underlying
                                                                                                                    profitability
                                9%                                                                                 Continuous
                                                                                                                    improvement in margins
                                                                                                                    reflect the benefit of
               (30%)                                                                                                operating leverage
                1H14           2H14           1H15           2H15           1H16            2H16           1H17

                                       EBITDA / (Net Debt + Equity)2,3
                                                                                                          13.6%
                                                                                           11.3%
                                                                                                                   Demonstrates NEXTDC’s
                                                                            9.1%                                    operating result relative
                                                                                                                    to the capital invested
                                                             4.4%                                                   (net debt + equity)
                                              2.7%
                                                                                                                   Expect near term
                              (5.8%)                                                                                returns to reflect the
                                                                                                                    impact of capital
               (11.7%)
                                                                                                                    invested in new facilities
                                                                                                                    as well as opening costs
                1H14           2H14           1H15           2H15           1H16            2H16           1H17

    1.   EBITDAR represents EBITDA plus data centre rent
    2.   FY14 EBITDA excludes building development profit, APDC distributions and fund raising advisory fees
    3.   Represents annualised EBITDA for the period divided by the average book value of net debt plus equity

NEXTDC 1H17 Results                                                                                                                              10
FY17
       Half-Year Results

Business performance

                           11
Strong growth in customers and connectivity

                                                     Customers
                                                                                         699
                                                                                 647              Strong growth in
                                                                          566                      interconnection drives
                                                                                                   cross connects per
                                                                  478
                                                                                                   customer up 15% to 7.8 at
                                                      375                                          31 December 2016 (from
                                         302                                                       6.8 at 31 December 2015)
                            202
               130
                                                                                                  Growth in cross connects
               2H13         1H14         2H14         1H15       2H15    1H16    2H16    1H17      per customer highlights
                                                                                                   the increasing use of
                                                                                                   hybrid cloud and
                                                                                                   connectivity both inside
                                                    Interconnection1                               and outside the data
                                                 (number of cross connects)                        centre as customers
                                                                                         5,472     expand their ecosystems
                                                                                 4,575
                                                                         3,843
                                                                                                  Ecosystem growth is
                                                                 2,893                             expected to drive higher
                                                     2,198                                         margins and customer
                                                                                                   retention
                                        1,488
                           1,006
              513
              2H13         1H14         2H14          1H15       2H15    1H16    2H16    1H17

    1.   Comprises both physical and elastic cross connections

NEXTDC 1H17 Results                                                                                                            12
Diversified recurring revenue model
                          Customer by industry1,2                                                                          Utilisation by density3
                                    5%
                              6%                              Enterprise                                                                                 More than 6kW
                         7%                                   Cloud                                                                                      4kW to 6kW
                                                              Connectivity                                                                   25%         3kW or less
                                               33%
                                                              System Integrators
                          12%                                                                                              42%
                                                              Government
                                                              Financial Services
                                                              Digital Media
                              17%         20%                                                                                               33%

           Cloud, connectivity and as-a-service partners drive
                                                                                                            Customer power requirements continue to increase
                       strong ecosystem growth

                          Recurring vs project4                                                                              Revenue by facility4
                                                                                                                                        1%

                                   10%                                                                                                 7%
                                                                                                                                                          M1
                                                               Recurring                                                      13%                         S1
                                                               Project                                                                                    B1
                                                                                                                                                   46%
                                                                                                                                                          P1
                                                                                                                                                          C1

                                                                                                                                 32%
                                         90%

          Significant contracted recurring revenue stream with
                                                                                                                      Strong performance in key markets
                   average term greater than four years

    1.   As at 31 December 2016
    2.   Percentages refer to the number of customers belonging to each industry
    3.   Density per rack equivalent. Percentages refer to the proportion of rack equivalents contracted at each density
    4.   Expressed as a percentage of 1H17 data centre services revenue

NEXTDC 1H17 Results                                                                                                                                                      13
Utilisation
      Installed capacity1 vs contracted utilisation                                                          Billing vs contracted utilisation

       87% of installed capacity was contracted at 31 December 2016                                              Contracted utilisation up 7.2MW (32%) to 30.0MW since
                                                                                                                   31 December 20154
       Capacity at S1 is being upgraded from 14.0MW to 15.0MW
                                                                                                                  Billing customer utilisation up 36% since 31 December
                                                                                                                   2015
                   Contracted utilisation (% built)2
     36                                                                           75%      87%              32          Contracted utilisation2
                   P1                                                                                                                                                                       86%
                                                                                                                        Billing customer utilisation3
                   S1
     32                                                                                                     28
                   C1
                                                                                                                                                                                   89%
                   M1
     28            B1
                                                                                                            24                                                            83%
                                                                89%      94%                                                                                     64%
     24
                                                                                                            20
                                        60%            71%
     20

                                                                                                       MW
MW

                                                                                                            16
                                                                                                                                                        86%
     16
                           76%                                                                                                             89%
                                                                                                            12                 67%
     12        109%                                                                                                 24%

                                                                                                            8
     8

                                                                                                            4
     4

     0                                                                                                      0
               Jun 13     Dec 13       Jun 14          Dec 14   Jun 15   Dec 15   Jun 16   Dec 16                   Jun 13    Dec 13      Jun 14        Dec 14   Jun 15   Dec 15   Jun 16   Dec 16

          1.    Installed capacity includes the designed power capacity of the data halls fitted out at each facility. Further investment into customer related infrastructure, such
                as backup power generation, cooling equipment or rack infrastructure, may be made in line with customer requirements
          2.    Contracted utilisation as at 30 June 2015 is pro forma for Federal Government contract announced 10 August 2015
          3.    Billing customer utilisation refers to the sold capacity for which revenue is being billed
          4.    Contracted utilisation includes whitespace and rack power commitments with deferred start dates or ramp up periods
NEXTDC 1H17 Results                                                                                                                                                                               14
Facilities capacity and utilisation                                                                                                                        As at 31 December 2016
  M1 Melbourne
   Additional data hall space being fitted out to support customer                           30                     Contracted utilisation
    requirements and drive higher utilisation                                                                        Future build
  S1 Sydney                                                                                                          Build in progress
                                                                                              25
   Planned power increase from 14.0MW to 15.0MW, with additional data                                               Built
     hall space being fitted out to support customer requirements                                                    Planned data centre developments
                                                                                              20
  C1 Canberra
   Works underway to expand data hall space and upgrade critical
     infrastructure to bring C1 in line with NEXTDC’s evolving national build

                                                                                         MW
                                                                                              15
     standard
  M2 Melbourne / B2 Brisbane
   B2 and M2 developments on schedule with practical completion                              10
    expected towards the end of 2H17, with ~1.5MW (B2) and ~2.0MW (M2)
    of capacity (Phase 1)
                                                                                              5
  S2 Sydney
   S2 site under contract with development approvals in progress and
     practical completion expected towards the end of 1H18                                    0
                                                                                                        M1      S1           P1              C1     B1            M2         B2       S2
                                                 M1              S1              P1                C1            B1                 M2              B2                 S2           Total
    Commenced operations                      Sep-12          Sep-13          Feb-14          Aug-12          Oct-11              2H175           2H175             1H185

    Total power planned                     15.0MW          15.0MW           6.0MW            4.8MW          2.25MW           25.0MW              6.0MW           30.0MW          104.1MW

    MW built1                               15.0MW          14.0MW           2.7MW            0.7MW          2.25MW                      -               -               -        34.7MW

    Fit out capex to date2                   $130m3          $127m3           $46m3            $19m3          $30m3               $19m4           $33m4                n/a          $405m

    Contracted utilisation                  13.3MW          13.3MW           1.1MW            0.3MW          2.1MW                       -               -               -        30.0MW
    % of total power planned                    89%             88%             18%               5%            94%                      -               -               -           70%6
    % of MW built                               89%             95%             41%              36%            94%                      -               -               -            87%

    Capacity available for sale              1.7MW           1.7MW           4.9MW            4.5MW          0.1MW                       -               -               -        13.0MW6
   1.   MW built includes the designed power capacity of the data halls fitted out at each facility. Further investment into customer related infrastructure, such as back up power
        generation, cooling equipment or rack infrastructure, may be made in line with customer requirements
   2.   Site selection and other due diligence-related costs for planned data centre developments are included in corporate overheads
   3.   Excludes land and buildings
   4.   Includes land and buildings
   5.   Practical completion is expected towards the end of 2H17 for M2 and B2, and towards the end of 1H18 for S2
   6.   Excluding new facility builds
NEXTDC 1H17 Results                                                                                                                                                                         15
B2 BRISBANE1
   Technical space                              ~3,000sqm
   Total IT capacity                            6 MW
   Initial capacity                             ~1.5 MW
   Target PUE                                   ~1.342 / 1.253
   Design standard                              UTI Tier III
   Practical completion                         2H17
   1. Artist’s impression. Subject to change
   2. Value relates to total energy consumption ratio during a full calendar year,
      dependent on load and supports a NABERS 5 star rating
   3. Value refers to best instantaneous power consumption ratio within a calendar year,
      dependent on load and optimal environmental conditions

NEXTDC 1H17 Results                                                                        16
M2 MELBOURNE1
   Technical space                              10,000sqm+
   Total IT capacity                            25 MW+
   Initial capacity                             ~2 MW
   Target PUE                                   ~1.282 / 1.103
   Design standard                              UTI Tier III
   Practical completion                         2H17
   1. Artist’s impression. Subject to change
   2. Value relates to total energy consumption ratio during a full calendar year,
      dependent on load and supports a NABERS 5 star rating
   3. Value refers to best instantaneous power consumption ratio within a calendar year,
      dependent on load and optimal environmental conditions

NEXTDC 1H17 Results                                                                        17
1. Artist’s impression. Subject to change
   S2 SYDNEY1                                  2. Value relates to total energy consumption ratio during a full calendar year,
                                                  dependent on load and supports a NABERS 5 star rating
                                               3. Value refers to best instantaneous power consumption ratio within a calendar
   Technical space        ~8,000sqm4              year, dependent on load and optimal environmental conditions
                                               4. Technical space, total IT capacity, initial capacity, target PUE, and practical
   Total IT capacity      ~30 MW 4                completion subject to development approval

   Initial capacity       ~3 MW 4
   Target PUE             ~1.292,4 / 1.153,4
   Design standard        UTI Tier III
   Practical completion   1H184

NEXTDC 1H17 Results                                                                                                                 18
FY17
 Half-Year Results

Outlook

                     19
FY17E outlook

                       Strong                 Revenue in the range of $115m to $122m (up 24% to 31% on FY16)
                       growth in               Growth in recurring revenue underpinned by long-term customer contracts
                       revenue                 Expecting further growth in connectivity revenue underpinned by 42%1 growth in cross connects

                       Benefits of            EBITDA in the range of $46m to $50m (up 66% to 81% on FY16)
                       operating               Incremental FY17E EBITDA ($20.3m)2 represents ~79% of FY17E incremental revenue ($25.7m)3
                       leverage                Substantial scope for ongoing earnings growth across existing sites as well as new facility developments

                       Customer               Capital expenditure on existing sites between $80m and $100m
                       driven                  Customer driven expansion works expected to continue at M1 and S1
                       investment              Additional capital expenditure tightly tied to customer growth

                                              Capital expenditure on new data centre developments between $180m and $240m
                       New
                                               B2 and M2 practical completion expected towards the end of 2H17
                       facility
                                               S2 site under contract with development approvals in progress and practical completion expected towards the
                       investments
                                                end of 1H18

    1.   Compared to 1H16
    2.   Based on mid-point of FY17E guidance range of $46m-50m ($48m) less FY16 EBITDA of $27.7m
    3.   Based on mid-point of FY17E guidance range of $115m-122m ($118.5m) less FY16 revenue of $92.8m

NEXTDC 1H17 Results                                                                                                                                           20
FY17
  Half-Year Results

Appendices

                      21
FY17
     Half-Year Results

Business strategy

                         22
VISION                   MISSION

       Our vision is to help     Our mission is to be the
       enterprises harness the   leading customer-centric
       digital age, improving    data centre services
       our society through the   company, delivering
       advancement of            solutions that power, secure
       technology                and connect enterprise

NEXTDC 1H17 Results                                             23
                                                                 23
NEXTDC is where the cloud lives®

  Consumption economics is a powerful driver of hybrid
  cloud and colocation.
  NEXTDC customers enjoy a wide choice of public,
  private and hybrid cloud solutions through our Cloud
  Centre partner community: the largest carrier, vendor
  and integrator neutral ecosystem in Australia.

                                                                                Gartner, August 2016

   Public and private cloud              Hybridised cloud                      Connecting the clouds
   Our enterprise and government         Most customers have workloads         Connectivity is available through
   customers leverage public and         they run in the cloud, and            the internet, by secure private
   private cloud economics.              workloads they run on their own       connection or elastic fabric
   Consumption computing is a key        infrastructure. Due to legacy         connections to cloud solutions
   driver for customers’ shift to        platforms, network costs or           through NEXTDC interconnection
   colocation. NEXTDC hosts a            security concerns not all customers   services and our network of
   number of the largest international   put everything in public or private   partners. Networking latency is a
   and domestic public and private       clouds, so they combine and           key consideration for workloads
   cloud computing providers right       connect their own infrastructure at   into the cloud and the preferred
   here in Australia. Cloud providers    NEXTDC to create a hybrid cloud       location of the cloud. Connection
   prefer carrier-neutral data centres   environment. Hybrid clouds are        to public and private clouds is a
   because customers want                also a key driver of NEXTDC’s         key driver of NEXTDC’s
   connectivity choice.                  interconnection revenue.              interconnection revenue.

NEXTDC 1H17 Results                                                                                                24
Connect your physical and virtual worlds with AXON
  AXONVX connects your data centres, clouds and offices with your choice of network

                                                                               Neutral
                                                                               Connect to any cloud, network or
                                                                               data centre anywhere in the world

                                                                               Connected
                                                                               Connection points in 49 data
                                                                               centres nationwide and growing

                                                                               Scalable
                                                                               One port, multiple virtual connections.
                      CONNECT YOUR                                             Scale your connections as and when
                                                                               you need

                       WORLD WITH
                                                                               Secure
                        AXONVX                                                 Private connections that never
                                                                               touch the public internet

                                                                               Fast
                                                                               High bandwidth, low
                                                                               latency connections

                                                                               Cost efficient
                                                                               Pay for what you use,
                                                                               when you need it

NEXTDC 1H17 Results                                                                                                25
Seamless national network with
  cloud on-ramps
     Inter-site connectivity
                                                                Cloud and carrier on-ramp
     Carrier neutral

     Data centre neutral
                                                                                                   Carrier
     On demand interstate connections                                                           Marketplace
     Geo-redundancy

                                                                                    Enterprise
                                                                                     Premise

                                                                B1       B2
                                                                Brisbane, QLD

                                                                                                 Enterprise
   P1                                                           S1        S2                     Colocation
                                                                 Sydney, NSW
Perth, WA

                                                                C1
                                                         Canberra, ACT
                                                                                      Cloud Providers
                                    M1          M2
                                    Melbourne, VIC

            OPERATED BY                  OPERATED    ON-RAMP
            CARRIER PARTNERS             BY NEXTDC   LOCATION

NEXTDC 1H17 Results                                                                                            26
Australia’s BIGGEST network of ICT suppliers
  Our growing network of 300+ partners
  PREMIER PARTNERS

            CONTENT        SOLUTIONS       CLOUD      CARRIER
          DISTRIBUTORS   INTEGRATORS      SERVICES   NETWORKS

NEXTDC 1H17 Results                                             27
Channel-first sales strategy

           Customers easily connect to a wide choice of service providers for seamless hybrid cloud

NEXTDC 1H17 Results                                                                                   28
Cloud Centre – network effects drive profit in the digital economy

  NEXTDC’s Cloud Centre is the
  online marketplace for software,        “Your new digital platform will allow you to participate in
  application or service providers to     the evolving world of business, government, and consumer
  create value by facilitating direct     ecosystems because ecosystems are the next evolution for
  interactions between affiliates on      digital. It’s how you compete at scale."
  multiple sides. Cloud Centre is the
  country’s largest independent           Peter Sondergaard,
  network of carriers, cloud and IT       Senior Vice-President and Global Head of Research,
  service providers, enabling             Gartner
  customers to freely source best of
  breed suppliers within the NEXTDC
  Partner community.

  The data centre is a hub of
  interconnectivity
  Our data centres are both an ideal
  environment for a business’s critical
  infrastructure, and a place where
  they can improve the performance
  and efficiency of their business.
  The ability to connect to all
  suppliers and business partners in
  the one place reduces costs and
  minimises latency, while increasing
  the level of integration, automation
  and access to business
  intelligence.
NEXTDC 1H17 Results                                                                                     29
Leadership in sustainability

            NABERS 4.5 star rating                               2014 Finalist: M1 Melbourne –                                2013 Winner:
             for energy efficiency                                  the ‘Green’ data centre                                   Sustainability
        M1 Melbourne (awarded June 2016)                      DatacenterDynamics Awards, Asia-Pacific                     ARN ICT Industry Awards

        National Australian Built Environment                                         Solar energy production
        Rating System (NABERS)
                                                                                         The M1 Melbourne data centre hosts Australia’s largest
                                                                                          rooftop solar array (400kW), which in FY16 produced
           NEXTDC was one of the original signatories to
            NABERS for Data Centres                                                       476MWhrs, an offset of over 488 tonnes of CO2 –
                                                                                          equivalent to the carbon generated yearly by 143 cars

           NEXTDC is committed to achieving NABERs ratings
            for its other greenfield data centres                                        NEXTDC has plans for similar arrays at its Sydney and
                                                                                          Perth data centres

        Energy and environmental objectives include                                   City of Melbourne renewable energy initiative

           increasing the awareness of how each individual in                           NEXTDC has joined forces with the City of Melbourne as
                                                                                          part of a group of large energy users that have signalled
            our data centres may contribute towards reducing
            their impact on energy usage and the environment                              their interest in testing a new approach to drive
                                                                                          investment in renewable energy
           designing data centres using the latest technology to
            reduce energy use and impact on the environment                              The group includes NEXTDC, NAB, City of Maribyrnong,
                                                                                          City of Yarra, Federation Square, Mirvac, and bankmecu
           ensuring top priority is given to recycling, waste
            prevention and the elimination or reduction of wasteful                      Represents collective energy consumption of around
                                                                                          100GWh worth of energy, equivalent to around 250,000
            practices
                                                                                          solar panels or 15 wind turbines

NEXTDC 1H17 Results                                                                                                                                   30
Certifications & Awards
  Leading the Australian data centre industry

NEXTDC 1H17 Results                             31
FY17
     Half-Year Results

Industry overview

                         32
Virtualised, on-demand services drive rapid IT change
    "Cloud services will remain the essential foundation of the IT industry's 3rd
    Platform of innovation and growth. As the cloud market enters an 'innovation
    stage', there will be an explosion of new solutions and value creation on top of
    the cloud."
   Eileen Smith, IDC Program Director, Customer Insights and Analysis

     By 2020                                           By 2018                                        By 2020
    Cloud infrastructure                               Microsoft Cloud revenue                        Worldwide public
    spending                                           (Office365, CRM & Azure)                       cloud revenues

    $60b                                               $20b                                           >$195b

                            CAGR 14%                                               CAGR 27%                                 CAGR 20%

     2015    2016    2017    2018     2019    2020          2016            2017             2018     2015   2016    2017    2018    2019       2020
    IDC Worldwide Quarterly Cloud IT Infrastructure   Microsoft Earnings Release FY17 Q2 (Jan 2017)    IDC, Worldwide Semiannual Public Cloud
    Tracker (Jan 2017)                                                                                 Services Spending Guide (Aug 2016)

NEXTDC 1H17 Results                                                                                                                                    33
Cloud answers challenge of digital economy

    "In our view, a near-tripling of the public-cloud-based workload mix represents
    a monumental architectural shift…and is likely to create a major ripple effect
    across the entire technology landscape.”
   JP Morgan analysts Mark Murphy, Doug Anmuth, Sterling Auty, Rod Hall, and Philip Cusick

                                                                               In 2016
                                                                               Australian public cloud
    By 2020                                                                    market

          Data centre                    By 2020
                                                                                14.4%
         workloads will
         have doubled                      >92% of data
                                           centre traffic
                                           will be cloud
    Cisco Global Cloud Index: Forecast
    and Methodology, 2015–2020
                                                                                  $4.76b                             $5.45b
                                                                                         2015                               2016
                                         Cisco Global Cloud Index: Forecast   Gartner, Forecast Analysis: Public Cloud Services,
                                         and Methodology, 2015–2020           Worldwide, 2Q16 Update (Sep 2016)

NEXTDC 1H17 Results                                                                                                                34
Colocation data centres are hubs for cloud access

    “Cloud services providers are amongst the largest users of
    data centre facilities in the world and this is a catalyst for growth in the DC
    ecosystem, drawing enterprise customers, telcos and IT services firms.”
   Wonjae Shim, Research Analyst, ICT Practice Australia & New Zealand, Frost & Sullivan

                                                By 2021                                         By 2021
                                                APAC colocation                                 Australian colocation data
    By 2018                                     market revenue                                  centre services revenue

                   45%
          of enterprise
                                                $13b                                            $2b
         ICT spend will
        be on colocation
         & public cloud
          data centres                                                                                       CAGR 12% until 2021
                                                       19% CAGR 2016-2021

                                               2016   2016   2017     2018   2019    2021      2015 2016 2017 2018 2019 2020              2021
  IDC FutureScape: Worldwide Datacenter 2017   Research and Markets, Asia Pacific Colocation   Frost & Sullivan report: Australian Data
  Predictions – APeJ Implications (Dec 2016)   Market – Forecasts from 2016 to 2021            Centre Services Market 2016

NEXTDC 1H17 Results                                                                                                                              35
The shift to cloud has passed the tipping point

   "Cloud-first strategies are the foundation for staying relevant in a fast-paced
   world…helping to create a new generation of start-ups and "born in the cloud"
   providers."
    Ed Anderson, research vice president at Gartner

    By 2020                                                                 In 2016
                                                                            Australian                              34%
                                                                            enterprises:                        have adopted
             >40%                                                                                               a “cloud first”
        of workloads                                                                                                policy
         will run in a                    In 2016
                                                                                              58%
        public cloud
                                                                                           pursuing
                                         Cloud adoption
                                                                                            hybrid
                                          by Australian                                                               78%
                                                                                           strategy
    JP Morgan research note (Apr 2016)
                                           companies
                                                                                                                   building or
                                            increased
                                                                                                                    planning
                                                  86%                     Telsyte Australian Infrastructure &
                                                                          Cloud Computing Market Study 2017.      private cloud
                                                                          2016 Gartner CIO Agenda Report

                                         2016 Gartner CIO Agenda Report

NEXTDC 1H17 Results                                                                                                               36
FY17
   Half-Year Results

Case studies

                       37
Case study – B1 Brisbane
                                                                                                                                         1,2
                                                                                                                                                                       Billing utilisation
       Highlights                                                                                                Facility EBITDA ($m)                                  Facility EBITDA

  NEXTDC’s first facility,                                                                                             2H13      1H14   2H14    1H15    2H15   1H16       2H16          1H17
                                                                                                               6.0                                                                                100%
   commenced operations in
                                                                                                                                                                                                  90%
   October 2011                                                                                                5.0
                                                                                                                                                                                                  80%
  Break-even reached after                                                                                    4.0
                                                                                                                                                                                                  70%
   9 months of operation                                                                                                                                                                          60%
                                                                                                               3.0                                                                                50%
                                                                                                                                                                                                  40%
                                                                                                               2.0
                                                                                                                                                                                                  30%
                                                                                                                                                                                                  20%
                                                                                                               1.0
                                                                                                                                                                                                  10%
                                                                                                               0.0                                                                                0%

 ($’000s) Period ended                                     2H13                1H14                2H14                1H15              2H15           1H16           2H16                     1H17

 Contracted utilisation                                      46%                 58%                  69%                 72%             79%            91%             93%                     94%

 Billing utilisation3                                        43%                 52%                  66%                 71%             78%            90%             93%                     93%

 Recurring revenue                                          2,005               3,051               3,902               4,804            5,191          6,271          6,755                    7,101

 Project revenue                                              131                 317                 388                 219             488            614             149                     256

 Gross data centre revenue                                  2,136               3,367               4,290               5,023            5,679          6,886          6,904                    7,358

 Facility EBITDAR1                                          1,333               2,350               3,262               3,901            4,352          5,500          5,313                    5,782

 Facility EBITDA1,2                                         1,171               2,188               3,083               3,724            4,164          5,311          5,115                    5,582

 EBITDAR margin %                                            62%                 70%                  76%                 78%             77%            80%             77%                     79%

 Facility capex to date ($m)                                    26                  27                  27                  28             28             29               30                     30

  1.    Before head office costs
  2.    Does not include finance lease amortisation
  3.    Billing utilisation refers to the sold capacity for which revenue is currently being recognised as at the end of the period

NEXTDC 1H17 Results                                                                                                                                                                                 38
Case study – M1 Melbourne
                                                                                                                                          1
                                                                                                                                                                           Billing utilisation
                                                                                                                 Facility EBITDA ($m)                                      Facility EBITDA

                                                                                                                       2H13       1H14    2H14      1H15     2H15   1H16        2H16         1H17
                                                                                                              20.0                                                                                     90%
                                                                                                              18.0                                                                                     80%
                                                                                                              16.0
                                                                                                                                                                                                       70%
                                                                                                              14.0
                                                                                                                                                                                                       60%
                                                                                                              12.0
                                                                                                              10.0                                                                                     50%
                                                                                                               8.0                                                                                     40%
                                                                                                               6.0
                                                                                                                                                                                                       30%
       Highlights                                                                                              4.0
                                                                                                                                                                                                       20%
                                                                                                               2.0
  NEXTDC’s second facility, commenced operations in September 2012                                            0.0                                                                                     10%
  Break-even reached after 11 months of operation                                                            -2.0                                                                                     0%

 ($’000s) Period ended                                     2H13                1H14                2H14                1H15              2H15              1H16            2H16                     1H17

 Contracted utilisation3                                     38%                 39%                  42%                 46%              76%               77%             86%                     89%

 Billing utilisation4                                        13%                 29%                  37%                 42%              46%               56%             78%                     79%

 Recurring revenue                                          2,557               5,187               8,864              11,651            13,871            16,524          21,707                23,432

 Project revenue                                              372               1,229               1,025               1,525                 736           2,807           1,503                   2,039

 Gross data centre revenue                                  2,930               6,416               9,889              13,175            14,607            19,331          23,210                25,471

 Facility EBITDAR1                                          1,622               4,357               7,393              10,847            12,046            16,062          19,495                21,604

 Facility EBITDA1,2                                         (721)               2,011               4,999               8,450             9,597            13,611          17,009                19,116

 EBITDAR margin %                                            55%                 71%                  75%                 82%              82%               83%             84%                     85%

 Facility capex to date ($m)                                    57                  78                  84                  85                87             101             120                     130

  1.    Before head office costs
  2.    Normalised for revenue discount amortisation, capital allocations and notional rent
  3.    Percentages adjusted to reflect Project Plus capacity of 15MW
  4.    Billing utilisation refers to the sold capacity for which revenue is currently being recognised as at the end of the period

NEXTDC 1H17 Results                                                                                                                                                                                     39
Case study – S1 Sydney
                                                                                                                                             1
                                                                                                                                                                           Billing utilisation
                                                                                                                 Facility EBITDA ($m)                                      Facility EBITDA

                                                                                                                        2Q14          2H14       1H15   2H15        1H16     2H16            1H17
                                                                                                              12.0                                                                                     80%

                                                                                                              10.0                                                                                     70%

                                                                                                                                                                                                       60%
                                                                                                               8.0
                                                                                                                                                                                                       50%
                                                                                                               6.0
                                                                                                                                                                                                       40%
                                                                                                               4.0
                                                                                                                                                                                                       30%
       Highlights                                                                                              2.0
                                                                                                                                                                                                       20%

  NEXTDC’s fourth facility commenced operations in September 2013                                             0.0                                                                                     10%

  Break-even reached after 7 months of operation                                                             -2.0                                                                                     0%

 ($’000s) Period ended                                                         2Q14                2H14                1H15                  2H15        1H16              2H16                     1H17

 Contracted utilisation2                                                         22%                  24%                 35%                 51%          55%               66%                     88%

 Billing utilisation2,3                                                          14%                  23%                 25%                 33%          51%               57%                     72%

 Recurring revenue                                                                539               3,530               5,238                7,473        9,647            12,548                15,848

 Project revenue                                                                  913                 912               1,895                1,808        2,480             1,667                   2,245

 Gross data centre revenue                                                      1,452               4,442               7,133                9,281       12,127            14,215                18,093

 Facility EBITDAR1                                                                886               2,823               5,364                7,051        9,862            10,854                14,251

 Facility EBITDA1                                                               (432)                 137               2,675                4,304        7,110             8,066                11,460

 EBITDAR margin %                                                                61%                  64%                 75%                 76%          81%               76%                     79%

 Facility capex to date ($m)                                                        58                  64                  66                   78            95            114                     127

  1.    Before head office costs
  2.    Percentages adjusted to reflect target planned capacity of 15MW
  3.    Billing utilisation refers to the sold capacity for which revenue is currently being recognised as at the end of the period

NEXTDC 1H17 Results                                                                                                                                                                                     40
Register for investor updates at www.nextdc.com/our-company/investor-centre

  DISCLAIMER:
  The information may not be reproduced or distributed to any third party or published in whole or in part for any purpose. The information contained in these materials or discussed at the presentation is not
  intended to be an offer for subscription, invitation or recommendation with respect to shares or securities in any jurisdiction. No representation or warranty, express or implied, is made in relation to the
  accuracy or completeness of the information contained in this document or opinions expressed in the course of this presentation. The information contained in this presentation is subject to change without
  notification.
  This presentation contains forward-looking statements which can be identified by the use of words such as “may”, “should”, “will”, “expect”, “anticipate”, “believe”, “estimate”, “intend”, “scheduled” or “continue”
  or similar expressions. Any forward-looking statements contained in this presentation are subject to significant risks, uncertainties, assumptions, contingencies and other factors (many of which are outside the
  control of, and unknown to, NEXTDC Limited (“NXT”) and its officers, employees, agents or associates), which may cause the actual results or performance to be materially different from any future result so
  performed, expressed or implied by such forward looking statements. There can be no assurance or guarantee that actual outcomes will not differ materially from these statements.

NEXTDC 1H17 Results                                                                                                                                                                                                  41
You can also read