Investor Presentation - ALTUS MIDSTREAM COMPANY November 2020
←
→
Page content transcription
If your browser does not render page correctly, please read the page content below
ALT U S M ID ST R EAM C O M PANY

Investor Presentation
November 2020                       Nasdaq: ALTM
Disclaimer
FORWARD LOOKING STATEMENTS
The information in this presentation and the oral statements made in connection therewith include “forward-looking statements” within the meaning of Section 27A of the Securities Act of 1933, as amended (the
“Securities Act”), and Section 21E of the Securities Exchange Act of 1934, as amended. All statements, other than statements of historical facts, included in this presentation, including, without limitation, statements
regarding Altus Midstream Company’s (“Altus Midstream”) business, operations, strategy, prospects, plans, estimated financial and operating results, and future financial and operating performance and forecasts, as
well as similar information about Apache Corporation (“Apache”), are forward-looking statements. When used in this presentation, including any oral statements made in connection therewith, the words “could,”
“should,” “will,” “may,” “believe,” “anticipate,” “intend,” “estimate,” “expect,” “project,” “prospect,” “plan,” “continue,” “seek,” “guidance,” “might,” “outlook,” “possibly,” “potential,” “would,” the negative of such terms and
other similar expressions are intended to identify forward-looking statements, although not all forward-looking statements contain such identifying words. These forward-looking statements are based on
management’s current expectations and assumptions about future events and are based on currently available information as to the outcome and timing of future events. Except as otherwise required by applicable
law, Altus Midstream and Apache disclaim any duty to update any forward-looking statements, all of which are expressly qualified by the statements in this section, to reflect events or circumstances after the date of
this presentation. Altus Midstream and Apache caution you that these forward-looking statements are subject to all of the risks and uncertainties, most of which are difficult to predict and many of which are beyond
the control of Altus Midstream and Apache, incident to the development, production, gathering, transportation and sale of oil, natural gas and natural gas liquids. These risks include, but are not limited to, commodity
price volatility, low prices for oil and/or natural gas, global economic conditions, uncertainties inherent in the joint venture pipelines referred to herein, inflation, increased operating costs, construction delays and cost
over-runs, lack of availability of equipment, supplies, services and qualified personnel, processing volumes and pipeline throughput, uncertainties related to new technologies, geographical concentration of
operations, environmental risks, weather risks, security risks, drilling and other operating risks, regulatory changes, regulatory risks (including if Altus Midstream were to become an investment company in the
future), the uncertainty inherent in estimating oil and natural gas reserves and in projecting future rates of production, reductions in cash flow, lack of access to capital, Altus Midstream’s ability to satisfy future cash
obligations, restrictions in existing or future debt agreements or structured or other financing arrangements, the timing of development expenditures, managing growth and integration of acquisitions, failure to realize
expected value creation from acquisitions, and the scope, duration, and reoccurrence of any epidemics or pandemics (including specifically the coronavirus disease 2019 (COVID-19) pandemic) and the actions
taken by third parties, including, but not limited to, governmental authorities, customers, contractors, and suppliers, in response to such epidemics or pandemics. Should one or more of the risks or uncertainties
described in this presentation and the oral statements made in connection therewith occur, or should underlying assumptions prove incorrect, actual results and plans could differ materially from those expressed in
any forward-looking statements. Additional information concerning these and other factors that may impact Altus Midstream’s operations and projections can be found in its periodic filings with the Securities and
Exchange Commission (the “SEC”), including its Annual Report on Form 10-K for the fiscal year ended December 31, 2019 and subsequently filed Quarterly Reports on Form 10-Q. Altus Midstream’ SEC filings are
available publicly on the SEC’s website at www.sec.gov.

INFORMATION ABOUT ALPINE HIGH
Information in this presentation about Alpine High, including the reserve and production information set forth within the section entitled “Alpine High Overview,” has been provided by, and is the responsibility of,
Apache. Reserve engineering is a process of estimating underground accumulations of hydrocarbons that cannot be measured in an exact way. The accuracy of any reserve estimate depends on the quality of
available data, the interpretation of such data, and price and cost assumptions made by reserve engineers. Accordingly, reserve estimates may differ significantly from the quantities of oil and natural gas that are
ultimately recovered.

USE OF PROJECTIONS
This presentation contains projections for Altus Midstream, including with respect to Altus Midstream’s Adjusted EBITDA, capital investments, growth capital investments, distributable cash flow, free cash flow, and
retained cash flow. Altus Midstream’s independent auditors have not audited, reviewed, compiled or performed any procedures with respect to the projections for the purpose of their inclusion in this presentation,
and accordingly, have not expressed an opinion or provided any other form of assurance with respect thereto for the purpose of this presentation. These projections are for illustrative purposes only, should not be
relied upon as being necessarily indicative of future results, and are subject to the disclaimers under “Forward Looking Statements” above.

USE OF NON-GAAP FINANCIAL MEASURES
This presentation includes non-GAAP financial measures, including Adjusted EBITDA, capital investments, growth capital investments, distributable cash flow, free cash flow, and retained cash flow of Altus
Midstream. Altus Midstream believes these non-GAAP measures are useful because they allow Altus Midstream to more effectively evaluate its operating performance and compare the results of its operations from
period to period and against its peers without regard to financing methods or capital structure. Altus Midstream does not consider these non-GAAP measures in isolation or as an alternative to similar financial
measures determined in accordance with GAAP. The computations of Adjusted EBITDA, capital investments, growth capital investments, distributable cash flow, free cash flow, and retained cash flow may not be
comparable to other similarly titled measures of other companies. Altus Midstream excludes certain items from net (loss) income in arriving at Adjusted EBITDA and distributable cash flow because these amounts
can vary substantially from company to company within its industry depending upon accounting methods and book values of assets, capital structures and the method by which the assets were acquired. Adjusted
EBITDA and distributable cash flow should not be considered an alternative to, or more meaningful than, net income as determined in accordance with GAAP or as indicators of operating performance. Certain items
excluded from Adjusted EBITDA and distributable cash flow are significant components in understanding and assessing a company’s financial performance, such as a company’s cost of capital and tax structure, as
well as the historic costs of depreciable assets, none of which are components of Adjusted EBITDA or distributable cash flow. Altus Midstream’s presentation of Adjusted EBITDA, capital investments, growth capital
investments, distributable cash flow, free cash flow, and retained cash flow should not be construed as an inference that its results will be unaffected by unusual or non-recurring terms.

“APACHE”, “ALPINE HIGH”, “ALTUS MIDSTREAM”, and                  are trademarks of Apache Corporation.

                                                                                                                                                                                                                               2
Altus Midstream Overview
Commentary Simplified Structure
► Altus Midstream is a pure-play,
Permian to Gulf Coast Public Investors Apache Corporation
midstream C-corp
C-corp governance ~21%(1) ~79%(1)
No IDRs
► Interests in premier JV
pipelines provide diversity of Altus Midstream Company
(Nasdaq: ALTM)
stable cash flows and long-
term contracts
► State of the art gathering and 100%
processing assets
► Conservative balance sheet;
low leverage
16% Interest ~27%
Alpine High 15% Interest
► Strong financial position with Gathering &
in Gulf Interest in 33% Interest
in EPIC
Coast Permian in Shin Oak
Processing Crude
ample liquidity to fund future Assets
Express Highway Pipeline
Pipeline
Pipeline Pipeline
growth plans
3
(1) Amounts reflect direct and indirect ownership interests in ALTM.Potential 2021 Dividend Program
►In December, Management plans to recommend to the Board of
Directors the initiation of a dividend in 2021
Intend to propose a $1.50/share quarterly dividend payout,
commencing in March 2021
Implies ~1.8x coverage ratio at the midpoint of 2021 DCF guidance(1)
2021 Balance Sheet and Cash Flow Priorities 2021 Cash Flow Generation(2)
($ in millions)
$200
~89%
1 Generate free cash flow
$175
$175 Free cash
flow ~62%
yield(3) dividend
yield(3)
$150 $140
$35
2 Institute and fund a fixed dividend $125
$100
$75
3 Focus on balance sheet strength
$50 $43
$97
$25
Secure third-party G&P
4 opportunities to bolster cash flow $0
DCF Growth Free Proposed Retained
Capital Cash Flow Dividend @ Cash Flow
$1.50/share
(1) Coverage ratio calculated as midpoint of 2021 DCF guidance range ($175mm) divided by $1.50/share proposed dividend on an annualized basis ($97mm).
(2) DCF and Growth Capital utilize midpoint of 2021 guidance range. Proposed quarterly dividend is ultimately subject to Board approval. Analysis assumes a full year of dividends in 2021.
Retained cash flow can be used to pay down debt or keep on hand. Refer to the Glossary of Terms in the Appendix for definitions of Free cash flow and Retained cash flow.
4
(3) Free cash flow yield and dividend yield calculated using ALTM share price as of 10/30/2020 of $9.65/share.Dividend Rationale
►Following a thorough strategic review, we believe the best option to
maximize shareholder value is to return capital to investors through a
dividend program
Surety of cash flows to support a dividend with the expected start-up of
PHP in early 2021
High conviction in projections given stable nature of underlying assets
Significant implied yield on current share price
Potentially expands shareholder base to yield-oriented investors
Ample liquidity and limited capital needs in 2021 and beyond
Manageable leverage profile – forecast to be under 3x at YE 2021, well
within 5x covenant
Retain focus on balance sheet strength, with ample time to refinance
the Preferred equity
5Benchmarking Analysis
►ALTM currently trades at a discount to its peers despite having strong
visibility into future free cash flow
Non-operated exposure to top-tier projects managed by two integrated,
investment grade midstream companies (KMI and EPD)
►Upside potential in G&P business from incremental third-party opportunities
Total Enterprise Value / 2021E EBITDA (x) 2021E Yield (%)(1)
Median: 7.2x Median (excl. ALTM Pro Forma): 12%
8.6x Denotes Peers with Preferred Equity
8.2x 8.2x
7.8x
62%
7.2x 7.2x 7.0x 7.0x 6.8x 6.7x
5.5x
21%
17% 15% 15% 14% 12%
9% 8%
2% 0% 0%
Peer 1
Peer 2
Peer 3
Peer 4
Peer 5
Peer 6
Peer 7
Peer 8
Peer 9
Peer 10
ALTM
ALTM PF
Peer 1
Peer 2
Peer 3
Peer 4
Peer 5
Peer 6
Peer 7
Peer 8
Peer 9
Peer 10
ALTM
Source: Wall Street research and Factset as of 10/30/2020. Utilizes 2Q20 balance sheet information for all companies. Peers include AM, CEQP, DCP, ENBL, ENLC, ETRN, NBLX,
SMLP, TRGP, and WES.
(1) ALTM pro forma (PF) yield assumes 2021E dividends of $6.00/share divided by 10/30/2020 closing price of $9.65/share. 2021E yield for peers calculated as 2021E dividend per share 6
divided by share price as of 10/30/2020.JV Pipelines and G&P Overview
7Joint Venture Pipelines Overview
Pipeline Map Commentary
► Altus owns equity interests in four joint venture
pipelines
► All four pipelines provide takeaway capacity from
the Permian Basin to the U.S. Gulf Coast
► All pipelines in-service with the exception of
Katy
Permian Highway (expected in early 2021)
Market Access
► Long-haul pipe investments provide diversified
cash flow stream across all 3 commodities
STX / Aqua Dulce
Market Access
USGC Pipeline / LNG
Market Access
Natural • 16% of KMI’s GCX
Gas
• ~27% of KMI’s Permian Highway
NGLs • 33% of EPD’s Shin Oak
Crude • 15% of EPIC Crude
8JV Pipeline Recent Developments
Gulf Coast ► Capacity of 2.0 Bcf/d is fully subscribed under long-term, binding agreements
Express Pipeline ► GCX continues strong performance, with cash distributions in-line with expectations
► Capacity of 2.1 Bcf/d is fully subscribed under long-term, binding agreements
Permian Highway
► Expected fully in-service in early 2021 with project cost estimated at ~$2 billion
Pipeline
► Construction is nearing completion: ~97% mechanically complete on the pipeline
► Volumes and cash flows rebounded off the trough in 2Q20; as a result, cash distributions
Shin Oak NGL in 3Q20 exceeded expectations
Pipeline ► Outlook reflects continued lower activity levels in the Permian Basin with very modest
ramp in 2021
► Commenced full service in April 2020
► Cost overruns and out-of-scope projects have increased estimated project cost to ~$2.4 –
EPIC Crude
$2.5 billion (~$350 million over the original ~$2.1 billion budget)
Pipeline
► EPIC has funded overage with a combination of operating cash flow, project level debt
financings and equity contributions from all partners
9Gulf Coast Express (GCX) Overview
Pipeline Map Commentary
► Altus owns 16% of GCX, remaining ownership is
34% Kinder Morgan (Operator), 25% DCP and
25% Targa
► Project Statistics:
Capacity: 2.0 Bcf/d
In-service since Sept 2019, Altus continues
to receive distributions
Capacity is fully subscribed under long-
term, binding agreements
► Provides flexible access to growing markets
Exports to Mexico and Gulf Coast LNG
liquefaction terminals
Growing industrial demand
Multiple pipeline interconnects at Agua
Dulce including KMI intrastate capacities of
over 7 Bcf/d (pipeline) and 132 Bcf
(storage)
10Permian Highway Pipeline (PHP) Overview
Pipeline Map Commentary
► Altus owns ~27% of PHP, remaining ownership
is ~27% Kinder Morgan (Operator), ~27%
EagleClaw and 20% from an undisclosed
anchor shipper
► Designed to transport approximately 2.1 Bcf/d
of natural gas
Pipeline capacity is fully subscribed by
Katy
Market Access long-term minimum volume commitments
Approximately 430 miles of 42” pipeline
from Waha to Katy, with connections to
the U.S. Gulf Coast and Mexico markets
STX / Aqua Dulce
Market Access
USGC Pipeline / LNG
Market Access ► Expected in-service in early 2021
► Construction continues to progress –
currently 97% mechanically complete
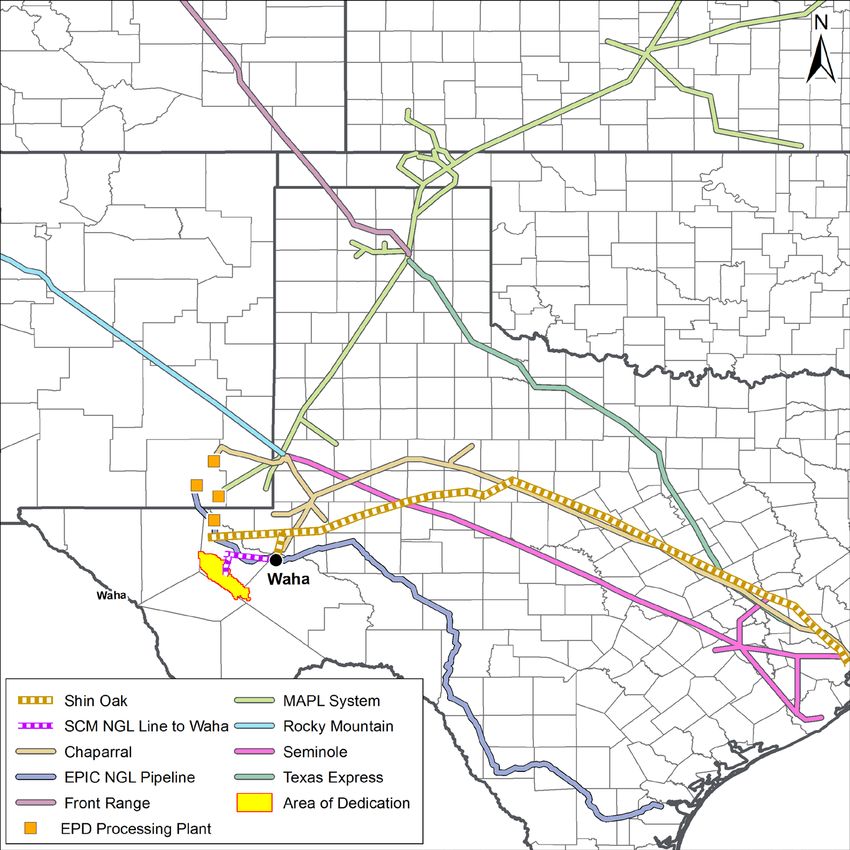
11Shin Oak Pipeline Overview
Pipeline Map Commentary
► Breviloba LLC owns the Shin Oak NGL Pipeline
(Shin Oak) and is owned 67% by Enterprise
Products Operating LLC and 33% by Altus
► Project overview:
~658 miles of 24-inch pipeline connecting
Orla and Waha to Mont Belvieu NGL
fractionation and storage complex
Project completed within budget of $1.5BN
► Shin Oak is differentiated through its integration
with Enterprise’s existing pipelines and
fractionators, providing:
Supply from multiple basins (e.g., Rockies
through Rocky Mountain and MAPL)
Superior flow assurance, provides a
competitive advantage to attract third-party
business
Volumes in 3Q20 rebounded off lows in
2Q20
12EPIC Crude Overview
Pipeline Map Commentary
► Altus owns 15% of EPIC Crude, remaining
ownership is 45% Ares Capital(1), 30% Noble
Midstream Partners and 10% Rattler Midstream
► The project consists of ~700 miles of pipeline
connecting the Permian and Eagle Ford Basins
to Corpus Christi
► Current capacity of approximately 590 MBPD
Capacity is expandable with the installation
of additional pumps and storage
► Commenced full service in April 2020
► Volumes rebounded in 3Q20 as compared to
2Q20, but forward outlook remains challenged
► Revenue generating opportunities through
combined pipe / dock ownership leading to
potential short-term storage and transport deals
13
(1) Ares Capital is the private equity sponsor that owns EPIC Consolidated Operations, LLC, the Operator of EPIC Crude.Gathering & Processing Overview
Asset Map Asset Highlights
► Rich Gas Processing:
600 MMcf/d of capacity from three
cryo trains online and in-service
Cryos performing well, consistently
able to run above nameplate capacity
with 99%+ ethane recovery
► Lean Gas Treating / Compression: 400
MMcf/d of current capacity
► Gas Gathering Pipelines: ~182 miles in
service
► Residue Pipelines / Market Connections:
~46 miles in service with 4 market
connections (Comanche Trail, El Paso Line
1600, Roadrunner and Trans-Pecos
Pipeline)
600 MMcf/d of nameplate cryo capacity currently in-service
14State of the Art Cryogenic Processing – SRX Technology
► The cryogenic facilities utilize SRX technology to capitalize on better recoveries
in ethane rejection mode
► Drives improved netbacks on third-party volumes
► Standardized units allow for efficient operations at centralized cryo complex
Design Recoveries Across Various Gas Processing Methods
MRU GSP Recovery GSP Rejection SRX Recovery SRX Rejection
Ethane 10% 92% 10% 99%Financial Overview
16Financial Overview
►Altus has ample liquidity to execute on its 2020 and 2021 capital plans
through a combination of reinvesting operating cash flow and revolver
capacity
Revolver capacity is $800 million, maturing in November 2023
No anticipated need to access any capital markets to finance growth
plans
Leverage expected to be well below 5x covenant
►Forecast to be cash flow positive with the expected start-up of PHP
►Ability to generate cash underpinned by strength and stability of JV
pipelines
►Moving forward, focus is on delivering shareholder value coupled with
prudent balance sheet management
17Updates to 2020 Guidance
►Gathered volume outlook remains 480 – 520 MMcf/d (~70% rich gas)
► Trending towards the middle of the range given strong return of volumes following
production curtailments in 1H20
►2020 Adjusted EBITDA(1) range revised upwards to $170 – 190 million
► 55-65% attributable to JV pipeline projects
► Revised range primarily driven by higher than expected EBITDA from Shin Oak and
G&P operations
►2020 Distributable Cash Flow(1) range revised upwards to $115 – 125
million
► Revised range primarily driven by higher than expected cash distributions from Shin
Oak and G&P operations
►2020 Growth Capital Investments(1) range tightened to $330 – 360 million
► Over 95% attributable to JV pipes
► Reflects gross proportionate share of capital without accounting for EPIC’s project-
level financing; our actual share of capital funded is less than the gross amount
outlined as EPIC’s project-level debt funded a portion of its capital costs
18
(1) For a reconciliation to the most directly comparable GAAP financial measure, please refer to the Non-GAAP Reconciliations in the Appendix.Updates to 2021 Guidance
►Gathered volumes revised upwards to 360 – 400 MMcf/d (~70% rich gas)
► 2021 gathered volume outlook reflects no third-party or additional wells turned
online at Alpine High
►2021 Adjusted EBITDA range revised upwards to $230 – 270 million
► ~80% attributable to JV pipeline projects
► Revised range primarily driven by higher than expected EBITDA from PHP and G&P
operations
►2021 Distributable Cash Flow range revised upwards to $160 – 190 million
► Revised range primarily driven by higher than expected cash distributions from PHP
and G&P operations
►2021 Growth Capital Investments range tightened to $30 – 40 million
► All growth capital attributable to PHP
192020 – 2021 Guidance Overview
ADJUSTED EBITDA DISTRIBUTABLE CASH FLOW GROWTH CAPITAL INVESTMENTS(1)
($ in millions) ($ in millions) ($ in millions)
$300 $200 $400
$190
$270 $360
$175 $350
$250
~40% increase ~45% increase
$330
$150 $160 $300
$230
$200 $190 $125
$125 $250
~90% decrease
$170 $115
$150 $100 $200
$75 $150
$100
$50 $100
$50
$25 $50 $40
$30
$0 $0 $0
2020 2021 2020 2021 2020 2021
% Attributable to JV Pipelines % Attributable to JV Pipelines
55 – 65% ~80% 95%+ 100%
Note: For a reconciliation to the most directly comparable GAAP financial measure, please refer to the Non-GAAP Reconciliations in the Appendix.
20
(1) 2020 Growth Capital Investments includes proportionate share of EPIC capital, of which ~60% is estimated to be equity funded.Appendix
21Joint Venture Pipelines Detail
Gulf Coast Express Permian Highway Shin Oak EPIC Crude
Product Natural Gas Natural Gas NGL Crude
Operator Kinder Morgan Kinder Morgan Enterprise Products EPIC
Project Cost $1.75 billion ~$2 billion $1.5 billion $2.4-$2.5 billion
Altus Ownership % 16% ~27% 33% 15%
Origin/Terminus Waha/Agua Dulce Waha/Gulf Coast Waha/Mont Belvieu Orla/Corpus Christi
Miles of Pipeline 447 430 658 730
Pipeline Capacity 2.0 Bcf/d 2.1 Bcf/d 550 MBPD 590 MBPD(1)
In-Service Date In-Service Early 2021 In-Service In-Service
Other Owners(2) KMI, DCP, TRGP KMI, EagleClaw EPD Ares, NBLX, RTLR
Contract Mix MVC MVC Dedication MVC/Dedication
(1) Represents Permian Basin pipeline capacity. Initial capacity is 590 MBPD, expandable to 900 MBPD.
22
(2) Represents existing project partners and disclosed holders of equity options.Non-GAAP Reconciliation – Adjusted EBITDA & DCF
The Company believes Adjusted EBITDA and DCF are useful because they allow the Company to more effectively evaluate its operating performance
and compare the results of its operations from period to period and against its peers without regard to financing methods or capital structure.
Our management compensates for the limitations of Adjusted EBITDA as an analytical tool, by reviewing the comparable GAAP measure, understanding
the differences between Adjusted EBITDA as compared to net income (loss) including noncontrolling interests and incorporating this knowledge into its
decision-making processes. Our management believes that investors benefit from having access to the same financial measures that the Company uses
in evaluating operating results.
Quarter Ended Nine Months Ended Quarter Ended Nine Months Ended
Septem ber 30, Septem ber 30, Septem ber 30, Septem ber 30,
2020 2020 2020 2020
Net income (loss) including noncontrolling interests $ 29,322 $ 20,192 Adjusted EBITDA (Non-GAAP) $ 52,908 $ 143,091
Add: Add:
Financing costs, net of capitalized interest 413 978 Distributions from equity method interests 32,923 74,670
Depreciation and accretion 4,008 11,984 Less:
Unrealized derivative instrument loss 3,533 76,102 EBITDA from equity method interests 29,952 81,869
Equity method interests Adjusted EBITDA 29,952 81,869 Cash interest expense 2,098 7,471
Other - 290 Cash tax - -
Less: Maintenance capital - -
Gain (loss) on asset sales, net - 76 Preferred units distributions 11,562 34,487
Interest income - 9 Distributable Cash Flow (Non-GAAP) $ 42,219 $ 93,934
Income (loss) from equity method interests, net 14,320 47,541
Income tax benefit - 696
Other - 2
Adjusted EBITDA (Non-GAAP) $ 52,908 $ 143,091
Other m idstream activity
Cash distributions received from equity method interests $ 32,923 $ 74,670
23
Note: All numbers are in thousands.Non-GAAP Reconciliation – Growth Capital
Management believes the presentation of capital investments and growth capital investments is useful for investors to assess Altus' expenditures related
to our midstream capital activity. We define capital investments as costs incurred in midstream activities, adjusted to exclude asset retirement obligation
revisions and liabilities incurred, while including amounts paid during the period for abandonment and decommissioning expenditures given the
uncertainty and timing of when the actual abandonment activity will occur. Management also believes that including our proportionate share of capital in
relation to equity method interests funded by cash contributions and the partner's project financing is useful for investors to assess Altus' total growth
capital investments. Management believes total growth capital investments provides a more accurate reflection of Altus' current-period expenditures
related to midstream capital activity and is consistent with how we plan our capital budget.
Quarter Ended Nine Months Ended
Septem ber 30, Septem ber 30,
2020 2020
Costs incurred in midstream activity
Property, plant and equipment, gross $ 1,868 $ 11,223
Equity method interests 131,840 286,227
Total cost incurred in midstream activity $ 133,708 $ 297,450
Reconciliation of costs incurred to midstream capital investment:
Asset retirement obligations incurred and revisions $ - $ -
Asset retirement obligations settled - -
Total capital investm ents 133,708 297,450
Equity method interest capital investments funded by project financing - 22,091
Total grow th capital investm ents $ 133,708 $ 319,541
24
Note: All numbers are in thousands.Glossary of Terms
► Adjusted EBITDA is defined as net income (loss) including noncontrolling interest before financing costs
(net of capitalized interest), net interest expense, income taxes, depreciation, and accretion and
adjusting for such items, as applicable, from income from equity method interests. Also excluded (when
applicable) are impairments and other items affecting comparability of results to peers
► Distributable cash flow (DCF) is defined as Adjusted EBITDA less equity interests’ Adjusted EBITDA
plus cash distributions from equity interests less maintenance capex, cash tax, preferred unit
distributions (whether in kind or in cash) and interest expense
► Free cash flow (FCF) is defined as Distributable cash flow less Growth capital investments
► Retained cash flow is defined as Free cash flow less cash dividends to common equity holders
► Reconciliations of forecasted Adjusted EBITDA, distributable cash flow, free cash flow, and retained
cash flow to the nearest GAAP measure, net income including non-controlling interests, are not
provided because certain of the items necessary to estimate such amounts are not reasonably
accessible or estimable at this time. These items primarily relate to lack of available forecast information
to reconcile to our share of proportionate net income generated by our interests in third-party pipeline
projects
► Capital investment is defined as costs incurred in midstream activities, adjusted to exclude asset
retirement obligations revisions and liabilities incurred, while including amounts paid during the period
for abandonment and decommissioning expenditures
► Growth capital investments is defined as Capital Investment plus Altus’ proportionate share of capital in
relation to equity method interests
25You can also read