Q2 2021 Results August 12, 2021 - Investor Relations
←
→
Page content transcription
If your browser does not render page correctly, please read the page content below

August 12, 2021

Q2 2021 Results

Forward-Looking Statements
This presentation contains forward-looking statements within the meaning of applicable Canadian securities legislation. These forward-looking statements relate to future
events or future performance, and reflect management’s expectations or beliefs regarding future events, including business and economic conditions and Fiera Capital’s
growth, results of operations, performance and business prospects and opportunities. Forward-looking statements may include comments with respect to Fiera Capital’s
objectives, strategies to achieve those objectives, expected financial results, and the outlook for Fiera Capital’s businesses and for the Canadian, American, European,
Asian and other global economies.
In some cases, forward-looking statements can be identified by terminology such as “believe”, “expect”, “plan”, “anticipate”, “estimate”, “may increase”, “may fluctuate”,
“predict”, “potential”, “continue”, “target”, “intend” or the negative of these terms or other comparable terminology and similar expressions of future or conditional
verbs, such as “will,” “should,” “would” and “could”. Forward-looking statements, by their very nature, involve numerous assumptions, inherent risks and uncertainties,
both general and specific, and the risk that predictions and other forward-looking statements will prove to be inaccurate. The uncertainty created by the COVID-19
pandemic has heightened such risk given the increased challenge in making predictions, forecasts, projections, expectations, or conclusions. As a result, Fiera Capital does
not guarantee that any forward-looking statement will materialize and readers are cautioned not to place undue reliance on these forward-looking statements. A number
of important factors, many of which are beyond Fiera Capital’s control, could cause actual events or results to differ materially from the predictions, forecasts, projections,
expectations, or conclusions expressed in such forward-looking statements. These factors include, but are not limited to risks relating to performance and investment of
the assets under management (“AUM”), AUM concentration within limited number of strategies, reputational risk, regulatory compliance, information security policies,
procedures and capabilities, litigation risk, insurance coverage, third-party relationships growth and integration of acquired businesses, AUM growth, key employees and
other factors described in the Company’s Annual Information Form (“Annual Information Form”), Management Discussion and Analysis for the year ended December 31,
2020 or discussed in other materials filed by the Company with applicable securities regulatory authorities from time to time, copies of which are available on SEDAR at
www.sedar.com and on Fiera Capital’s Investor Relations website at https://ir.fieracapital.com/.
The preceding list of important factors is not exhaustive. When relying on forward-looking statements in this AIF and any other disclosure made by Fiera Capital, investors
and others should carefully consider the preceding factors, other uncertainties and potential events. The information contained in this presentation, including any
forward-looking statements, has been prepared as of August 11, 2021 unless otherwise indicated herein. Fiera Capital assumes no obligation to update or revise the
forward-looking statements to reflect new events or circumstances, except as may be required pursuant to securities laws.
This presentation contains non-IFRS financial measures. Non-IFRS measures are not recognized measures under International Financial Reporting Standards (“IFRS”), do
not have any standardized meaning prescribed by IFRS and may not be comparable to similar measures presented by other companies. We have included non-IFRS
measures to provide investors with supplemental measures of our operating and financial performance. We believe non-IFRS measures are important supplemental
metrics of operating and financial performance because they highlight trends in our core business that may not otherwise be apparent when one relies solely on IFRS
measures. Securities analysts, investors and other interested parties frequently use non-IFRS measures in the evaluation of issuers, many of which present non-IFRS
measures when reporting their results. Management also uses non-IFRS measures in order to facilitate operating and financial performance comparisons from period to
period, to prepare annual budgets and to assess our ability to meet our future debt service, capital expenditure and working capital requirements. Please refer to the
“Non-IFRS Measures” Section of Fiera Capital’s Management’s Discussion and Analysis for the three and six-month periods ended June 30, 2021 for the definitions and the
reconciliation to IFRS measures, available on SEDAR at www.sedar.com and on Fiera Capital’s Investor Relations website at https://ir.fieracapital.com/.
In relation to indicated returns of our public and private strategies, the indicated rates of return are drawn from Fiera Capital’s Management Discussion and Analysis for
the three and six-month periods ended June 30, 2021. As such, the aforementioned results remain subject to any disclaimers and limitations in that document. Further,
our strategies are not guaranteed, their values change frequently and past performance may not be repeated.
                                                                                                                                                                        2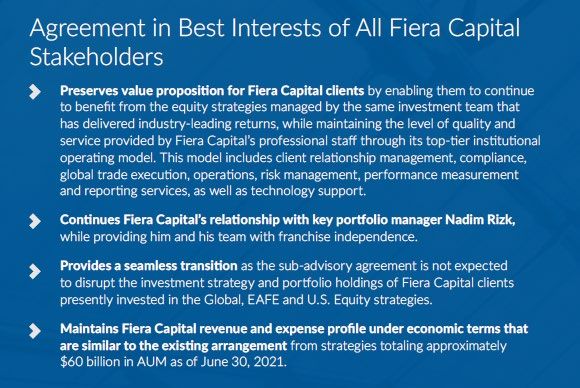
Conference Call Participants

                    Jean-Guy Desjardins
                    Chairman of the Board and Chief Executive Officer

                    Jean-Philippe Lemay
                    Global President and Chief Operating Officer

                    Lucas Pontillo
                    Executive Vice President and Global Chief Financial Officer

                                                                                  3
Topics for Discussion

  Q2 2021 highlights

  AUM

  Business performance

  Financial performance

  Investment performance

  Partnership with StonePine Asset Management

                                                4
Q2 2021 Highlights
AUM
$6.6B increase ( 3.8%) in Q2 2021
$179.5B as at
$7.2B increase ( 4.2%) over the last twelve months
June 30, 2021
Basic Adjusted EPS of $0.39 per share
Compared to $0.38 in Q2 2020
Adjusted EBITDA of $52.7M
Financial Performance Compared to $51.9M in Q2 2020 ( 1.5 %)
Excluding the impact of dispositions1, Q2 2021 Adjusted EBITDA up ~$8.3M y/y ( 19.4%)
Adjusted EBITDA margin of 31.5%
Compared to 31.1% in Q2 2020 ( 40 bps)
Organic revenue growth of 5.5% anticipated from first half year flows and 3.6% from LTM flows
Continued execution on our catalysts for growth
Business Performance New Atlas global equity (“Fiera Atlas”) team generating significant interest with
international investors
Signing of international distribution agreements (Q3 2021)
Public markets: on a trailing 3-year basis2:
96% of equity AUM outperformed benchmark
Investment 97% of fixed income AUM outperformed benchmark
Performance Private markets:
Strong performance across all key strategies
Positive fundraising momentum in real asset strategies
Onboarding of new talent in investment and distribution
Expanded agreement with the Canadian Institute of Actuaries
Corporate Initiatives
Released Fiera Capital’s 2020 Responsible Investing Report
(Q2 & Q3 2021) Joining of the Net Zero Asset Managers initiative
Sub-advisory partnership with StonePine Asset Management (“StonePine”)
1) Dispositions include: the sale of the rights to manage the retail mutual funds of Fiera Investments LP in June 2020; the sale of Wilkinson Global Asset Management (“WGAM”) in December 2020; the sale of Bel Air Investment
Advisors (“Bel Air”) in March 2021; and the termination of the revenue-sharing arrangement with City National Rochdale (“CNR”) in connection with the sale of the rights to manage the Fiera Capital Emerging Markets Fund in
July 2021. 5
2) Percentages exclude AUM in segregated accounts managed on behalf of private wealth clients, discretionary accounts, Asia-based accounts, private alternative investment strategies and accounts for which total and relative
return are not the primary measure of performance.
AUM of $179.5B as at June 30, 2021
LTM June 30, 2021 Flows ($B)
Total AUM increased by $7.2B, or 4.2%, compared to June 30, 2020, as a result of:
FX-adjusted market impact of $20.1B
Net organic growth of $2.2B
Inclusion of the Fiera Atlas team’s AUM of $0.9B
Partly offset by
The sale of Bel Air, WGAM, and the termination of the revenue-sharing arrangement with CNR in connection with the
sale of the rights to manage the Fiera Capital Emerging Markets Fund
Totals and subtotals may not reconcile due to rounding.
6Q2 2021 Organic Growth Update
Q2 Net Sales and Net New Subscriptions Expected to Contribute ~$2.8M
to Annualized Revenues
Flows by Distribution New Mandates Net New Lost Contributions from Net
Channel ($B) Subscriptions1 Mandates Existing Clients Organic Growth
Institutional 1.3 - (0.4) (1.1) (0.3)
Financial Intermediaries 0.4 - (2.0) 0.2 (1.4)
Private Wealth 0.4 - (0.1) (0.1) 0.2
Total 2.0 0.5 (2.6) (1.0) (1.1)
Estimated annualized New Mandates Net New Lost Contributions from Net Organic
revenue impact ($M) Subscriptions1 Mandates Existing Clients Growth
Institutional 6.3 - (2.0) (5.0) (0.7)
Financial Intermediaries 2.2 - (4.9) (1.0) (3.7)
Private Wealth 2.3 - (0.3) (0.3) 1.7
Total 10.8 5.5 (7.2) (6.3) 2.8
INSTITUTIONAL AUM of $92.3B, $3.1B in Q2 2021
Net outflows of $0.3B
New mandates won in a variety of equity, fixed income and private markets strategies
Lost mandates mainly from clients in Europe reducing their allocation to emerging markets
Withdrawals from existing clients mainly as a result of clients rebalancing equity portfolios and fixed income clients requiring liquidity
FINANCIAL INTERMEDIARIES AUM of $71.9B, $2.8B in Q2 2021
Net outflows of $1.4B
New mandates won across all asset classes
Expected fixed income redemptions of ~$830M from a Canadian financial intermediary client restructuring their investment offering
• Offset by new contributions of the same amount by the client
Fixed income redemptions of ~$1B in the U.S. as a result of scheduled withdrawals from short term liquidity accounts and reallocations to other asset classes
PRIVATE WEALTH AUM of $14.4B, $0.6B in Q2 2021
Net organic sales of $0.2B
New mandates won in Canada and the U.S. for various asset class mandates, including several private markets mandates
Note: Subtotals and totals may not reconcile due to rounding. Data presented excluding AUM and revenues related to: Fiera Investments, WGAM, Bel Air and the Fiera Capital Emerging Markets Fund
1. Net New Subscriptions and their estimated annualized revenue impact exclude amounts already deployed during the period, which are reflected in New Mandates. 7
2. Amount as at June 30, 2021Estimated Organic Revenue Growth
Net Organic Growth ($B) Q2 2021 Q1 2021 H1 2021 LTM June 30, Committed
Data presented excluding AUM and revenues 2021 undeployed
related to dispositions1 Capital2
Institutional AUM (0.3) 0.9 0.7 2.1 1.2
Financial Intermediaries AUM (1.4) 1.6 0.1 (0.4) 0.0
Private Wealth AUM 0.2 0.7 0.9 0.6 0.3
Net Organic Growth Total (AUM) (1.1) 3.4 2.3 3.1 1.5
Annual Organic Revenue Impact ($M) 2.8 11.3 14.2 18.2 14.0
Base Management Fees ($M) 543.93 527.24 527.24 501.45 -
Annual Organic Revenue Growth6 (%) 2.1% 8.9% 5.5% 3.6% n/a
$1.5B of committed, undeployed capital as at June 30, 2021 expected to generate $14.0M in annualized revenue
In addition, committed, undeployed capital expected to generate one-time transaction fees of approximately $8M
Revenue related to potential performance fees associated with Private Markets investments are not reflected above
1. Dispositions include: the sale of the rights to manage the retail mutual funds of Fiera Investments LP in June 2020; the sale of WGAM in December 2020; the sale of Bel Air in March
2021; and the termination of the revenue-sharing arrangement with CNR in connection with the sale of the rights to manage the Fiera Capital Emerging Markets Fund in July 2021.
2. As at June 30, 2021
3. Last twelve months ended March 31, 2021
4. Last twelve months ended December 31, 2020
5. Last twelve months ended June 30, 2020
6. Annual organic revenue growth of Base Management Fees only
Note: Subtotals and totals may not reconcile due to rounding.
8Focused on Global Equity and Private Markets Solutions
To Drive Future Growth
Global Equity Update Private Markets Update
Public Markets AUM of $165.5B, as at June 30, 2021, Private Markets AUM of $14.0B, an increase of $0.4B
an increase of $6.2B compared to March 31, 2021 in Q2 2021
Fiera Atlas global equity team reflected in total Total new subscriptions of $0.6B
AUM Infrastructure strategies particularly in demand
• $0.9B as at June 30, 2021, higher than • Distribution agreement signed in
anticipated at the time of acquisition Australia, New Zealand and Japan
• Distribution agreement signed in Japan Significant number of attractive deployment
• Solid track record of performance driving opportunities
interest among investors Agriculture team closed three bolt-on acquisitions
• Well-positioned for growth with significant in Australia
investment capacity Notable fundraising in Private Debt and Real Estate
Distribution Update
International distribution agreements signed with:
Mitsui & Co (Japan) for Fiera Capital’s flagship infrastructure strategy
Ironbark Asset Management (Australia and New Zealand) for Fiera Capital’s flagship infrastructure strategy and
the Fiera Atlas global equity strategy
Appointment of Bill Cashel as Senior Vice President, Global Head of Financial Intermediaries
9Total Revenues up $0.5M Year Over Year
Excluding the Impact of 4 Dispositions1, Y-o-Y Revenues
up $27.6M, or 20%
Revenues ($M)
Excluding the impact of divestitures 137.0 143.5 169.1 150.1 164.6
Last twelve months (“LTM”) ($M) 693.0 703.9 695.1 699.1 699.7
LTM Excluding the impact of 567.2 581.8 579.1 599.7 627.3
divestitures
Excluding dispositions, total revenues of $164.6M in Q2 2021, up $27.6M, or 20.1%, year over year
Institutional base management fees of $79.2M in Q2 2021, compared to $66.6M in Q2 2020
Financial Intermediaries base management fees of $50.5M, compared to $57.5M in Q2 2020
Excluding dispositions, base management fees of $48.4M in Q2 2021, compared to $44.0M in Q2 2020
Private Wealth base management fees of $22.1M, compared to $31.7M in Q2 2020
Excluding dispositions, base management fees $22.1M in Q2 2021, compared to $17.5M in Q2 2020
Performance fees up $3.4M year over year
Other revenues increased $4.4M year over year, mostly from higher transaction and commitment fees in Private Markets
1) Dispositions include: the sale of the rights to manage the retail mutual funds of Fiera Investments LP in June 2020; the sale of WGAM in December 2020; the sale of Bel Air in March 2021; and the
termination of the revenue-sharing arrangement with CNR in connection with the sale of the rights to manage the Fiera Capital Emerging Markets Fund in July 2021. 10Selling, General and Administrative Expenses (SG&A)
SG&A ($M) SG&A ($M) – Excluding Dispositions1
Q2 2021 vs Q2 2020
0.3% 20.1%
2.1% 16.7%
SG&A ($M) SG&A ($M) – Excluding Dispositions1
Q2 2021 vs Q1 2021
1.1% 9.7%
1.2% 6.3%
SG&A Total Revenues
1) Dispositions include: the sale of the rights to manage the retail mutual funds of Fiera Investments LP in June 2020; the sale of WGAM in December 2020; the sale of Bel Air in March 2021;
and the termination of the revenue-sharing arrangement with CNR in connection with the sale of the rights to manage the Fiera Capital Emerging Markets Fund in July 2021.
11Net Earnings1 & Adjusted Net Earnings1,2
Reconciliation of Q2 2021 Adjusted net earnings1,2 ($M)
$0.13 per share basic $0.39 per share basic
($0.12 diluted) ($0.36 diluted)
1) Attributable to Company shareholders
2) Earnings before interest, taxes, depreciation and amortization (EBITDA), Adjusted EBITDA and Adjusted EBITDA per share, Adjusted net earnings and Adjusted net earnings per share (Adjusted
EPS) as well as non-cash items are not standardized measures prescribed by International Financial Reporting Standards (“IFRS”). These non-IFRS measures do not have any standardized
meaning and may not be comparable to similar measures presented by other companies. The definition of Adjusted net earnings was amended and certain comparative figures have been
restated to conform with the current presentation. Please refer to the “Non-IFRS Measures” Section of the Company’s MD&A for the period ended June 30, 2021 for the definitions and the
12
reconciliation to IFRS measures, available on SEDAR at www.sedar.com and on Fiera Capital’s Investor Relations website at https://ir.fieracapital.com/.Adjusted EBITDA1 and Adjusted EBITDA Margin1
Quarterly Last Twelve Months
2
2
LTM Adjusted EBITDA margin trending above 30%
1) Earnings before interest, taxes, depreciation and amortization (EBITDA), Adjusted EBITDA and Adjusted EBITDA per share, Adjusted net earnings and Adjusted net earnings per share (adjusted EPS) as well as non-cash items
are not standardized measures prescribed by IFRS. These non-IFRS measures do not have any standardized meaning and may not be comparable to similar measures presented by other companies. The definition of Adjusted
net earnings was amended and certain comparative figures have been restated to conform with the current presentation. Please refer to the “Non-IFRS Measures” Section of the Company’s Management Discussion and
Analysis for the three-month period ended June 30, 2021 for the definitions and the reconciliation to IFRS measures, available on SEDAR at www.sedar.com and on Fiera Capital’s Investor Relations website at
https://ir.fieracapital.com/.
2) Adjusted EBITDA excluding the impact of dispositions. Dispositions include: the sale of the rights to manage the retail mutual funds of Fiera Investments LP in June 2020; the sale of WGAM in December 2020; the sale of Bel
Air in March 2021; and the termination of the revenue-sharing arrangement with CNR in connection with the sale of the rights to manage the Fiera Capital Emerging Markets Fund in July 2021.
13Financial Leverage trending downward
Funded Debt at Lowest Three-Year Level
Net Debt1 ($M) Funded Debt2 ($M)
Leverage Ratios
Net
Debt3
Funded
Debt4
1. Represents the carrying amounts of long-term debt, net and convertible debt, net, net of cash and cash equivalents, as reported in the condensed consolidated financial statements.
2. Represents gross long-term debt and other obligations net of cash, as calculated in accordance with the credit agreement.
3. Represents gross long-term debt and convertible debt, net of cash and cash equivalents, divided by last twelve months EBITDA as calculated in accordance with the credit agreement.
4. As calculated in accordance with the credit agreement. 14Committed to Returning Value to Shareholders
YTD 2021 – $50.7M Returned to Shareholders
Dividends
$43.6M dividends paid to shareholders in H1 2021
On August 11, 2021, dividend declared of $0.21/share (payable in September 2021)
Normal Course Issuer Bid (“NCIB”)
620,263 class A shares subordinate voting shares (“Class A Shares”) purchased for total consideration
of $7.1M in H1 2021
895,063 Class A Shares purchased since inception for total consideration of $10.1M
Renewal of NCIB announced on August 12, 2021
• The Company may purchase for cancellation up to a maximum of 4,000,000 Class A Shares
• NCIB is in effect from August 16, 2021, to August 15, 2022
15Investment Performance Update1
96% of equity AUM and 97% of fixed income AUM
beating benchmarks over 3 years2
Key Public Market Q2 2021 1-Year 3-Year
Investment Strategies1 Added Added Added
Return Return Return
value Value Value
Equity Investment Strategies
Atlas Global Companies 11.77% 5.62% 31.09% 4.67% 21.63% 8.93%
Global Equity 9.05% 2.90% 29.35% 2.93% 18.36% 5.66%
Large Cap
International Equity 8.15% 4.53% 23.62% 3.29% 14.75% 8.64%
Canadian Equity 5.63% (2.92%) 29.50% (4.35%) 13.19% 2.39%
Small Cap, U.S. Small & Mid Cap Growth 5.52% (0.51%) 58.23% 8.60% 22.83% 2.70%
Emerging and
Frontier Frontier Markets 19.10% 5.01% 81.85% 43.35% 13.54% 4.66%
Canadian Fixed Income Investment Strategies
Active Core 1.89% 0.23% (1.71%) 0.72% 4.78% 0.61%
Strategic Core 1.83% 0.17% (1.11%) 1.32% 5.19% 1.03%
Active Universe
Credit Oriented 1.81% 0.15% (1.33%) 1.10% 4.79% 0.63%
Specialized Credit 1.85% 0.19% 0.95% 3.37% 6.05% 1.89%
U.S. Fixed Income Strategies
Tax Efficient Core Plus 0.05% (0.03%) 2.65% 0.22% 4.47% 0.56%
1) For a more comprehensive list of the Company’s Public Markets investment strategies and their investment performance, refer to page 16 of the Company’s Management’s Discussion &
Analysis for the three and six months ended June 30, 2021, available on SEDAR at www.sedar.com and on Fiera Capital’s Investor Relations website at https://ir.fieracapital.com/.
2) Percentages exclude AUM in segregated accounts managed on behalf of private wealth clients, discretionary accounts, Asia-based accounts, private alternative investment strategies and
accounts for which total and relative return are not the primary measure of performance.
16Investment Performance Update1
Select Private Markets Investment Strategies
Return2 Gross IRR3 1-YR
Q2 2021 Absolute
(since inception) Absolute Return4
Return4
Real Estate
Fiera Real Estate CORE Fund L.P. 8.59% - 4.82% 14.75%
Fiera Real Estate Small Cap Industrial Fund L.P. 13.95% - 4.79% 21.34%
Infrastructure
EagleCrest Infrastructure5 - 8.90% 1.65% 6.28%
Private Debt
Fiera FP Real Estate Financing Fund, L.P. 12.86% - 2.08% 8.86%
Fiera Infrastructure Debt Fund LP 4.72% - 2.48% (0.30%)
Clearwater Capital Partners Lending Opportunities Fund, L.P. - 11.81% 2.74% 11.88%
Fiera Private Debt Fund VI 6.00% - 1.71% 6.38%
Private Debt (Fund of Funds)
Fiera Diversified Lending Fund6 6.39% - 1.44% 5.32%
Agriculture
Global Agriculture Open-End Fund L.P.7 - 8.34% 1.73% 10.58%
Private Equity
Glacier Global Private Equity Fund I L.P.7 - 20.22% 4.99% 30.35%
1) For a more comprehensive list of the Company’s Private Markets investment strategies and their investment performance, refer to page 17 of the Company’s Management’s Discussion &
Analysis for the three and six months ended June 30, 2021, available on SEDAR at www.sedar.com and on Fiera Capital’s Investor Relations website at https://ir.fieracapital.com/.
2) Annualized time weighted returns, presented gross of management and performance fees and expenses, unless otherwise stated.
3) Presented gross of management and performance fees and expenses, unless otherwise stated.
4) Gross time weighted returns, except where indicated.
5) EagleCrest represents the combined performance of EagleCrest Infrastructure Canada LP and EagleCrest Infrastructure SCSp. IRR shown gross of management fees, performance fees, fund
operating expenses and adjusted for FX movements. 17
6) Strategies with diversified allocation to various private debt LP, including some mentioned above. Presented net of management and performance fees.
7) Gross IRR net of fund operating expenses.Sub-Advisory Partnership with StonePine
On August 11, 2021, announced sub-advisory partnership with StonePine, led by Nadim Rizk, head of Fiera Capital’s
Montreal-based Global Equity team
Partnership is the outcome of thorough strategic planning and risk management by Fiera Capital
Designed to preserve long-term value for clients and shareholders
Under the terms of the agreement:
Fiera Capital StonePine
Maintains direct relationship with clients as the Provides sub-advisory investment services,
Investment Manager/Advisor overseeing investment decisions with respect to
Fiera Capital’s:
Provides StonePine with asset management Global
infrastructure services for Fiera Capital clients, EAFE
including: U.S. Equity investment strategies
Client relationship management
Compliance Supports relationship management as strategy
Global trade execution specialist
Operations
Risk management
Performance measurement and reporting
services
Technology support
Structure provides for the continuation of a relationship that has created significant value for
Fiera Capital’s clients and shareholders for more than 12 years
18Benefits of the Sub-Advisory Partnership
19APPENDIX A
Who We Are
20Fiera Capital
A Values-Driven, Leading Independent Asset Manager
FOUNDED 2003 ASSET MANAGER RANKING (by AUM)
AUM C$179.5 billion1
SYMBOL (TSX) FSZ.TO
3rd 62nd 142 nd
MARKET CAP C$1,149 million4 Canada2 North America3 Global3
Leading, independent asset management firm with a growing global presence and over C$179B1 in assets under
management (AUM)
We offer customized and multi-asset solutions across public and private market asset classes to institutional,
financial intermediary and private wealth clients across North America, Europe and key markets in Asia
We adhere to the highest governance and investment risk management standards and operate with transparency
and integrity to create value for clients and shareholders over the long term
We place a strong focus on talent to ensure we continue to deliver consistently for our clients and our shareholders,
and are guided by our values:
INTEGRITY AMBITION COLLABORATION INNOVATION EXCELLENCE
1 As at June 30, 2021
2 Source: Fiera Capital analysis, as at June 30, 2021
3 Source: Willis Towers Watson “The World’s 500 Largest Asset Managers” (2020) 21
4 Based on August 11, 2021 closing share price of $11.26Growing our Portfolio Through a Competitive
Investment Offering
AUM ($B) LTM Revenues ($M)
1) Dispositions include: the sale of the rights to manage the retail mutual funds of Fiera Investments LP in June 2020; the sale of WGAM in December 2020; the sale of Bel Air in March 2021; and the
termination of the revenue-sharing arrangement with CNR in connection with the sale of the rights to manage the Fiera Capital Emerging Markets Fund in July 2021.
22
22Expanding our Global Footprint
APPROXIMATELY 810 employees
INCLUDING SOME 250 INVESTMENT PROFESSIONALS
Calgary Halifax London
Toronto Montreal Frankfurt
Boston
Dayton
New York
Hong Kong
Singapore
As at June 30, 2021 23
23Revenue Diversification
Q2 2021 Total Revenues – $167.4M
By Geography By Distribution Channel By Asset Class1
Canada 57% Institutional 47% Equity 68%
U.S. 26% Financial intermediaries 30% Fixed income 16%
Europe and other 17% Private wealth 13% Private alternatives 15%
Other 10% Liquid alternatives
1%
and other
1 Based on estimated annualized revenues
24Underpinned by a Diversified Asset Base
AUM as at June 30, 2021 – $179.5B
By Geography By Distribution Channel By Asset Class
Canada 64% Institutional 51% Equity 51%
U.S. 24% Financial intermediaries 41% Fixed income 40%
Europe and other 12% Private wealth 8% Private alternatives 8%
Liquid alternatives
1%
and other
25Committed to Responsible Investing
2002 2009 2014 2016 2017 2018 2019 2020
New Global
Signatory of Proxy Voting Launched our
Established Member of the Subscribed to Updated Proxy Established
the United Policy first Impact
Proxy Voting Canadian MSCI ESG Voting Policy & Global ESG
Nations Fund and
Policy prior to Coalition for Manager Established Committee
Principles for Introduction of created and
the creation of Good & Global RI Policy
Responsible the internal ESG
Fiera (previous Governance Became a
Investment Responsible database
firms) (CCGG) member of RIA
(UN PRI) Investment
Spectrum
Fiera Capital’s investment process reflects its belief that organizations that successfully manage ESG
factors create more resilient businesses and assets, and are better positioned to deliver sustainable
value over the long term
26Our Strategy – Investment Approach
We differentiate ourselves by
1 2 3
Offering
Delivering True Leading
Customized
Alpha in Alternatives
Solutions
27Breadth of Innovative Investment Solutions
ASSET ALLOCATION
BALANCED MANDATES OVERLAY STRATEGIES ADVISORY
Public Markets Private Markets
Large Cap Equity strategies $5.5B Real Estate
$91.6B
Small Cap, Emerging and Frontier
Strategies $4.7B Private Debt
$165.5B Canadian Active Universe Strategies $14.0B1
$2.7B Infrastructure
LDI and Customized Strategies
$72.6B Canadian Credit Oriented and Money $0.9B Agriculture
Market
U.S. Fixed Income Strategies $0.2B Private Equity
$1.3B Liquid Alternatives
LIABILITY-DRIVEN INVESTMENTS SYSTEMATIC SOLUTIONS CURRENCY HEDGING
MULTI-ASSET CLASS SOLUTIONS
1) Includes $1.5 billion of committed, undeployed capital
Totals and subtotals may not reconcile due to rounding.
28Committed to Long-Term Investment Excellence
Over 90% of AUM Beating Benchmarks1
Equity Fixed Income
1) Percentages exclude AUM in segregated accounts managed on behalf of private wealth clients, discretionary accounts, Asia-based accounts, private alternative investment strategies and
accounts for which total and relative return are not the primary measure of performance.
29APPENDIX B
Returning Value to Shareholders
30Rewarding Shareholders
($ per share)
1,2
1) Earnings before interest, taxes, depreciation and amortization (EBITDA), adjusted EBITDA and Adjusted EBITDA per share, Adjusted net earnings and Adjusted net earnings per share (Adjusted EPS) as well as non-cash items
are not standardized measures prescribed by International Financial Reporting Standards (“IFRS”). These non-IFRS measures do not have any standardized meaning and may not be comparable to similar measures
presented by other companies. The definition of adjusted net earnings was amended and certain comparative figures have been restated to conform with the current presentation. Please refer to the “Non-IFRS Measures”
Section of the Company’s MD&A for the definitions and the reconciliation to IFRS measures, available on SEDAR at www.sedar.com and on Fiera Capital’s Investor Relations website at https://ir.fieracapital.com/.
2) The Company adopted IFRS 16, Leases, on January 1, 2019 using the modified retrospective approach where comparative information presented for 2018 has not been restated and is presented as previously reported and,
therefore, may not be comparable. Prior to the adoption of IFRS 16 on January 1, 2019, as a lessee, the Company classified leases as an operating lease or finance lease under IAS 17, based on its assessment of whether the
lease transferred substantially of the risks and rewards of ownership. Rent expenses related to operating leases were previously recognized in selling, general and administrative expenses. For the three-month periods ended
March 31, 2018, June 30, 2018, September 30, 2018 and December 31, 2018, the Company recognized rent expense of $3.0 million, $3.3 million, $3.4 million and $3.4 million, respectively. For the twelve-month period ended
December 31, 2018, the Company recognized rent expense of $13.1 million in selling, general and administrative expenses. Following the adoption of IFRS 16, lease payments are presented as cash generated (used in)
financing activities whereas prior to the adoption of IFRS 16, on January 1, 2019, they were presented as cash generated (used in) operating activities in the statement of cash flows. Refer to Note 2 of the audited
consolidated financial statements for the year ended December 31, 2019 for further details on the transition to IFRS 16. The Company's lease portfolio in 2019 was impacted by the four acquisitions completed over the
course of the year, in addition to new leases entered into in 2019 related to the Company's new headquarters in Montreal, Canada and new office premises in London, United Kingdom. Our lease payments presented in the
statement of cash flows for the twelve-month period ended December 31, 2019 were also impacted by lease inducements and rent-free periods related to these new leases in 2019. 31Thank You
Investor Relations Contact:
Mariem Elsayed
Director, Investor Relations
melsayed@fieracapital.com
T 514 954-6619
32Important Disclosures
Fiera Capital Corporation is a global asset management firm with affiliates in various jurisdictions (collectively, “Fiera Capital”). The information and opinions
expressed herein are provided for informational purposes only. It is subject to change and should not be relied upon as the basis of any investment or disposition
decisions. While not exhaustive in nature, these Important Disclosures provide important information about Fiera Capital and its services and are intended to be read
and understood in association with all materials available on Fiera Capital’s websites.
Past performance is no guarantee of future results. All investments pose the risk of loss and there is no guarantee that any of the benefits expressed herein will be
achieved or realized. Valuations and returns are computed and stated in Canadian dollars, unless otherwise noted.
The information provided herein does not constitute investment advice and should not be relied on as such. It should not be considered a solicitation to buy or an
offer to sell any security or other financial instrument. It does not take into account any investor’s particular investment objectives, strategies, tax status or
investment horizon. There is no representation or warranty as to the current accuracy of, or responsibility for, decisions based on such information. Any opinions
expressed herein reflect a judgment at the date of publication and are subject to change at any point without notice. Although statements of fact and data contained
in this presentation have been obtained from, and are based upon, sources that Fiera Capital believes to be reliable, we do not guarantee their accuracy, and any
such information may be incomplete or condensed. No liability will be accepted for any direct, indirect, incidental or consequential loss or damage of any kind arising
out of the use of all or any of this material. Any charts, graphs, and descriptions of investment and market history and performance contained herein are not a
representation that such history or performance will continue in the future or that any investment scenario or performance will even be similar to such chart, graph,
or description.
Any charts and graphs contained herein are provided as illustrations only and are not intended to be used to assist the recipient in determining which securities to
buy or sell, or when to buy or sell securities. Any investment described herein is an example only and is not a representation that the same or even similar
investment scenario will arise in the future or that investments made will be as profitable as this example or will not result in a loss. All returns are purely historical,
are no indication of future performance and are subject to adjustment.
Each entity of Fiera Capital only provides investment advisory services or offers investment funds only in those jurisdictions where such entity and/or the relevant
product is registered or authorized to provide such services pursuant to an applicable exemption from such registration. Thus, certain products, services, and
information related thereto provided in the materials may not be available to residents of certain jurisdictions. Please consult the specific disclosures relating to the
products or services in question for further information regarding the legal requirements (including any offering restrictions) applicable to your jurisdiction. For
details on the particular registration of, or exemptions therefrom relied upon by, any Fiera Capital entity, please consult https://www.fieracapital.com/en/fiera-
capital-entities.
www.fiera.com
33You can also read