2020 Half-year Results Briefing Presentation - To be held on Wednesday 19 February 2020 - Wesfarmers ...

Page created by Scott Schroeder
 
CONTINUE READING
2020 Half-year Results Briefing Presentation - To be held on Wednesday 19 February 2020 - Wesfarmers ...
2020 Half-year Results
Briefing Presentation
To be held on Wednesday 19 February 2020
2020 Half-year Results Briefing Presentation - To be held on Wednesday 19 February 2020 - Wesfarmers ...
Presentation outline

Item                                        Presenter                 Page

Group Performance Overview                  Rob Scott                         3

Group Balance Sheet and Cash Flow     Anthony Gianotti                     12

Bunnings Australia and New Zealand   Michael Schneider                     21

Kmart Group                                 Ian Bailey                     26

Industrials                               David Baxby                      31

Officeworks                            Michael Howard                      38

Group Outlook                               Rob Scott                      44

                                                         2020 Half-year results | 2
2020 Half-year Results Briefing Presentation - To be held on Wednesday 19 February 2020 - Wesfarmers ...
Group Performance Overview
Rob Scott
Managing Director, Wesfarmers Limited
2020 Half-year Results Briefing Presentation - To be held on Wednesday 19 February 2020 - Wesfarmers ...
Continued focus on sustainable value creation over the long term

         Wesfarmers’ primary objective is to provide a satisfactory return to shareholders

We believe it is only possible to achieve this over the long term by:

Anticipating the needs of our          Looking after our team           Engaging fairly with our
customers and delivering               members and providing a safe,    suppliers and sourcing ethically
competitive goods and services         fulfilling work environment      and sustainably

Supporting the communities             Taking care of the environment   Acting with integrity and
in which we operate                                                     honesty in all of our dealings

                                                                                           2020 Half-year results | 4
2020 Half-year Results Briefing Presentation - To be held on Wednesday 19 February 2020 - Wesfarmers ...
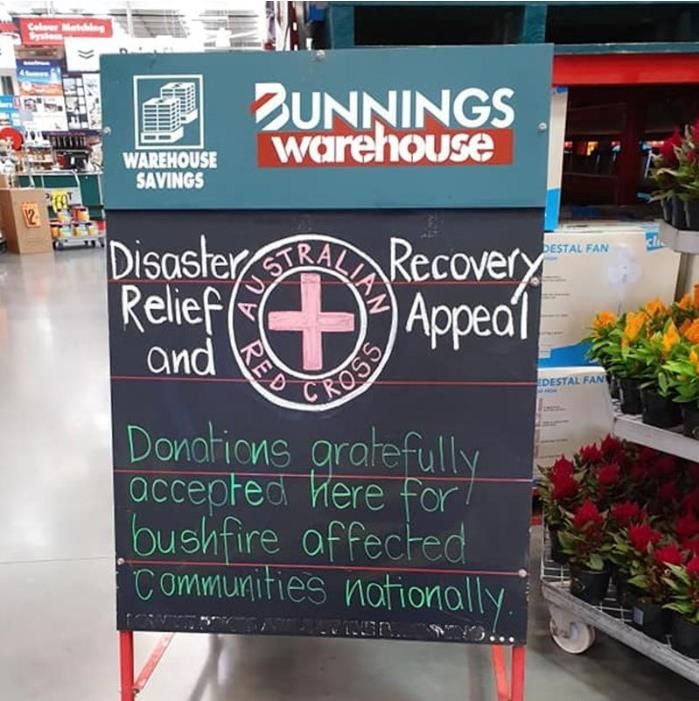
Response to Australian bushfires

• Across the Group, our businesses were able to respond
  directly to assist their local communities
  – Donation of critical products and in-kind support at time
    of need
  – Immediate action to source extra supplies of urgently
    needed products
  – Tireless effort from team members across all businesses

• Wesfarmers, together with team members and customers,
  contributed $4m in cash and in-kind donations

• Additional paid volunteer leave for all permanent team
  members across the Group

• Our businesses will continue to support their local
  communities during the recovery and rebuild process

• Team member safety, wellbeing and support remains the
  priority

                                                                2020 Half-year results | 5
2020 Half-year Results Briefing Presentation - To be held on Wednesday 19 February 2020 - Wesfarmers ...
Financial overview

                                                                                                         2019          2019       2018            Variance
 Half-year ended 31 December ($m)1                                                                 Post AASB 16   Pre AASB 16   Reported                       %2

 Revenue                                                                                               15,249        15,249     14,388                       6.0
 EBIT                                                                                                   1,734         1,637      1,645                    (0.5)
 EBIT (after interest on lease liabilities)                                                             1,615         1,637      1,645                    (0.5)
 NPAT                                                                                                   1,127         1,142      1,080                       5.7
 Basic earnings per share (cps)                                                                           99.6        101.0        95.5                      5.7
 Dividend per share (cps)                                                                                   75            75       100                  (25.0)

• Result underpinned by strong performance of the Group’s largest businesses, Bunnings and Kmart,
  and ongoing solid performance in WesCEF
• Strict working capital management and disciplined capital expenditure resulted in strong cash flow
  generation across operating divisions
• Pleasing revenue growth of 6.0%, reflecting strong sales growth in Bunnings, Kmart and Officeworks
• NPAT (pre AASB 16) up 5.7% to $1,142m
• Interim, fully-franked dividend of 75 cents per share
    – Change from previous corresponding period reflects demerger of Coles and divestment of Bengalla
    To facilitate a comparison to the prior corresponding period, pre AASB 16 financial information, a non-IFRS measure, has been
                               included in this presentation and is the focus of performance commentary.
1. Continuing operations only. Further detail on discontinued operations is set out on slide 51.
2. Variance calculated on pre AASB 16 results.
                                                                                                                                           2020 Half-year results | 6
2020 Half-year Results Briefing Presentation - To be held on Wednesday 19 February 2020 - Wesfarmers ...
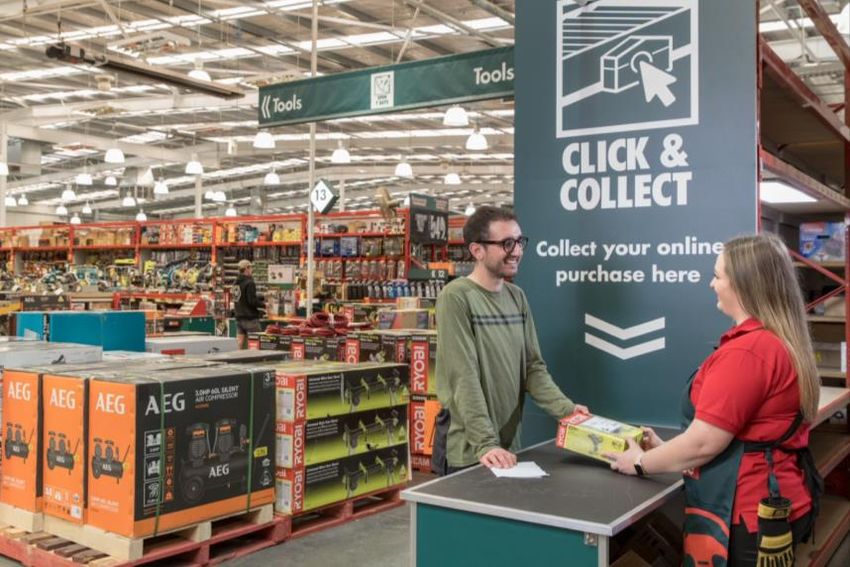
Divisional sales performance

 Sales performance ($m)                                                                                                                                          2018
 Half-year ended 31 December1                                                                                                                                    2019

                                                     Retail sales (excludes Catch)                                              Revenue

                  +5.3%                             +7.6%                             (4.3%)           +11.5%         +1.7%                 (2.1%)

                        7,275
             6,907

                                               3,176      3,417

                                                                                 1,559      1,492
                                                                                                    1,100   1,226
                                                                                                                    874   889             876         858

                Bunnings                            Kmart                            Target         Officeworks     WesCEF          Industrial and Safety

 • Pleasing momentum across Bunnings, Kmart and Officeworks following strong operational execution
   and continued focus on customers
 • Underpinned by strong growth in online sales of 35%2 for the half and continued improvement in
   sales density

1. Continuing operations only. Further detail on discontinued operations is set out on slide 51.
2. Excludes Catch.
                                                                                                                                                2020 Half-year results | 7
2020 Half-year Results Briefing Presentation - To be held on Wednesday 19 February 2020 - Wesfarmers ...
Divisional earnings performance

 Earnings Before Tax (EBT) ($m)                                                             2019                      2019                     2018                     Var       % of divisional
 Half-year ended 31 December1                                                  Post AASB 16                 Pre AASB 16                   Reported                          %2         EBT

 Bunnings                                                                                     938                        961                      932                       3.1

 Kmart Group3                                                                                 343                        345                      383                 (9.9)

 Officeworks                                                                                     82                        79                       76                      3.9

 WesCEF                                                                                       173                        174                      185                 (5.9)

 Industrial and Safety4                                                                            7                          6                     42              (85.7)

1.   Continuing operations only. Further detail on discontinued operations is set out on slide 51. Divisional EBT does not include any allocation of Group finance costs.
2.   Variance calculated on pre AASB 16 results.
3.   2019 includes $9m of payroll remediation costs relating to Target.                                                                                                               2020 Half-year results | 8
4.   2019 Includes $15m of payroll remediation costs.
2020 Half-year Results Briefing Presentation - To be held on Wednesday 19 February 2020 - Wesfarmers ...
Divisional return on capital

 Rolling 12 months to
 31 December1                                                               2019                                                                     2018
                                                         EBT             Cap Emp2                     RoC                         EBT             Cap Emp2        RoC                   Var3
                                                          ($m)                       ($m)                (%)                       ($m)                   ($m)     (%)                  (ppt)

 Bunnings                                              1,655                       3,171               52.2                      1,572                   3,133    50.2                     2.0

 Kmart Group4                                              502                     1,990               25.2                         612                  1,806    33.9                  (8.7)

 Officeworks                                               170                     1,004               16.9                         164                     951   17.2                  (0.3)

 WesCEF                                                    422                     1,579               26.7                         383                  1,304    29.4                  (2.7)

 Industrial and Safety5                                      50                    1,482                  3.4                       109                  1,446     7.5                  (4.1)

     • Return on capital performance reflects strict working capital management and disciplined capital
       expenditure across the Group’s operating divisions

     • Increased capital employed in Kmart Group and WesCEF reflect part-year impact of Catch and
       Kidman acquisitions
1.   Continuing operations only. Further detail on discontinued operations is set out on slide 51.
2.   Capital employed excludes impact of AASB 16 as lease liabilities and right-of-use balances are not available for the rolling twelve month period.
3.   Variance calculated on pre AASB 16 results.                                                                                                                         2020 Half-year results | 9
4.   2019 includes $9m of payroll remediation costs relating to Target.
5.   2019 Includes $15m of payroll remediation costs.
2020 Half-year Results Briefing Presentation - To be held on Wednesday 19 February 2020 - Wesfarmers ...
Managing businesses for long-term value creation

Our divisions remain focused on long-term value creation

1                                    2                                  3    Building on unique
      A relentless focus                   Investing for the
                                                                              capabilities and
        on customers                          long term
                                                                                  platforms
• Maintaining price leadership       • Constant product innovation      • Leading market positions
• Investing in data and digital to   • Improving back-end systems       • Scalable platforms
  better meet the evolving needs       and processes                    • Expanding addressable markets
  of customers                       • Disciplined pursuit of value-      by developing new channels,
• Ensuring reliable and high           accretive opportunities to add     products or services
  quality supply through               capabilities, channels or new    • People with extensive operating
  operational excellence               technology                         experience and knowledge
• Engaging deeply in the
  communities where we operate

                                                                                          2020 Half-year results | 10
Group performance summary

                                                                                                                         2019                         2019                    2018                       Var
 Half-year ended 31 December ($m)                                                                            Post AASB 16                  Pre AASB 16                      Reported                        %1

 Results from continuing operations
 EBIT                                                                                                                  1,734                        1,637                    1,645                     (0.5)
 EBIT (after interest on lease liabilities)                                                                            1,615                        1,637                    1,645                     (0.5)
 NPAT                                                                                                                  1,127                        1,142                    1,080                       5.7
 Basic earnings per share (cps)                                                                                           99.6                      101.0                      95.5                      5.7
 Results including discontinued operations2
 NPAT from discontinued operations                                                                                           83                           83                 3,458                     n.m.
 NPAT                                                                                                                  1,210                        1,225                    4,538                     n.m.
 Operating cash flow                                                                                                   2,131                        1,666                    1,987                   (16.2)
 Net capital expenditure                                                                                                   207                         207                     678                   (69.5)
 Free cash flow                                                                                                        1,039                           574                   2,393                   (76.0)
 Dividend per share (cps)                                                                                                    75                           75                   100                   (25.0)
 Net financial debt3                                                                                                   2,317                        2,317                      324                     n.m.

n.m. = not meaningful
1. Variance calculated on pre AASB 16 basis.
2. Further detail on discontinued operations is set out on slide 51.                                                                                                                   2020 Half-year results | 11
3. Interest bearing liabilities less cash at bank and on deposit, net of cross-currency interest rate swaps and interest rate swap contracts. Excludes lease liabilities.
Group Balance Sheet and Cash Flow
Anthony Gianotti
Chief Financial Officer, Wesfarmers Limited
Other business performance summary

                                                                                        Holding                             2019                     2019                     2018                       Var
 Half-year ended 31 December ($m)                                                              %                Post AASB 16               Pre AASB 16                   Reported                           %1

 Share of profit of associates and joint ventures
 Coles                                                                                        15                                 73                       73                       23                   n.m.
 BWP Trust                                                                                    25                                 34                       34                       20                   70.0
 Other associates and joint ventures2,3                                                   Various                                27                       27                       22                   22.7
 Sub-total share of profit of associates and joint ventures                                                                    134                      134                        65                   n.m.

 Interest revenue4                                                                                                                 4                        4                        9                (55.6)

 Other3,5                                                                                                                          2                        2                      27                 (92.6)

 Corporate overheads                                                                                                          (68)                     (68)                      (74)                   (8.1)

 Total Other                                                                                                                     72                       72                       27                   n.m.
n.m. = not meaningful
1. Variance calculated on pre AASB 16 results.
2. Includes investments in Gresham, flybuys, Wespine and BPI.
3. 2018 includes $42m gain on investment in Barminco following purchase by Ausdrill. $9m of this gain relates to the Group’s indirect interest held in Other associates and joint ventures. The remaining $33m is
   recognised in Other.
4. 2018 excludes interest revenue from Quadrant Energy loan notes.
5. 2019 includes $9m from the Curragh value sharing arrangement.
   2018 includes $16m from the Curragh value sharing arrangement.

                                                                                                                                                                                       2020 Half-year results | 13
Operating cash flows

• Divisional cash generation1 from continuing                                                                                        Divisional cash generation1
                                                                                                             %
  operations up 11 ppt to 126%                                                                                                     excluding discontinued operations2
                                                                                                            160
    – 1H20 operating cash flows before tax from                                                             140                                          1H16 – 1H20 average = 125%
      divisions increased 4% to $2,179m                                                                     120
                                                                                                            100
• Reported operating cash flows decreased as
                                                                                                              80
  the prior period included operating cash flows                                                              60
  from Coles and other discontinued operations                                                                40

• Group cash realisation ratio3 improved to                                                                   20
                                                                                                               0
  117%                                                                                                                      1H16        1H17      1H18       1H19              1H20

    – Strong divisional cash flow performance
    – Higher dividends received from associates,
      including Coles

1. Divisional operating cash flows before tax after net capital expenditure divided by divisional pre AASB 16 EBIT.
2. 1H16 to 1H18 includes contribution from KTAS and Quadrant.
                                                                                                                                                                  2020 Half-year results | 14
3. Operating cash flows as a percentage of net profit after tax, before depreciation, amortisation and significant items.
Working capital and free cash flow

• Positive working capital result from continuing                      Half-year ended 31 December ($m)           2019            2018
  operations, albeit lower than 1H19
                                                                       Working capital movements (continuing operations)
    – Unfavourable timing of shipments and                             Cash movement inflow/(outflow)
      exchange rate movements in Fertilisers                           Receivables and prepayments                    96              46
                                                                       Inventory                                   (286)           (478)
    – Partially offset by improved inventory                           Payables                                      454             762
      management at Bunnings and Kmart                                 Total                                         264             330
                                                                       Working capital cash movement
• Free cash flow decreased on prior year                               Retail                                        385             389
  primarily due to:                                                    Industrials and Other                       (121)             (59)
                                                                       Total                                         264             330
    – Acquisitions of Kidman and Catch totalling
      approximately $1.0b                                              Working capital movements (incl. discontinued operations)1
                                                                       Cash movement inflow/(outflow)
    – Prior period includes proceeds from                              Receivables and prepayments                    96              73
      divestment of Bengalla, Quadrant and KTAS                        Inventory                                   (286)           (687)
      as well as operating cash flows from                             Payables                                      454             930
      divested businesses and Coles                                    Total                                         264             316
                                                                       Working capital cash movement
                                                                       Retail                                        385             362
                                                                       Industrials and Other                       (121)             (46)
                                                                       Total                                         264             316

1. Further detail on discontinued operations is set out on slide 51.

                                                                                                                   2020 Half-year results | 15
Capital expenditure

                                                                       Half-year ended 31
• Gross capital expenditure from continuing                            December ($m)1                   2019    2018          Var %
  operations of $455m in line with prior period
                                                                       Bunnings                          269      240             12.1
    – Higher capital expenditure in Bunnings from
      development of digital offer                                     Kmart Group                        80      119          (32.8)

    – Higher capital expenditure in WesCEF                             WesCEF                             50        32            56.3

      primarily due to Covalent Lithium                                Industrial and Safety              33        46         (28.3)

    Offset by:                                                         Officeworks                        22        20            10.0

    – Decrease in Kmart Group due to timing of                         Other                               1          2        (50.0)
      store refurbishments                                             Gross capital expenditure         455      459             (0.9)

    – One-off investment in Coregas healthcare                         Sale of PP&E                     (248)   (245)               1.2
      offering in prior period                                         Net capital expenditure           207      214             (3.3)

• Proceeds from property disposals include                             Net capital expenditure in
                                                                                                            -     464             n.m.
                                                                       discontinued operations2
  Bunnings property disposals of $224m
• Modest decrease in net capital expenditure in                        Group (including discontinued)
  continuing operations to $207m
                                                                       Gross capital expenditure         455      955          (52.4)
• FY20 net capital expenditure of                                      Sale of PP&E                     (248)   (277)          (10.5)
  $500m to $700m expected, subject to net
  property investment                                                  Net capital expenditure           207      678           (69.5)
                                                                       n.m. = not meaningful

1. Capital investment provided on a cash basis.
2. Further detail on discontinued operations is set out on slide 51.
                                                                                                                2020 Half-year results | 16
Impact of adopting new leasing standard (AASB 16)

• Wesfarmers has applied AASB 16 from 1 July 2019

• Adopted the ‘modified retrospective approach’
  – Comparative periods will not be restated

• Recognised lease liabilities of $7.3b and right-of-use assets of $6.4b on application of the standard
  – Net impact of $518m on initial application recognised directly in equity as leasing reserve

• Adoption of AASB 16 has also resulted in $580m decrease in occupancy expenses, offset by $464m
  increase in depreciation on the right-of-use assets and increase in interest on lease liabilities of $119m

• Reduction in gains on sale recognised on sale and leaseback transactions
  – Offset by lower depreciation for the term of the lease

• As previously announced, the adoption of AASB 16 will have:
  – No material net impact on Group NPAT
  – No impact on net cash flows
  – No impact on debt covenants and is not expected to result in a change in the Group’s credit ratings
  – No change to Group decision-making processes

• Further detail on the impact of AASB 16 on financial statements set out on slides 48 to 50

                                                                                               2020 Half-year results | 17
Balance sheet and debt management

• Net financial debt1 of $2.3b as at
                                                                                                                                                 Debt maturity profile2
  31 December 2019, up from $2.1b at                                                                             $m
                                                                                                               1,200
  30 June 2019
                                                                                                                  900

• Finance costs decreased to $69m in 1H20                                                                         600

  (1H19: $97m) due to lower average debt                                                                          300
  balances and a decrease in all-in effective                                                                        0
  borrowing costs to 4.78% (1H19: 4.90%)                                                                        (300)

    – All-in borrowing cost expected to reduce                                                                  (600)
                                                                                                                                 FY20                   FY21                 FY22               FY23
      further following maturity of $350m medium                                                                                  Bank facilities         Capital markets         Cash & cash equivalents
      term note (coupon of 4.750%) in March 2020

• Strong credit metrics and stable credit ratings                                                                  $m
                                                                                                                          Finance costs and weighted average cost of
                                                                                                                  180                        debt                   6.0%
    – Moody’s A3 (stable outlook)                                                                                 150                                                                                          5.0%

    – Standard and Poor’s A- (stable outlook)                                                                     120                                                                                          4.0%

                                                                                                                   90                                                                                          3.0%
• Subsequent to period end, the Group sold a                                                                       60                                                                                          2.0%
  4.9% interest in Coles                                                                                           30                                                                                          1.0%

    – Maintains a 10.1% interest in Coles and the                                                                    0
                                                                                                                              1H16               1H17              1H18           1H19           1H20
                                                                                                                                                                                                               0.0%

      right to nominate a director                                                                                                Finance costs [LHS]                 Weighted average cost of debt [RHS]

    – Gross proceeds of approximately $1b
1. Interest bearing liabilities less cash at bank and on deposit, net of cross-currency interest rate swaps and interest rate swap contracts. Excludes lease liabilities.
2. As at 31 December 2019.
                                                                                                                                                                                         2020 Half-year results | 18
Management of lease portfolio

  • Undiscounted lease commitments                                                                                        Weighted average lease terms (%)1
    totalled $8.7b and represent 77% of                                                                        3.1%                                 1.7%                                0.5%
                                                                                                                                 2.2%                               0.6%
    Group fixed financial obligations as at                                                                                      12.3%             12.1%
                                                                                                                                                                    6.8%                6.2%
                                                                                                              12.9%
    31 December 2019
                                                                                                                                                                   32.9%                32.6%
                                                                                                              31.4%              32.3%             32.3%
  • Shorter average remaining lease tenure
    of 5.0 years1 (FY19: 5.1 years),
    complemented by extension options to                                                                                                                           59.7%                60.7%
                                                                                                              52.6%              53.2%             53.9%
    maintain security of tenure
      – Reflects disciplined management of
                                                                                                               FY16              FY17               FY18            FY19                1H20
        leases in retail businesses
                                                                                                                          15 years
  • Continued focus on lease-adjusted
    return on capital as a key hurdle for                                                                                      Fixed financial obligations
    property leasing divisions
                                                                                                                                                                            Bank
                                                                                                                                                                         facilities &
                                                                                                                                                                           bonds
                                                                                                                                                                            23%

                                                                                                                      Operating
                                                                                                                       leases2
                                                                                                                         77%

1. Average lease tenure calculated as weighted average of dollar commitments by year. Excludes discontinued operations.
2. Represents future undiscounted minimum rentals payable under non-cancellable operating leases.
                                                                                                                                                                            2020 Half-year results | 19
Dividends and capital management

• Dividend distributions subject to franking      $/share
                                                              Shareholder distributions (declared)
  credit availability, earnings, credit metrics    3.50

  and cash flow                                   3.00                                                2.78

  – Maximising value of franking credits for      2.50
                                                            2.00
                                                                       1.86
                                                                                  2.23        2.23
                                                                                                      1.00
                                                  2.00
    shareholders                                                                  1.20        1.20
                                                  1.50      1.11                                      0.78
                                                                       0.95

• Fully-franked half-year ordinary dividend of    1.00

                                                  0.50                            1.03        1.03    1.00
  $0.75 per share                                           0.89       0.91                                        0.75
                                                  0.00
  – Reflects earnings from continuing                       FY15       FY16       FY17       FY18     FY19         1H20

                                                               Interim dividend      Final dividend   Special dividend
    operations and 15% interest in Coles
• Dividend record date 25 February 2020;
  dividend payable 31 March 2020
• Dividend investment plan: not underwritten;
  last day for application 26 February 2020
  – Dividend investment plan shares
    expected to be purchased on market

                                                                                                       2020 Half-year results | 20
Bunnings Australia and New Zealand
Michael Schneider
Managing Director, Bunnings Group
Bunnings performance summary
                                                                                                                        2019                       2019                          2018                 Var
 Half-year ended 31 December ($m)                                                                           Post AASB 16                 Pre AASB 16                     Reported                        %1

 Revenue                                                                                                               7,276                      7,276                      6,909                     5.3
 EBITDA                                                                                                                1,316                      1,059                      1,027                     3.1
 Depreciation and amortisation                                                                                          (321)                        (98)                         (95)               (3.2)
 EBIT                                                                                                                     995                         961                         932                  3.1
 Interest on lease liabilities                                                                                            (57)                             -                         -               n.m.
 EBT                                                                                                                      938                         961                         932                  3.1
 Net property contribution2                                                                                                  22                         42                         51              (17.6)
 EBT (excluding net property contribution)                                                                                916                         919                         881                  4.3
 EBT margin excluding property (%)                                                                                       12.6                       12.6                         12.8
 RoC3 (R12, %)                                                                                                           51.5                       52.2                         50.2
 Safety (R12, TRIFR)                                                                                                     10.4                       10.4                         12.0
 Total store sales growth4                                                                                                 5.8                         5.8                        5.5
 Store-on-store sales growth4                                                                                              4.7                         4.7                        4.0
n.m. = not meaningful

1. Variance calculated on pre AASB 16 results.
2. Due to the adoption of AASB 16, the 2019 net property contribution is $20 million lower due to a change in the recognition of gains on sale and leaseback transactions. The
   lower gain on sale will be offset through lower depreciation over the life of the relevant lease.                                                                                2020 Half-year results | 22
3. Pre AASB 16 RoC is calculated as EBIT / capital employed. Post AASB 16 RoC is calculated as EBT / capital employed, where capital employed excludes right-of-use assets
   and lease liabilities.
4. Refer to slide 55 for relevant retail calendars.
Bunnings performance summary

• Revenue growth of 5.3% to $7,276m
  – Total store sales growth of 5.8%
  – Store-on-store growth of 4.7%
  – Growth across all major trading regions

• Earnings increased 3.1% to $961m
  – Lower net property contribution

• Earnings excluding property contribution increased 4.3%
  – Additional operating costs of $10m associated with
    digital investment
  – Ongoing focus on operating model efficiencies and
    store cost control
• RoC (R12) increased 2.0 ppt to 52.2%
  – Property recycling program
  – Strong working capital focus

                                                            2020 Half-year results | 23
Bunnings progress on strategic agenda

• Even Stronger Offer
  – 8 new trading locations opened
  – 8 store upgrades and expansions
  – Continued range expansion and innovation
  – Ongoing investment in customer value
  – Assembly and installation offer expanded to 35 services
  – Product training delivered to more than 1,400 new
    category experts
• Accelerate Trade Growth
  – Growing engagement – over 700,000 active customers
    currently on PowerPass
  – Expansion of product range and improved service
  – Acquisition of Adelaide Tools (subject to regulatory
    approval)
• Fuelled by Data and Digital
  – Click and collect now available across Australia; click
    and deliver available in over 100 stores
  – Bunnings MarketLink launched in November 2019
  – Productivity and inventory optimisation enhanced by
    use of analytics

                                                              2020 Half-year results | 24
Bunnings outlook

• Moderated trading conditions expected to
  continue
  – Customers remain cautious while significant
    weather events and bushfires continue to
    impact communities around Australia

• Further investment in data and digital capabilities
  – Focus on building click and collect offer in
    New Zealand
  – Establishing Bunnings technology centre in
    Bangalore

• Well-positioned for continued growth
  – Broader commercial market focus
  – Ongoing investment in customer value

• Continued network investment and expansion
  – 13 new stores under construction
  – 5 upgrades and expansions to be completed

• Ongoing support for local communities

                                                        2020 Half-year results | 25
Kmart Group
Ian Bailey
Managing Director, Kmart Group
Kmart Group performance summary

                                                                                                                        2019                       2019                      2018                     Var
 Half-year ended 31 December ($m)1                                                                          Post AASB 16                 Pre AASB 16                     Reported                       %2

 Revenue                                                                                                                4,990                     4,990                      4,639                     7.6
 EBITDA                                                                                                                    687                       453                        480                 (5.6)
 Depreciation and amortisation                                                                                          (292)                      (108)                        (97)              (11.3)
 EBIT                                                                                                                      395                       345                        383                 (9.9)
 Interest on lease liabilities                                                                                            (52)                             -                         -               n.m.
 EBT                                                                                                                       343                       345                        383                 (9.9)
 Payroll remediation costs3                                                                                                 (9)                        (9)                           -               n.m.
 EBT excluding payroll remediation costs3                                                                                  352                       354                        383                 (7.6)
 EBT margin excluding payroll remediation costs3 (%)                                                                        7.1                        7.1                       8.3
 RoC4 (R12, %)                                                                                                            25.1                      25.2                       33.9
 Safety (R12, TRIFR)                                                                                                      16.0                      16.0                       21.0
 Kmart:                  Total sales growth5 (%)                                                                            7.6                        7.6                       1.0
                         Comparable sales growth5 (%)                                                                       5.5                        5.5                     (0.6)

 Target:                 Total sales growth5 (%)                                                                         (4.3)                      (4.3)                        0.3
                          Comparable sales growth5 (%)                                                                   (2.3)                      (2.3)                        0.5
n.m. = not meaningful

1.   2019 includes Catch from 12 August 2019. 2018 excludes KTAS trading performance and gain on disposal of KTAS.
2.   Variance calculated on pre AASB 16 results.
3.   2019 payroll remediation costs relate to Target.                                                                                                                              2020 Half-year results | 27
4.   Pre AASB 16 RoC is calculated as EBIT / capital employed. Post AASB 16 RoC is calculated as EBT / capital employed, where capital employed excludes right-of-use assets and lease liabilities.
5.   Excludes Catch. Refer to slide 55 for relevant retail calendars.
Kmart Group sales overview

• Revenue increased by 7.6% to $4,990m
  – Kmart sales increased $241m, more than offsetting a $67m
    decline in Target

• Kmart total sales growth of 7.6% reflected a continued focus on
  lowest price positioning, stronger operational execution and
  enhancements to the product range
  – Growth achieved across all categories, particularly in
    womenswear and home

• Target sales decline driven by reduction in customer transactions
  with key categories in apparel performing poorly
  – Total sales decline impacted by store closures

• Catch growth continues, with gross transaction value increasing
  21.4% in the period under Wesfarmers’ ownership
  – Enhanced Club Catch offer
  – Offering click and collect for Catch products in some Target
    stores

                                                                      2020 Half-year results | 28
Kmart Group earnings overview

• Earnings decreased by 9.9% to $345m
    – Excluding a one-off provision for payroll remediation in Target, earnings decreased 7.6%

• Kmart earnings growth driven by strong sales growth and improved execution
    – Despite unfavourable foreign exchange rate impacts and higher team member wages following the
      implementation of the new enterprise agreement

• Target earnings were below expectations and declined significantly due to weaker sales performance

• Earnings reflect investment of approximately $15m to develop retail technology and digital capabilities,
  including Anko

• Disciplined capital management
    – Ongoing focus on inventory health
    – Disciplined and integrated management of the store network:
        o       Kmart – opened five new stores1 and completed 10 store refurbishments
        o       Target – closed four stores as it continued to reposition its store network

1. Including one replacement store.

                                                                                              2020 Half-year results | 29
Kmart Group outlook

• Kmart remains well-positioned in the market
  – Expected to continue to offset the cost impacts from lower
    exchange rates and higher team member wages

• Target performance is unlikely to improve materially in the near
  term
  – Continue to focus on reducing costs by further leveraging the
    Kmart Group, accelerating the optimisation of the store
    network and improving the offer in destination categories

• Investment in digital capability, including through Catch, to meet
  evolving customer expectations and shopping behaviour
  – Continued focus on growing gross transaction value in Catch

• Kmart Group is closely monitoring the coronavirus outbreak and
  its impact on product availability
  – While current impact is minor, it remains a dynamic situation
    that is progressing daily

                                                                       2020 Half-year results | 30
Industrials
David Baxby
Managing Director, Industrials
Chemicals, Energy and Fertilisers performance summary
                                                                                                                        2019                       2019                      2018                     Var
 Half-year ended 31 December ($m)1                                                                          Post AASB 16                 Pre AASB 16                     Reported                       %2

 Revenue3                                                                            Chemicals                             510                       510                        502                    1.6
                                                                                           Energy                          219                       219                        233                 (6.0)
                                                                                      Fertilisers                          160                       160                        139                  15.1
                                                                                              Total                        889                       889                        874                    1.7
 EBITDA                                                                                                                    214                       212                        221                 (4.1)
 Depreciation and amortisation                                                                                            (41)                       (38)                       (36)                (5.6)
 EBIT                                                                                                                      173                       174                        185                 (5.9)
 Interest on lease liabilities                                                                                                  -                          -                         -               n.m.
 EBT                                                                                                                       173                       174                        185                 (5.9)
 External sales volumes4 ('000 tonnes)                                               Chemicals                             568                       568                        546                    4.0
                                                                                               LPG                           75                         75                        75                       -
                                                                                      Fertilisers                          324                       324                        301                    7.6
 RoC5 (R12, %)                                                                                                            26.7                      26.7                       29.4
 Safety (R12, TRIFR)                                                                                                        3.1                        3.1                       5.3
n.m. = not meaningful

1.   2019 includes Australian Light Minerals, the holding company for WesCEF’s 50% interest in the Covalent Lithium joint venture, from 23 September 2019. 2018 excludes Quadrant Energy.
2.   Variance calculated on pre AASB 16 results.
3.   Excludes intra-division sales.                                                                                                                                                2020 Half-year results | 32
4.   External sales exclude AN volumes transferred between Chemicals and Fertilisers business segments.
5.   Pre AASB 16 RoC is calculated as EBIT / capital employed. Post AASB 16 RoC is calculated as EBT / capital employed, where capital employed excludes right-of-use assets and lease liabilities.
Chemicals, Energy and Fertilisers overview

• Revenue of $889m up 1.7% on pcp, reflecting volume growth in Chemicals and Fertilisers, offset by
  lower energy prices (including Saudi CP1) and flat LPG volumes
• Earnings of $174m, down 5.9% on prior period impacted by competitive pressures in Energy
• Chemicals: Earnings broadly in line with prior period
   – Strong performance from sodium cyanide driven by increased plant production, meeting continued
     robust demand in the gold sector
   – Strong WA EGAN demand due to continued disruption at competing Burrup plant and strength in
     iron ore sector with mine replacements and increased strip ratios
   – EGAN earnings impacted by commencement of new contract terms to secure longer-term customer
     offtake and work to refine the emulsion product offering
   – Ammonia earnings increased, despite a planned maintenance shutdown of a key customer facility

• Energy: Earnings down on prior period
   – Lower Saudi CP1 price impacted LPG earnings combined with lower margins from increased
     competition in natural gas retailing

• Fertilisers: Earnings broadly in line with prior period
   – Strong volume growth due to late seasonal rains in WA
   – Continued investment in customer service and focus on differentiated offering
• Results include costs associated with ongoing management of lithium investment and exploration

1. Saudi Contract Price (the international benchmark indicator for LPG).

                                                                                         2020 Half-year results | 33
Chemicals, Energy and Fertilisers outlook

• Product demand and plant production volumes are expected to remain stable, with iron ore and gold
  market demand remaining robust

• Earnings are expected to moderate
  – Lower EGAN sales volumes as competing Burrup plant comes online in second half
  – Continued price competition in natural gas retailing
  – Grower caution due to lower harvest outcome in CY19 than previous years

• Earnings will continue to be impacted by international commodity prices, exchange rates, competitive
  factors and seasonal outcomes

                                                                                           2020 Half-year results | 34
Industrial and Safety performance summary

                                                                                                                     2019                       2019                         2018                  Var
  Half-year ended 31 December ($m)                                                                       Post AASB 16                 Pre AASB 16                    Reported                        %1

  Revenue                                                                                                               858                       858                         876                (2.1)
  EBITDA                                                                                                                  46                        25                         61              (59.0)
  Depreciation and amortisation                                                                                        (36)                       (19)                        (19)                      -
  EBIT                                                                                                                    10                           6                       42              (85.7)
  Interest on lease liabilities                                                                                           (3)                          -                         -                n.m.
  EBT                                                                                                                       7                          6                       42              (85.7)
  Payroll remediation costs                                                                                            (15)                       (15)                           -                n.m.
  EBT excluding payroll remediation costs                                                                                 22                        21                         42              (50.0)
  EBT margin excluding payroll remediation costs (%)                                                                     2.6                       2.4                        4.8
  RoC2 (R12, %)                                                                                                          3.4                       3.4                        7.5
  Safety (R12, TRIFR)                                                                                                    4.1                       4.1                        7.3
n.m. = not meaningful

1. Variance results to pre AASB16 results.
2. Pre AASB 16 RoC is calculated as EBIT / capital employed. Post AASB 16 RoC is calculated as EBT / capital employed, where capital employed excludes right-of-use assets
   and lease liabilities.                                                                                                                                                       2020 Half-year results | 35
Industrial and Safety overview

• The performance of Industrial and Safety business was disappointing, principally due to continued
  underperformance of Blackwoods
• Revenue of $858m, down 2.1% on prior period
  – Blackwoods revenue declined as sales growth from strategic customers and the Western Australian
    region was offset by declines in other segments
• During the period, a new regional leadership structure was implemented in Blackwoods
  – Supports customer-facing teams to deliver an improved end-to-end customer experience
  – Merchandising, supply chain and support functions remain national functions
  – Service metrics have shown improvement since implementation of new regional leadership structure

• Earnings of $21m (excluding $15m of payroll remediation costs), down significantly on prior period
  – Blackwoods earnings impacted by lower sales, in addition to the impact of ongoing investment in
    customer service, ERP and improving the digital offer
  – Workwear Group earnings declined due to lower revenue and the impact of foreign exchange, with
    the prior year benefitting from one-off insurance proceeds
  – Coregas earnings declined despite revenue growth, due primarily to higher raw material and freight
    costs

                                                                                           2020 Half-year results | 36
Industrial and Safety outlook

• Blackwoods is implementing a number of turnaround initiatives to improve the operating model
  – Implementation of new regional sales structure
  – Continued investments in ERP and other digital capabilities

• Some positive customer feedback and improvement in service metrics recorded to date, but a material
  improvement in Blackwoods’ performance is not expected until the initiatives are complete
• Workwear Group continues to invest in its digital offer and operating efficiencies to meet competitive
  challenges
• Coregas earnings are expected to be impacted by competitive pressure as well as higher input and
  distribution costs

                                                                                             2020 Half-year results | 37
Officeworks
Michael Howard
Acting Managing Director, Officeworks
Officeworks performance summary
                                                                                                                     2019                      2019                          2018                 Var
 Half-year ended 31 December ($m)                                                                        Post AASB 16                Pre AASB 16                     Reported                        %1

 Revenue                                                                                                            1,231                      1,231                     1,100                    11.9
 EBITDA                                                                                                                 137                         94                         90                   4.4
 Depreciation and amortisation                                                                                         (48)                       (15)                        (14)               (7.1)
 EBIT                                                                                                                     89                        79                         76                   3.9
 Interest on lease liabilities                                                                                           (7)                           -                         -               n.m.
 EBT                                                                                                                      82                        79                         76                   3.9
 EBT margin (%)                                                                                                          6.7                       6.4                        6.9
 RoC2 (R12, %)                                                                                                         17.2                      16.9                        17.2
 Safety (R12, TRIFR)                                                                                                     7.1                      7.1                        11.0
 Total sales growth3 (%)                                                                                               11.5                      11.5                         8.2
n.m. = not meaningful

1. Variance calculated on pre AASB16 results.
2. Pre AASB 16 RoC is calculated as EBIT / capital employed. Post AASB 16 RoC is calculated as EBT / capital employed, where capital employed excludes right-of-use assets
   and lease liabilities.                                                                                                                                                       2020 Half-year results | 39
3. Refer to slide 55 for relevant retail calendars.
Officeworks sales overview

• Strong headline sales results                              %               Sales growth momentum
                                                            14
  – Sales growth of 11.5%                                   12
                                                                                                                      11.5
                                                                                         9.7
    o   Strong sales growth in stores and online            10   9.1
                                                                                               8.5    8.2
                                                             8         7.0                                    7.1
                                                                                   6.3
    o   Robust transaction growth as offer continues to      6
                                                                             5.9

        resonate with customers                              4
                                                             2

• Continued focus on improving customer offer                0

  – Early launch of back-to-school program                                    Every Channel Sales Growth

  – New and expanded product ranges
  – Ongoing focus on price, range and service

• Continued investment in ‘every-channel’ strategy
  – Ongoing enhancements to improve the online experience

• Momentum maintained in B2B segment

                                                                                                     2020 Half-year results | 40
Officeworks earnings overview
                                                                                Strong earnings and RoC growth
• Earnings growth of 3.9% to $79m                             $m
                                                                                                                              16.9
                                                                                                                                     %
                                                              180                                                                    18
 – Continued investment in price to maintain customer trust   160                                                                    16
                                                              140                                                                    14
    o   Competitive environment remains intense               120                                                                    12

 – Change in sales mix impacting gross margin
                                                              100                                                                    10
                                                               80   5.7                                                              8

 – CODB increases due to higher team member wages              60                                                                    6
                                                               40                                                        76    79    4
                                                                                                                    68
   partially offset by productivity improvements               20               32   34   38   42    50   59   62
                                                                                                                                     2
                                                                    25     27
                                                               0                                                                     0

• ROC (R12) down 0.3 ppts to 16.9%
                                                                         1H EBIT [LHS]              2H EBIT [LHS]             RoC [RHS]
 – Continued investment in new and expanded product
   ranges
 – Early investment in back-to-school offer
 – Investment in long-term growth initiatives e.g. Geeks2U

                                                                                                               2020 Half-year results | 41
Officeworks progress on strategic agenda

• Our team
  – New Enterprise Agreement for store teams implemented

• Customer experience
  – Improvement in customer satisfaction levels

• Connecting with our communities
  – $800k contributed to the Australian Literacy and
    Numeracy Foundation
  – 84% operational waste recycled

• Operational excellence
  – Productivity improvements mitigating short-term CODB
    pressure and facilitating investment in long-term growth

• Growing our business
  – Townsville store expansion
  – Geeks2U rollout in stores and online

                                                               2020 Half-year results | 42
Officeworks outlook

• Continued focus on strategic agenda to drive long-term
  growth

  – Our team

  – Customer experience

  – Connecting with our communities

  – Operational excellence

  – Growing our business

• Earnings growth to be moderated by ongoing
  investment in price, team and technology

                                                           2020 Half-year results | 43
Group Outlook
Rob Scott
Managing Director, Wesfarmers Limited
Outlook

• The Group’s portfolio of cash-generative businesses with leading market positions is well-placed to
  deliver satisfactory shareholder returns

• Given Wesfarmers’ commitment to a strong balance sheet and the diversity and resilience of the
  portfolio, the Group remains well-positioned for a range of economic conditions

• Retail divisions remain focused on customers and delivering even greater value, quality and
  convenience

• Businesses will maintain focus on enhancing e-commerce offer and digital capabilities

• The Group’s divisions are assessing the impact of the coronavirus outbreak including closely
  monitoring the recommencement of supplier operations in affected regions

• The Group will accelerate plans to address unsatisfactory returns in Industrial and Safety, and Target

• The Group will continue to develop and enhance its portfolio, building on its unique capabilities and
  platforms to take advantage of growth opportunities within existing businesses, recently acquired
  investments and to pursue transactions that create value for shareholders over the long term

                                                                                             2020 Half-year results | 45
Questions
Appendix:
Supplementary Information
AASB 16 Leases – Balance sheet impact

                                                  Balance sheet impact at 1 July 2019                        $m
• Wesfarmers has applied AASB 16 from
  1 July 2019                                     Right-of-use assets                                      6,352

                                                  Deferred tax asset                                          222
• Adopted the ‘modified retrospective approach’
  – Comparative periods will not be restated      Lease liabilities                                     (7,275)

                                                  Provisions (reduction in liability)                         183
• Discount rate at initial application of 3.4%
                                                  Leasing reserve (in equity)                                 518
• Reduction in provisions of $183m relate
  primarily to de-recognition of stepped lease
  provisions                                      Treatment of lease options
• Net impact of $518m on initial application      The lease term used to calculate the lease liability
  recognised directly in equity as leasing        includes options to extend the lease which are
  reserve                                         considered to be reasonably certain, which is when:
                                                  • Extension option date is within 12 months and no
• As previously announced, the implementation       decision has been made to terminate
  of AASB 16 has no impact on debt covenants
                                                  • A decision has been made to extend the lease
  and is not expected to result in a change in
  the Group’s credit ratings                      • There is a clear economic incentive for extension

• No change to decision-making processes as
  a result of new standard

                                                                                           2020 Half-year results | 48
AASB 16 Leases – P&L impact

• Occupancy expenses reduce by $580m,
  offset by:                                    Half-year ended 31                    2019           2019            Var
                                                December ($m)                   Post AASB 16   Pre AASB 16           ($m)
  – Increase in depreciation on right-of-use
    asset of $464m                              Revenue                              15,249        15,249                 -

  – Increase in interest on leases of $119m     Other income and associates             202             222          (20)

• Net impact of AASB 16 (other than             Occupancy expenses                     (233)          (813)           580
  treatment of gains on sale and leaseback)
                                                Other expenses (excl D&A)           (12,743)      (12,743)                -
  dependent on lease maturity:
  – At the start / end of the lease, net        EBITDA                                 2,475         1,915            560
     expense is higher / lower under            Depreciation and amortisation          (277)          (277)               -
     AASB 16 as interest is calculated based
     on the remaining lease liability, which    Depreciation of lease assets           (464)                 -     (464)
     reduces over the term                      EBIT                                   1,734         1,637              97
  – Across the Group’s lease portfolio, this
                                                Interest on leases                     (119)                 -     (119)
     impact is broadly neutral, with no
     material net impact on NPAT                EBIT after lease interest              1,615         1,637           (22)

• Reduction in other income of $20m due to      Finance costs                           (69)            (69)              -
  the deferral of gains on sale and
                                                Tax                                    (336)          (343)               7
  leaseback as required by AASB 16
  – Offset by lower depreciation for the term   NPAT                                   1,210         1,225           (15)
    of the lease

                                                                                                   2020 Half-year results | 49
AASB 16 Leases – Cash flow impact

                                             Half-year ended 31                      2019          2019              Var
• AASB 16 results in a reclassification of   December ($m)                    Post AASB 16   Pre AASB 16            ($m)

  some cash flows from ‘operating’ cash      Receipts from customers,
                                                                                   17,098        17,098                   -
  flows to ‘financing’ cash flows            dividends and interest income
                                             Payments to suppliers and
                                                                                  (14,381)      (14,965)             584
• Payments to suppliers (rental expense)     employees
  decreases by $584m offset by:              Borrowing costs                         (184)          (65)          (119)
  – Increase in borrowing costs of $119m
  – Increase in repayment of lease           Income tax paid                         (402)         (402)                  -

    liabilities of $465m
                                             Total operating cash flows             2,131         1,666              465
• No net impact on cash flows

• Wesfarmers will continue to report         Investing cash flows                  (1,092)       (1,092)                  -
  operating cash flow and free cash flow
  metrics inclusive of lease cash flows      Repayment of lease liabilities          (465)                -        (465)
  (rent) to support analysis of cash flow
  performance                                Other financing cash flows              (933)         (933)                  -

                                             Total financing cash flows            (1,398)         (933)           (465)

                                             Net cash flows                          (359)         (359)                  -

                                                                                                   2020 Half-year results | 50
Significant items and discontinued operations summary

Significant items1                                                                                                                                Estimated
 Half-year ended 31 December 2018 ($m)                                                                             Pre-tax                       tax impact2                       Post-tax
 Gain on demerger of Coles                                                                                              2,312                                  (60)                       2,252
 Gain on sale of Bengalla                                                                                                 679                                  (96)                          583
 Gain on sale of KTAS                                                                                                     267                                  (48)                          219
 Gain on sale of Quadrant Energy                                                                                          138                                  (31)                          107
 Provision relating to supply chain modernisation in Coles                                                              (146)                                   44                        (102)
 Total significant items                                                                                                3,250                                 (191)                       3,059

 Half-year ended 31 December 2019 ($m)
 Capital losses in BUKI (disposed in June 2018)                                                                                -                                84                             84
 True-up of tax base in Coles                                                                                                  -                                10                             10
 Tax expense on sale of Bengalla                                                                                               -                               (11)                         (11)
 Total significant items                                                                                                       -                                83                             83

Discontinued operations
 Half-year ended 31 December ($m)                                                                              Effective date                                     2019                    2018
 Coles3                                                                                                   28 November 2018                                            -                      478
 Bengalla (40% interest)                                                                                    3 December 2018                                           -                        95
 KTAS                                                                                                       1 November 2018                                           -                        10
 Quadrant Energy (13.2% indirect interest)                                                                27 November 2018                                            -                          4
 Total EBIT from discontinued operations                                                                                                                              -                      587

1. All significant items in 2019 relate to discontinued operations.
2. Tax impact on divestments may vary depending on final assessment of available tax losses.
3. Excludes $146m provision for supply chain modernisation, reported as a significant item. Excludes Wesfarmers’ share of earnings from 15% stake in Coles.               2020 Half-year results | 51
Group management balance sheet – overview

 ($m)1                                                                      1H20                    FY19                     1H19                   Commentary (versus 1H19)

 Inventories                                                                4,578                    4,246                   4,374                   • Increase reflects acquisition of Catch
                                                                                                                                                       and store network expansion
 Receivables and prepayments                                                1,124                    1,203                   1,152

 Trade and other payables                                                (4,130)                  (3,620)                  (4,108)
                                                                                                                                                     • Decrease in cash in transit due to timing
 Other                                                                         150                      266                      195                   of last trading days

 Net working capital                                                        1,722                    2,095                   1,613

 Property, plant and equipment                                              4,721                    3,877                   3,965
                                                                                                                                                         Increase due to acquisitions of Kidman
                                                                                                                                                         and Catch
 Intangibles                                                                4,285                    4,076                   4,044

 Other assets                                                               3,429                    3,550                   3,456

 Provisions and other liabilities                                        (1,643)                  (1,484)                  (1,492)

 Total capital employed                                                   12,514                   12,114                  11,586
                                                                                                                                                     • Increase due to use of cash to fund
 Net financial debt2                                                     (2,317)                  (2,116)                     (324)                    Kidman and Catch acquisitions, as well
                                                                                                                                                       as special dividend paid April 2019

 Net tax balances                                                                60                     (27)                       30

 Total net assets                                                         10,257                     9,971                 11,292

1. Balances reflect the management balance sheet, which is based on different classification and groupings from the balance sheet in the Appendix 4D and is shown
   pre AASB 16.
2. Interest bearing liabilities less cash at bank and on deposit, net of cross-currency interest rate swaps and interest rate swap contracts. Excludes lease liabilities.       2020 Half-year results | 52
Retail store networks
As at 31 December 2019

                  More than 1,000 locations across Australia and New Zealand

Brand                    NSW/ACT   VIC    QLD      SA     WA     TAS     NT     NZ            Total

Bunnings
 Warehouse                    77    60      49     17     32       7      3      28              273
 Smaller format               18    15      13      3      8       -      -      17               74
 Trade                         7     3       7      2      3       1      -       8               31
Total Bunnings               102    78      69     22     43       8      3      53              378

Kmart Group
 Kmart                        58    54      49     15     27       5      3      25              236
 Target – large format        57    46      35     17     21       5      2       -              183
 Target – small format        32    23      27      8     10       1      1       -              102
Total Kmart Group            147   123     111     40     58      11      6      25              521

Officeworks                   57    51      30     10      16      2      1         -            167

                                                                               2020 Half-year results | 53
Revenue reconciliation – Kmart Group

 Half-year ended 31 December ($m)                                       2019                 20181

 Segment revenue (Gregorian)                                            4,990                 4,639

 Less: Non sales revenue                                                 (33)                       (6)

 Headline sales (Gregorian)                                             4,957                 4,633

 Add: Gregorian adjustment2                                              102                      102

 Headline sales revenue (Retail)3                                       5,059                 4,735

1. 2018 excludes KTAS.
2. Adjustment to headline sales revenue to reflect retail period end.
3. Refer to slide 55 for relevant retail calendars.                             2020 Half-year results | 54
Retail calendars

      Business                                           Retail sales period
      Bunnings, Officeworks and Catch
       1H20                               1 Jul 2019 to 31 Dec 2019 (6 months)
       1H19                               1 Jul 2018 to 31 Dec 2018 (6 months)
       1H18                               1 Jul 2018 to 31 Dec 2018 (6 months)
      Kmart
       1H20                                1 Jul 2019 to 5 Jan 2020 (27 weeks)
       1H19                             25 Jun 2018 to 30 Dec 2018 (27 weeks)
       1H18                             26 Jun 2017 to 31 Dec 2017 (27 weeks)
      Target
       1H20                              30 Jun 2019 to 4 Jan 2020 (27 weeks)
       1H19                             24 Jun 2018 to 29 Dec 2018 (27 weeks)
       1H18                             25 Jun 2017 to 30 Dec 2017 (27 weeks)

                                                                             2020 Half-year results | 55
You can also read